JPMorgan Chase & Co. (JPM) is an American multinational investment bank and financial services holding company headquartered in New York City and incorporated in Delaware. As of December 31, 2021, JPMorgan Chase is the largest bank in the United States, the world’s largest bank by market capitalization, and the fifth-largest bank in the world in terms of total assets, with total assets totaling to US$3.831 trillion.
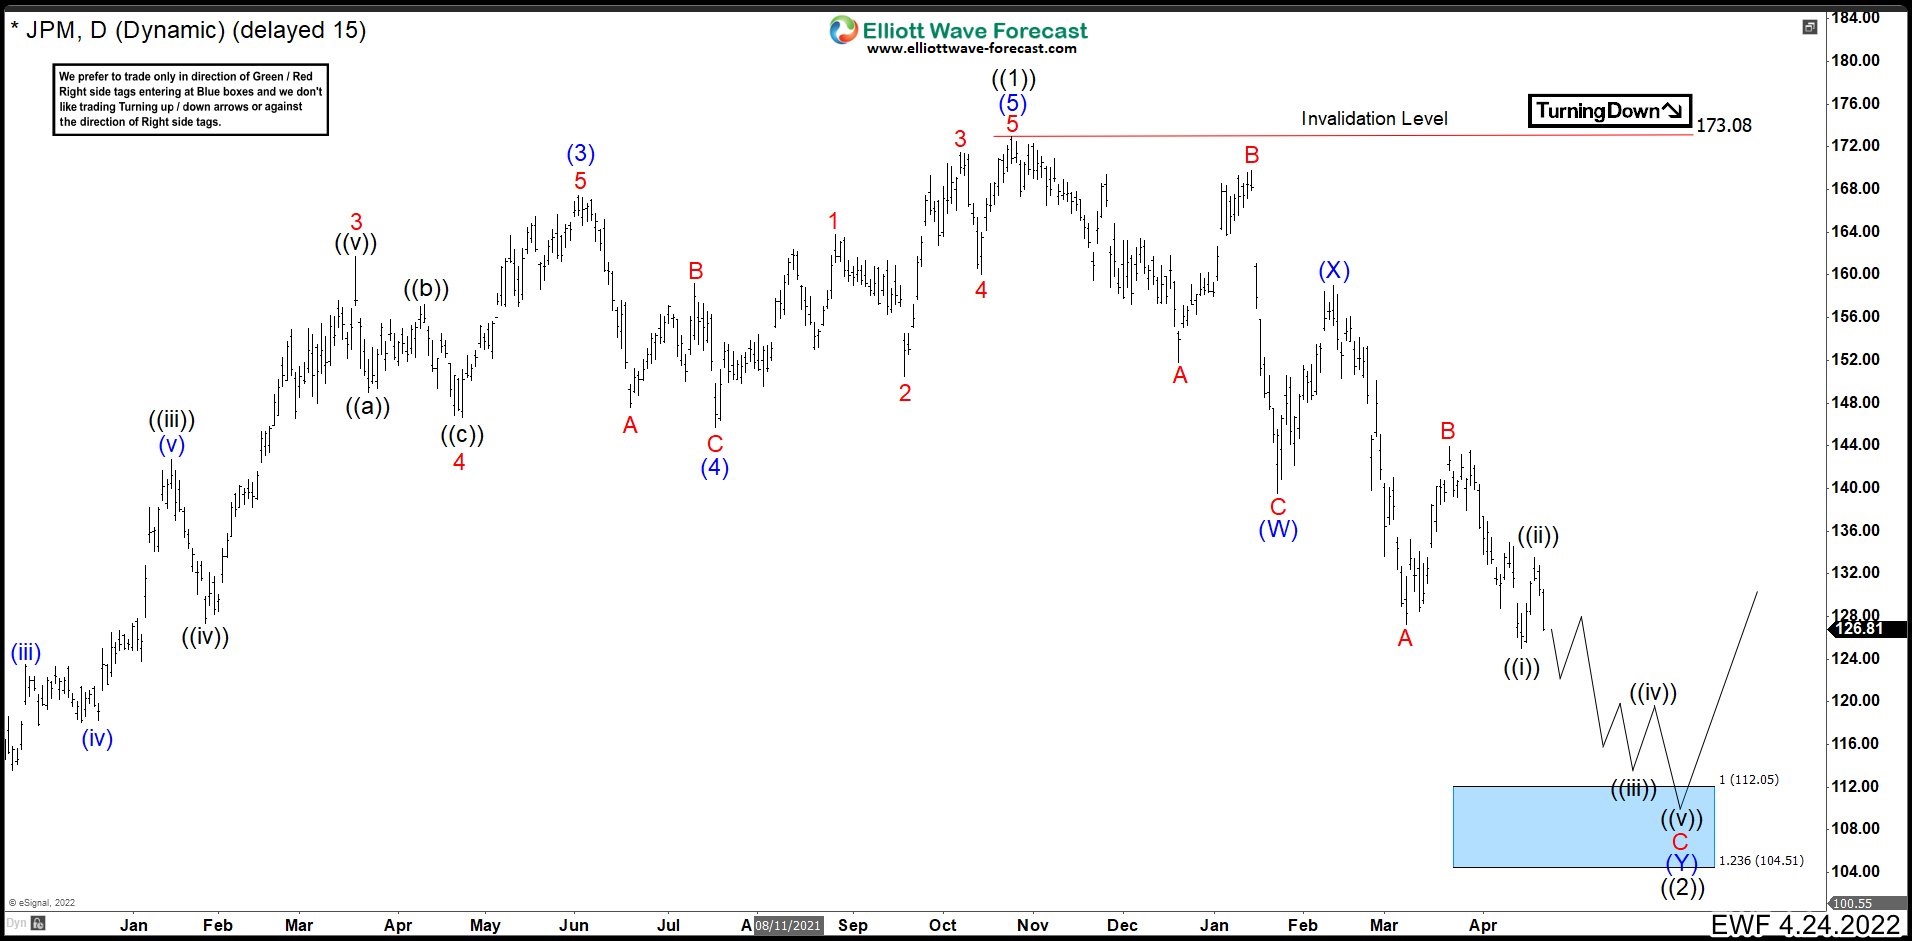
JPM Daily Chart April 2022
JPMorgan (JPM) completed a market cycle at 172.96 on October 2021 from March 2020 low. From the peak, the stock bank has been falling in the last 6 months and it was building a double correction according to the Elliott Theory. A double correction is a 7 waves structure. We can see the first wave which we call wave A, it ended at 151.84. Then the bounce went very high reaching 169.81 to complete wave B. Finally, JPM turned lower to complete wave C at 139.57, and the first set of 3 waves as wave (W). (If you want to learn more about Elliott Wave Theory, follow these links: Elliott Wave Education and Elliott Wave Theory).
Rally from wave (W) is a connector as wave (X) ended at 159.03. From here we need a new set of 3 swing to complete a double correction. Wave A ended at 127.27. Pullback as wave B ended at 143.93 and turn lower. This last swing down needs to be an impulse to complete wave C. As we can see wave ((i)) of the impulse ended at 125.02. Wave ((ii)) bounce completed at 133.51 and we are building wave ((iii)) continuing with the bearish momentum. We are calling more downside to come and it should target to 112.05 – 104.51 area before JPM rally again. Overall, the whole financial sector needs more downside in the market before rally.
Source: JPMorgan (JPM) Could Lose More Than 10% Before Rally
