JPMorgan Chase & Co. (JPM) is an American multinational investment bank and financial services holding company headquartered in New York City and incorporated in Delaware. As of December 31, 2021, JPMorgan Chase is the largest bank in the United States, the world’s largest bank by market capitalization, and the fifth-largest bank in the world in terms of total assets, with total assets totaling to US$3.831 trillion.
JPM Daily Chart June 2023
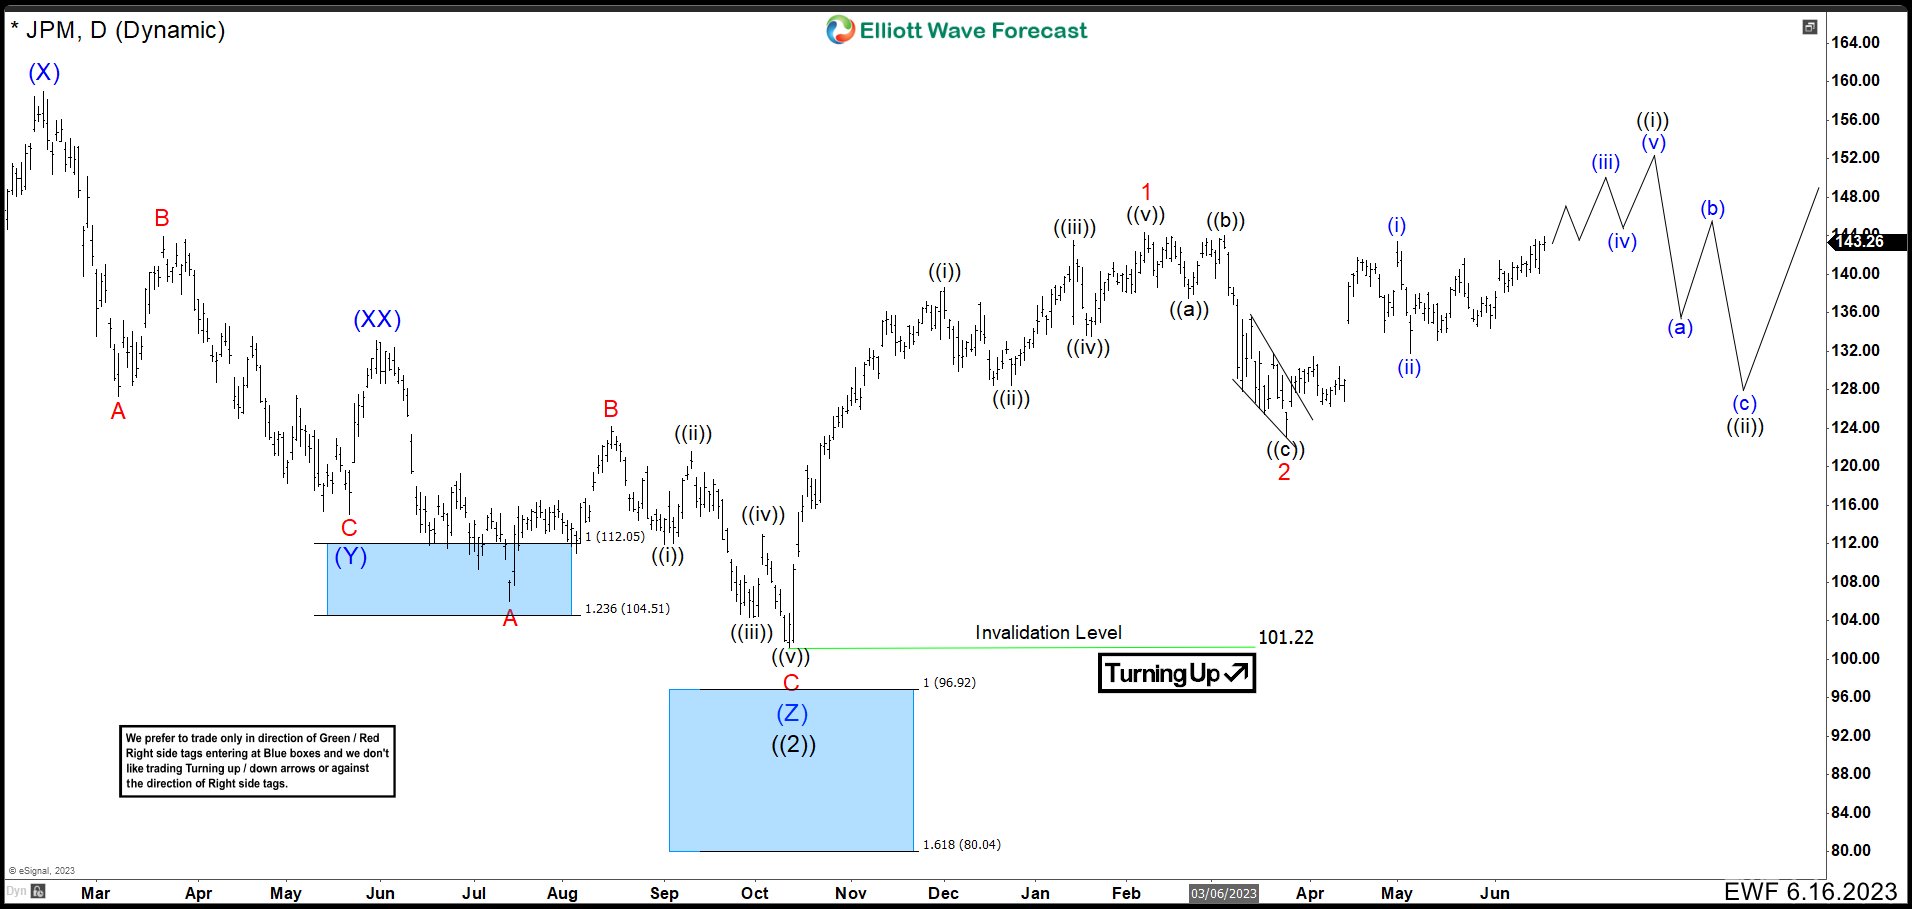
In the last JPM update, we showed a cycle ended as wave ((2)) near to a blue box at 101.22. Then, we can see how price action built 5 waves higher to end the leading diagonal at $144.34 as wave 1. Then, it developed a flat correction 3-3-5, where wave ((c)) was a clear ending diagonal to finish wave 2 at $123.11. After this, the market continued to the upside and we called that the stock should continue with this trend until completing another impulse as wave ((i)) before seeing 3, 7 or 11 swings correction as wave ((ii)).
JPM Daily Chart October 2023
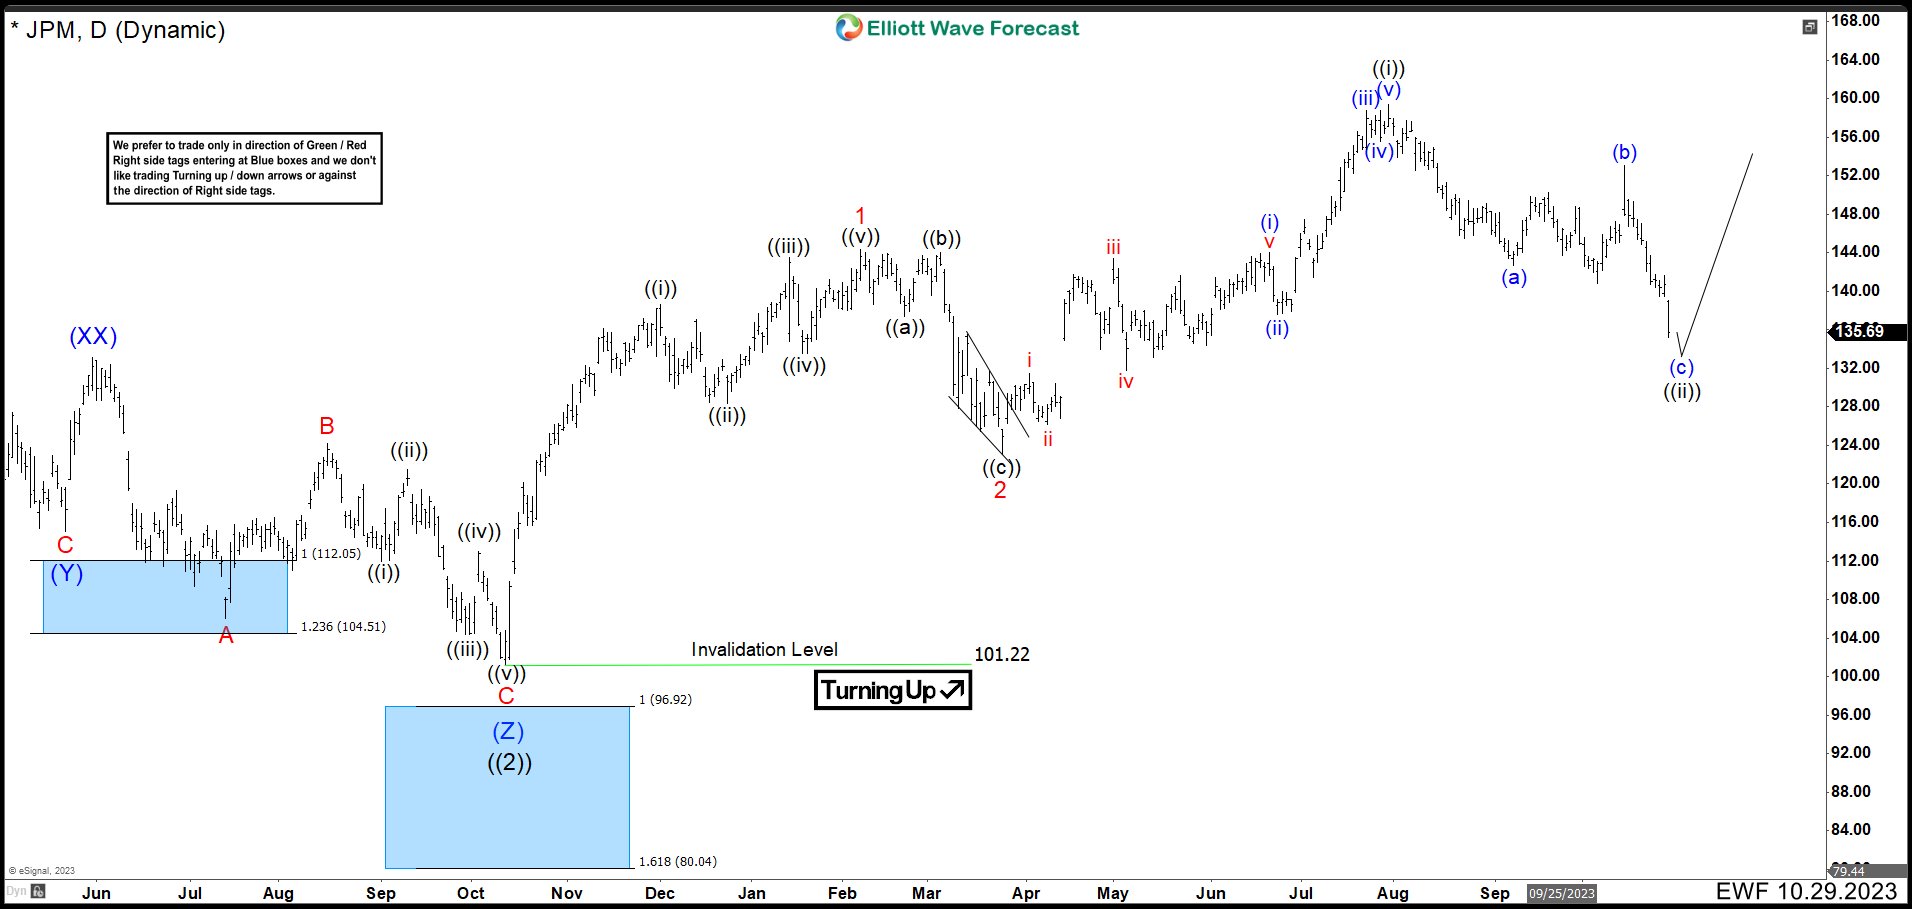
The chart above, we show how the market continued higher as expected and it ended wave ((i)) at 159.38. Then, the price action developed clearly 3 swings lower where wave (b) is a flat correction and it should keep dropping to 134.59 - 130.20 area to end wave ((ii)) before turning higher again. However, the market conditions have changed. The structure of the SPX shows us that it could be building a correction lower and that does not fit with the actual JPM structure in the chart. Therefore, we are going to show you some alternatives that could happen using monthly timeframe.
JPM Monthly Chart October 2023 (Alternative 1)
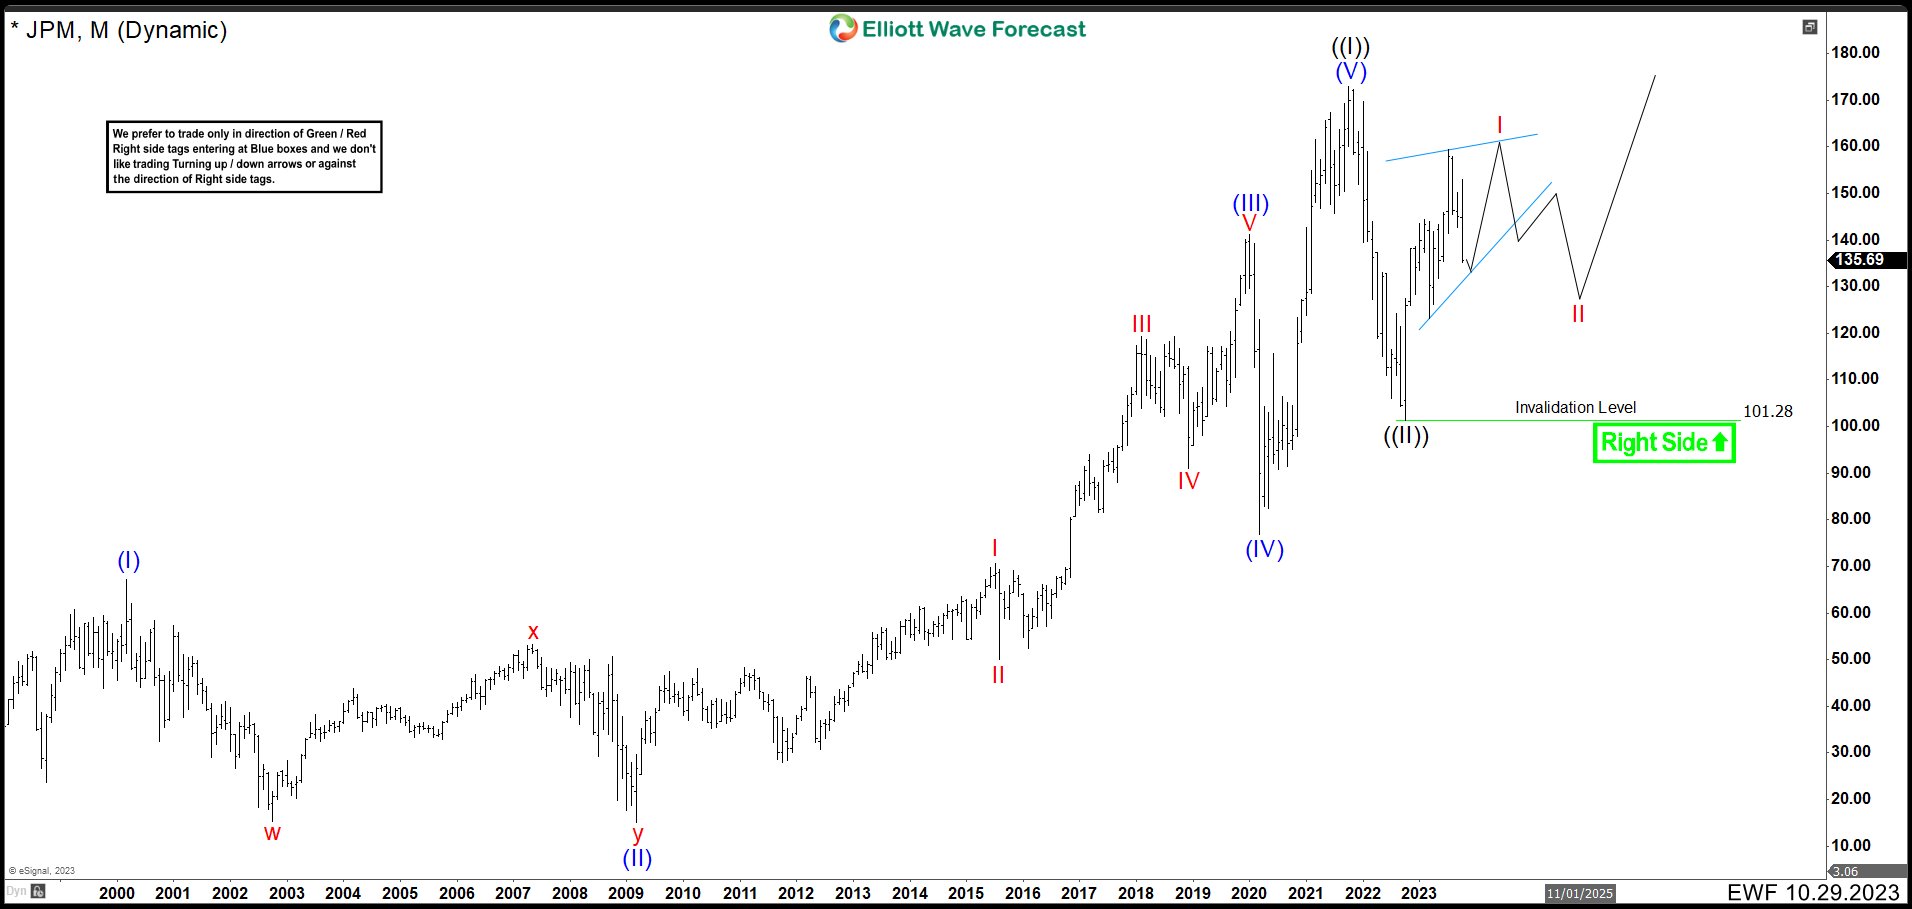
In this first alternative, we are calling that JPM has ended a Grand Super Cycle in October high of 2021 and we labeled as wave ((I)). Down from the peak, wave ((II)) correction finished at 101.28. This is the best scenario for JPMorgan. In this case, we need to break above 159.38 high being the key to avoid a big correction. This break should completed a leading diagonal structure as wave I from 101.28 low. Once this occurs, then we expect 3, 7 or 11 swings correction as wave II to stay above 101. 28 before seeing further upside.
JPM Monthly Chart October 2023 (Alternative 2)
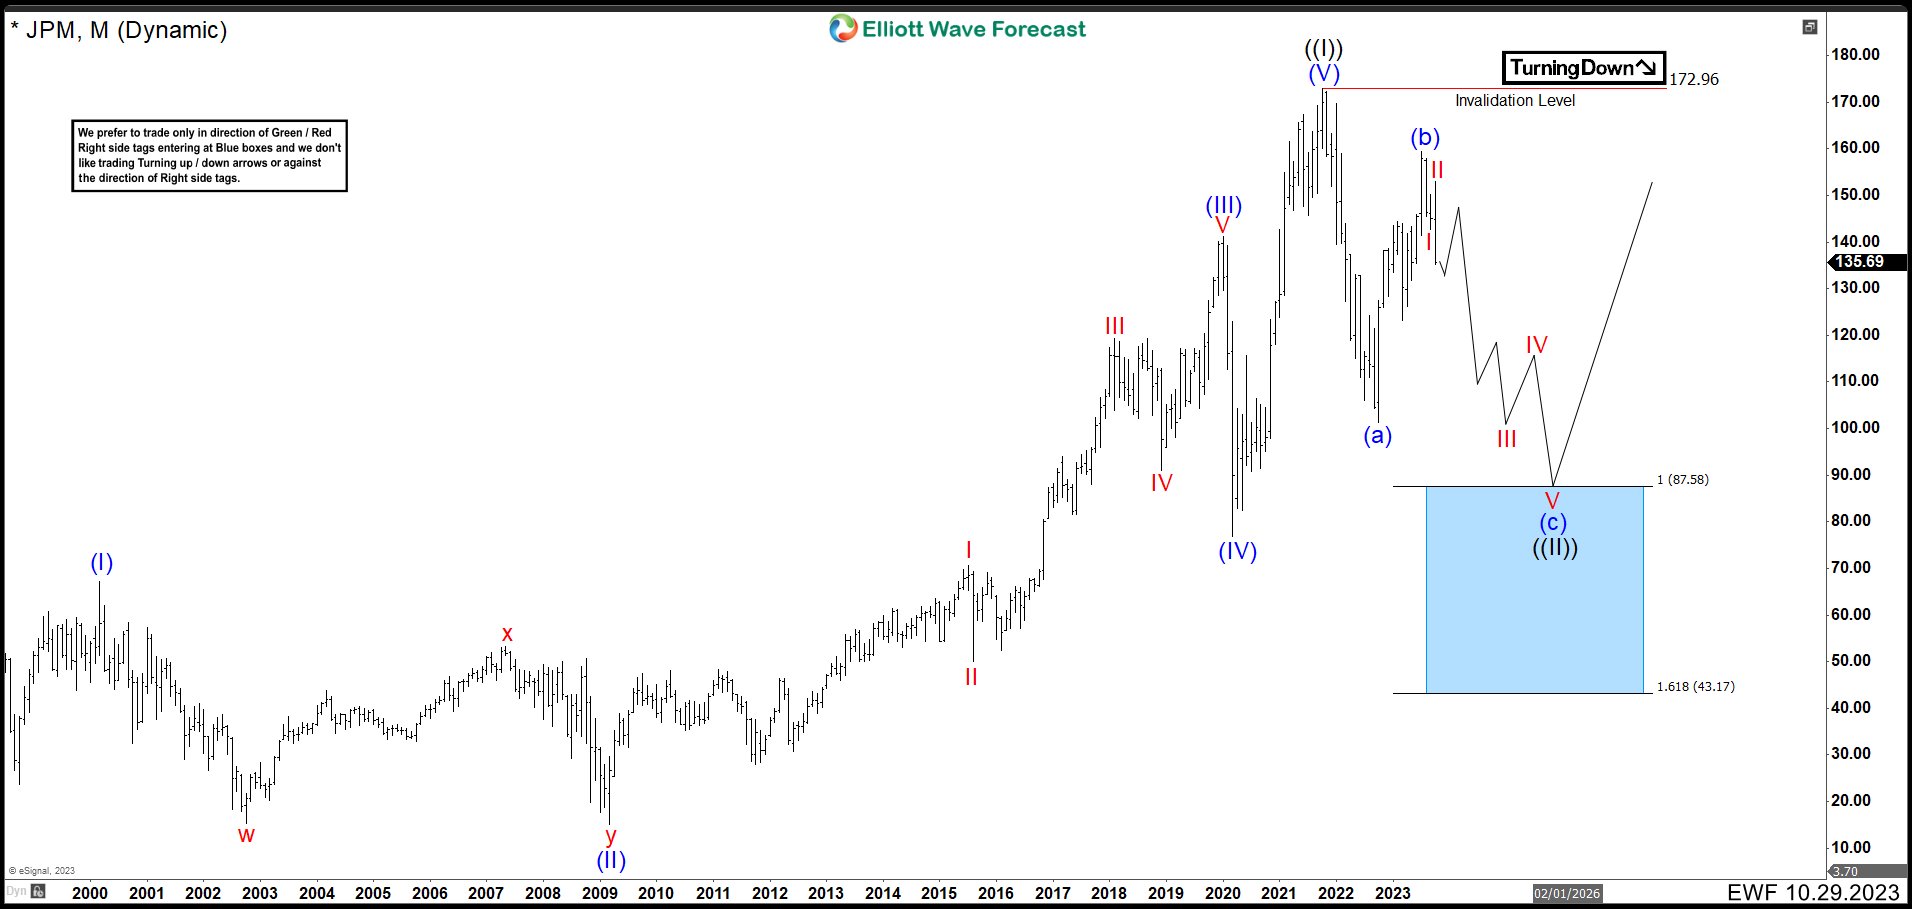
The chart above is the worst scenario for JPM. That is wave ((II)) is not completed and it needs more downside to finish the correction. In this case, wave (a) ended at 101.28 low and wave (b) ended at 159.38 high. Therefore, market should continue lower to 87.58 - 43.17 blue box area where it should resume the rally again. There are some structures to send JPM prices lower; however, we have chosen this one. In this view, the stock is currently in wave ((1)) of III and after ending wave ((1)) lower, it should bounce in 3, 7 or 11 swings higher to develop wave ((2)) of III. This bounce cannot break above 159.28 high and once wave ((2)) is completed the drop in the market should accelerate. That is why 159.38 is key. A break higher of this level should keep the market above 101.28, but in the other hand, the market could collapse as low as 43.17.