In our last update on GDXJ from November 2021, we mentioned that the ETF has already started the next leg higher. From the January 28 low of $36.55 to April 18 high of $51.92, it has rallied 42% higher. The ETF last week started to selloff and today we are going to update on the outlook for GDXJ.
GDXJ Monthly Chart
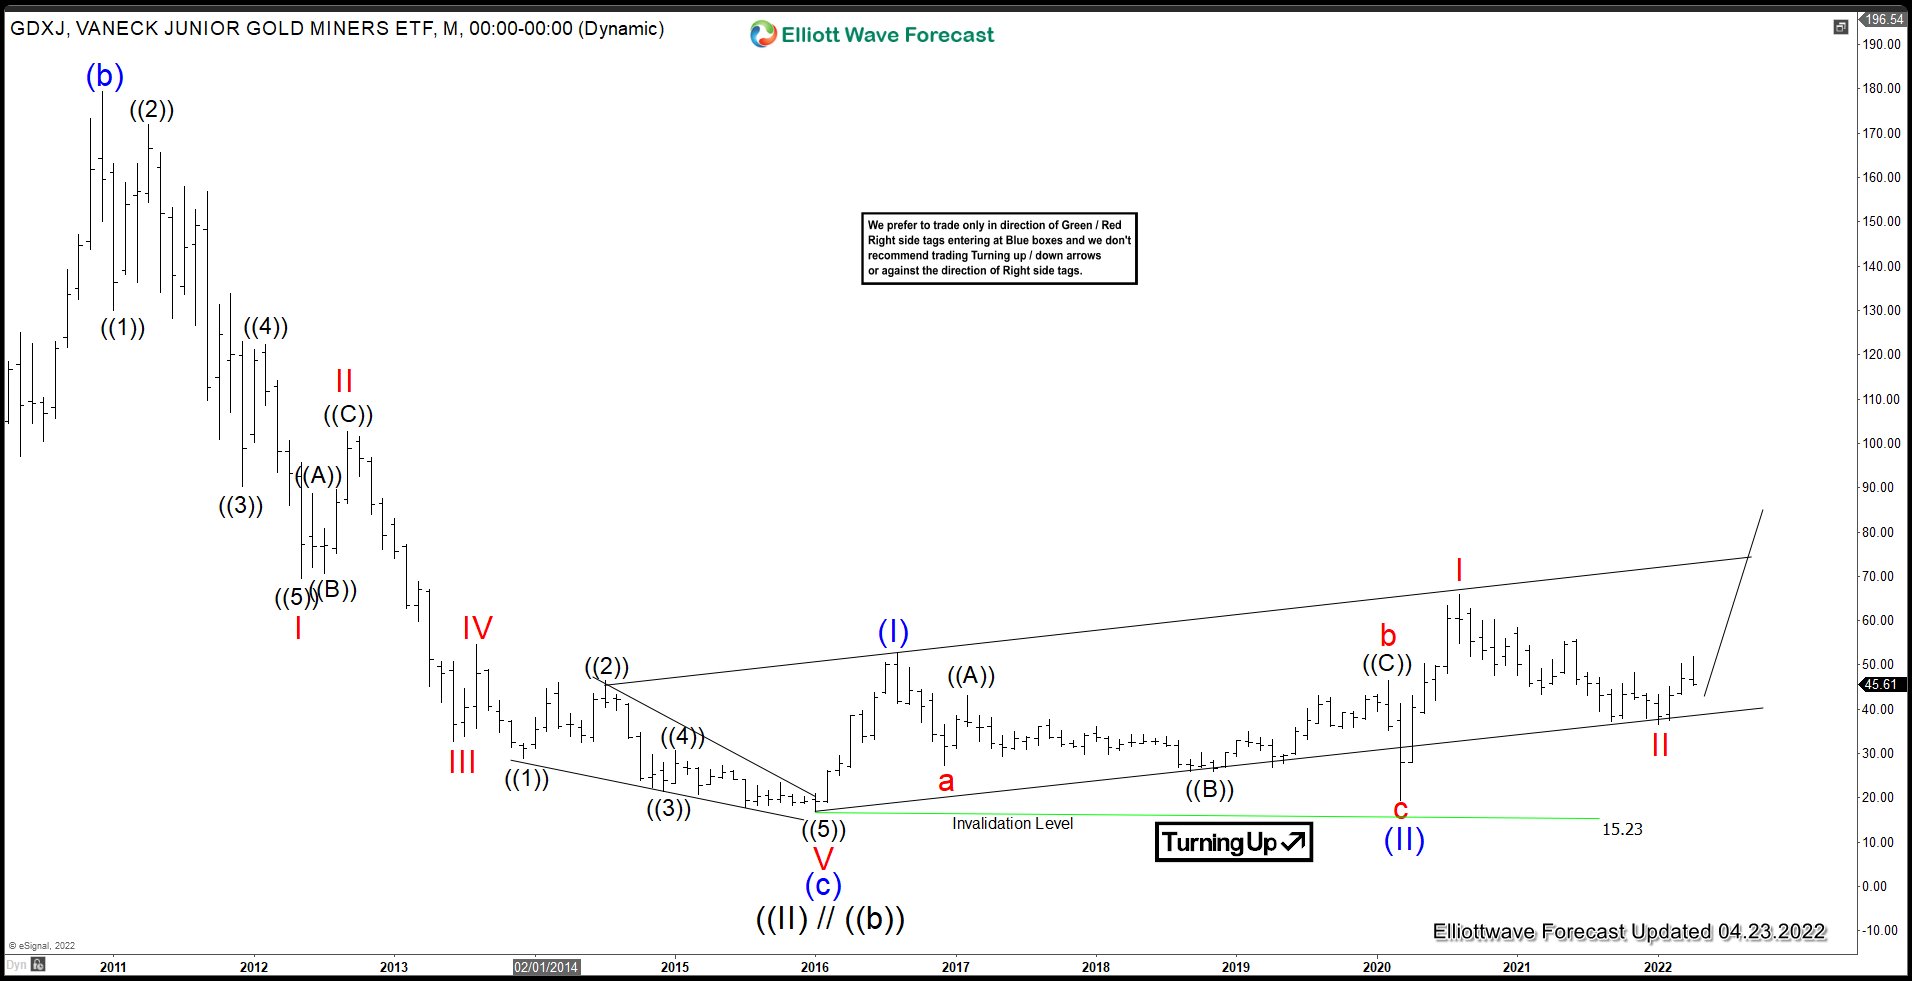
GDXJ has completed grand super cycle wave ((II)) low on January 2016 at $16.87. Since then, the ETF has rallied as a nesting impulse. Up from wave ((II)), wave (I) ended at $52.50 and pullback in wave (II) ended at $19.52. The ETF then nested in wave (III). Above wave (II), wave I ended at $65.95 and pullback in wave II ended at $36.55. Expect the ETF to extend higher as long as it manages to stay above wave II at $36.55.
GDXJ Daily Chart
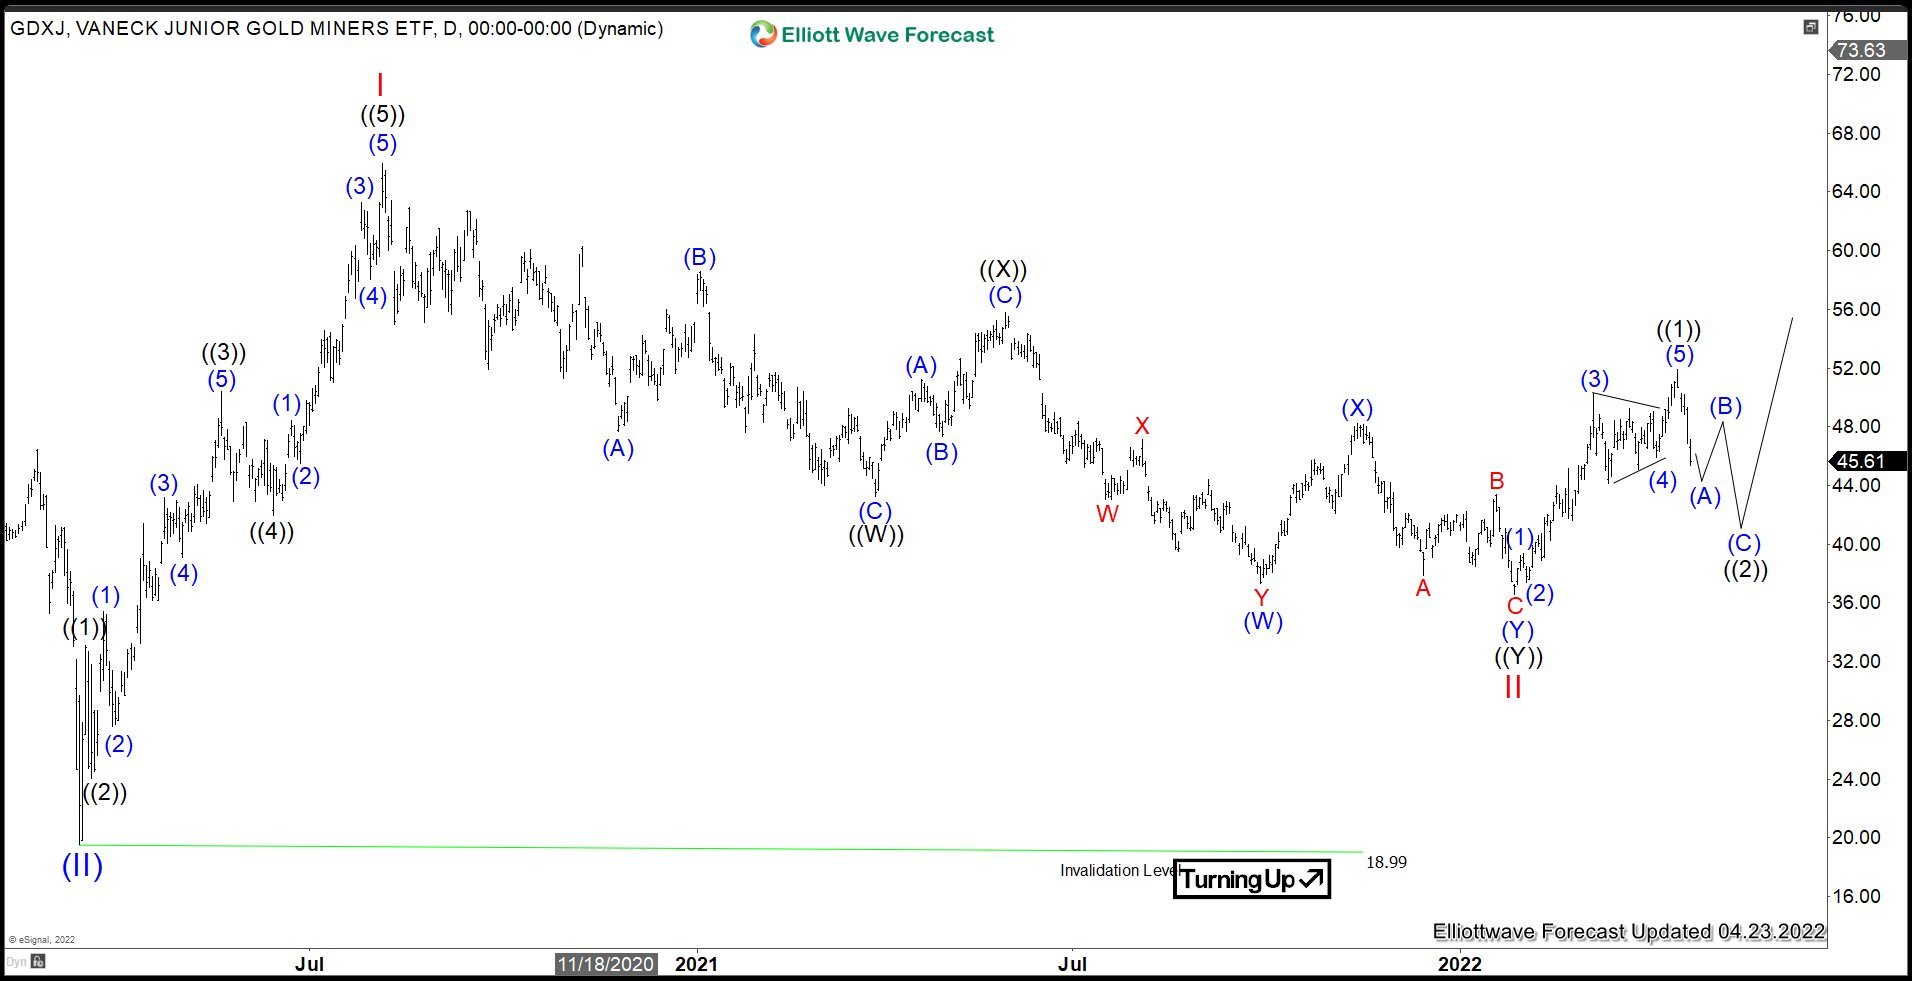
The Daily chart above shows the rally from wave II ended wave ((1)) as an impulse at $51.92. The ETF is now pulling back in wave ((2)) to correct the cycle from January 28, 2022 low in 3, 7, or 11 swing before the rally resumes. The pullback could unfold as a zigzag (A)-(B)-(C) and potential target is 50% - 76.4% retracement of wave ((1)) at $40.15 -$44.19 before it resumes higher again.