Gold and related miners formed a high on August 2020 and they have pulled back for more than 1 year. In our last article from 2 months ago, we provided a support area of $18.5 - $32.6. It looks like Gold Miners did not quite reach the 100% extension area and already ended the correction. This article is the latest update on Gold Miners Junior (GDXJ) ETF.
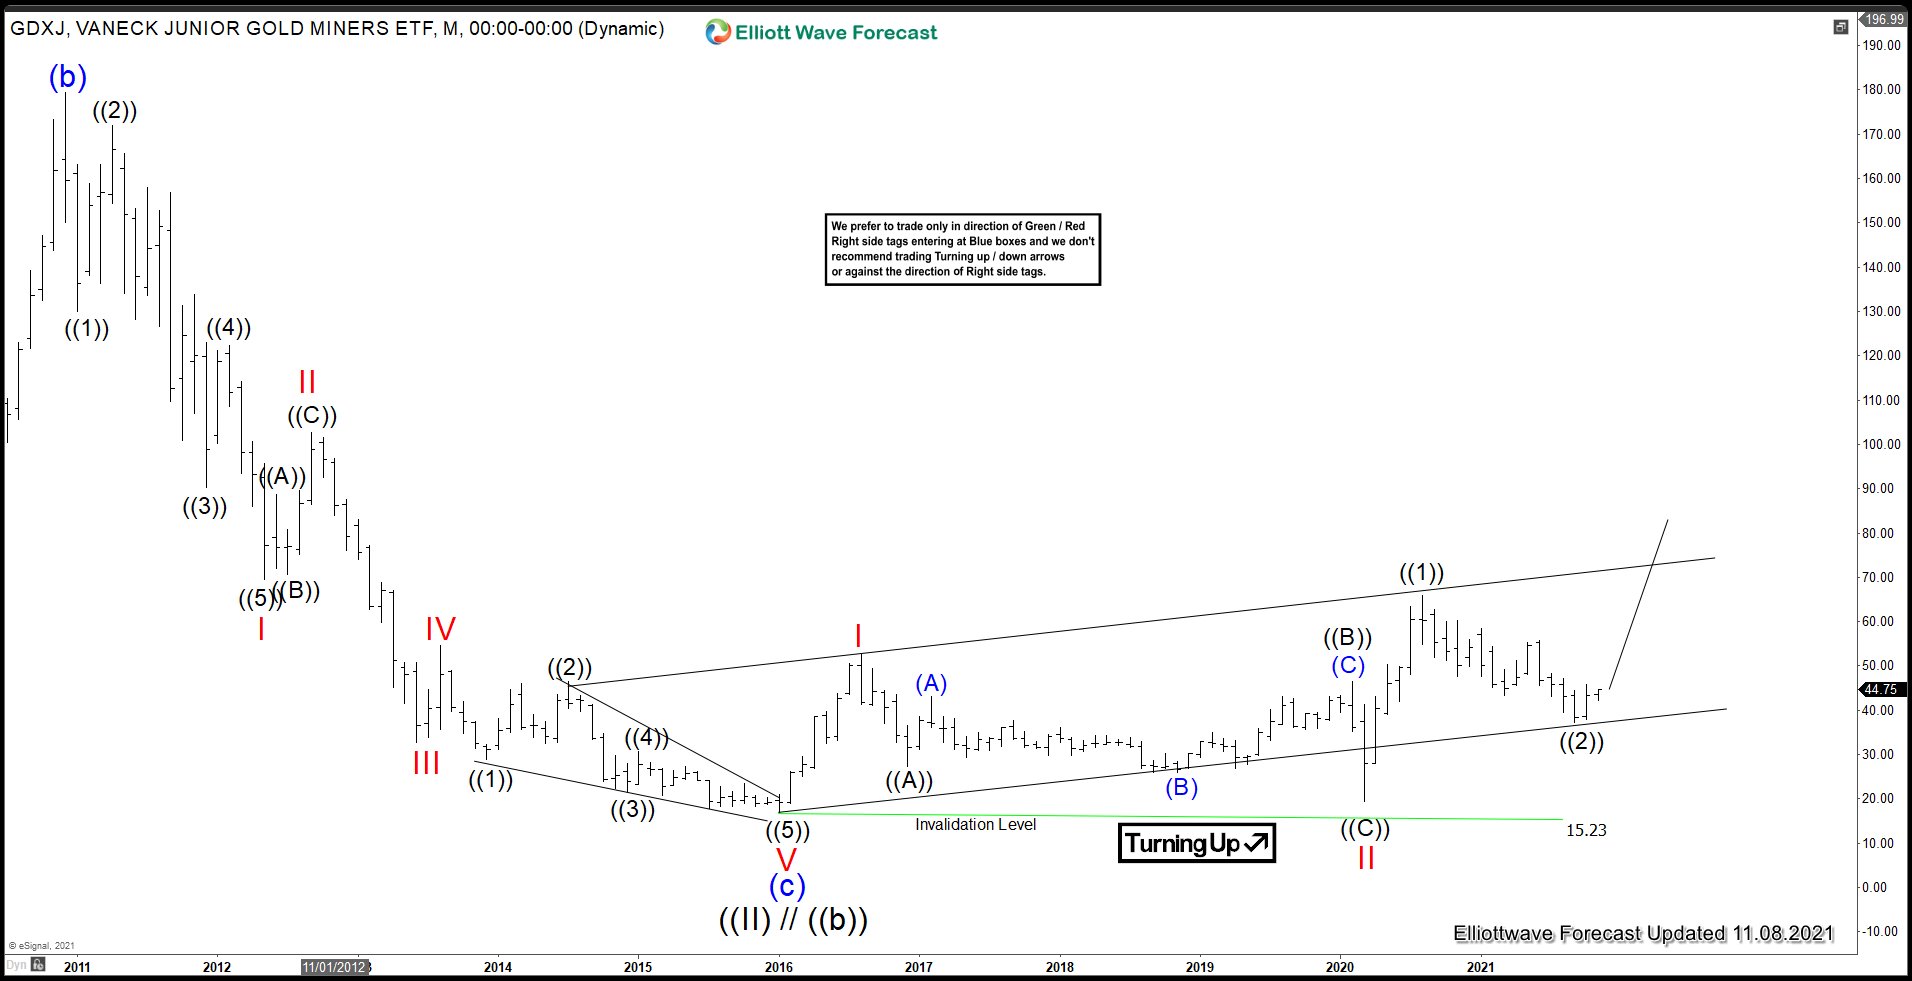
GDXJ Monthly Chart
Since topping out on August 2020 peak, Gold Miners Junior (GDXJ) has retraced 61.8% of the rally from March 2020 low. The correction has likely likely completed. As the chart above shows, the rally from January 2016 low (15.23) low is proposed to be unfolding as a 5 waves impulse. Up from January 2016 low, wave I ended at $52.50 and pullback in wave II ended at $19.52. The ETF then extends higher again in wave III which subdivides into another 5 waves in lesser degree. Up from wave II, wave ((1)) ended at $65.95 and dips in wave ((2)) ended at $37.31. The ETF has turned higher and should rally in a powerful wave ((3)) of III.
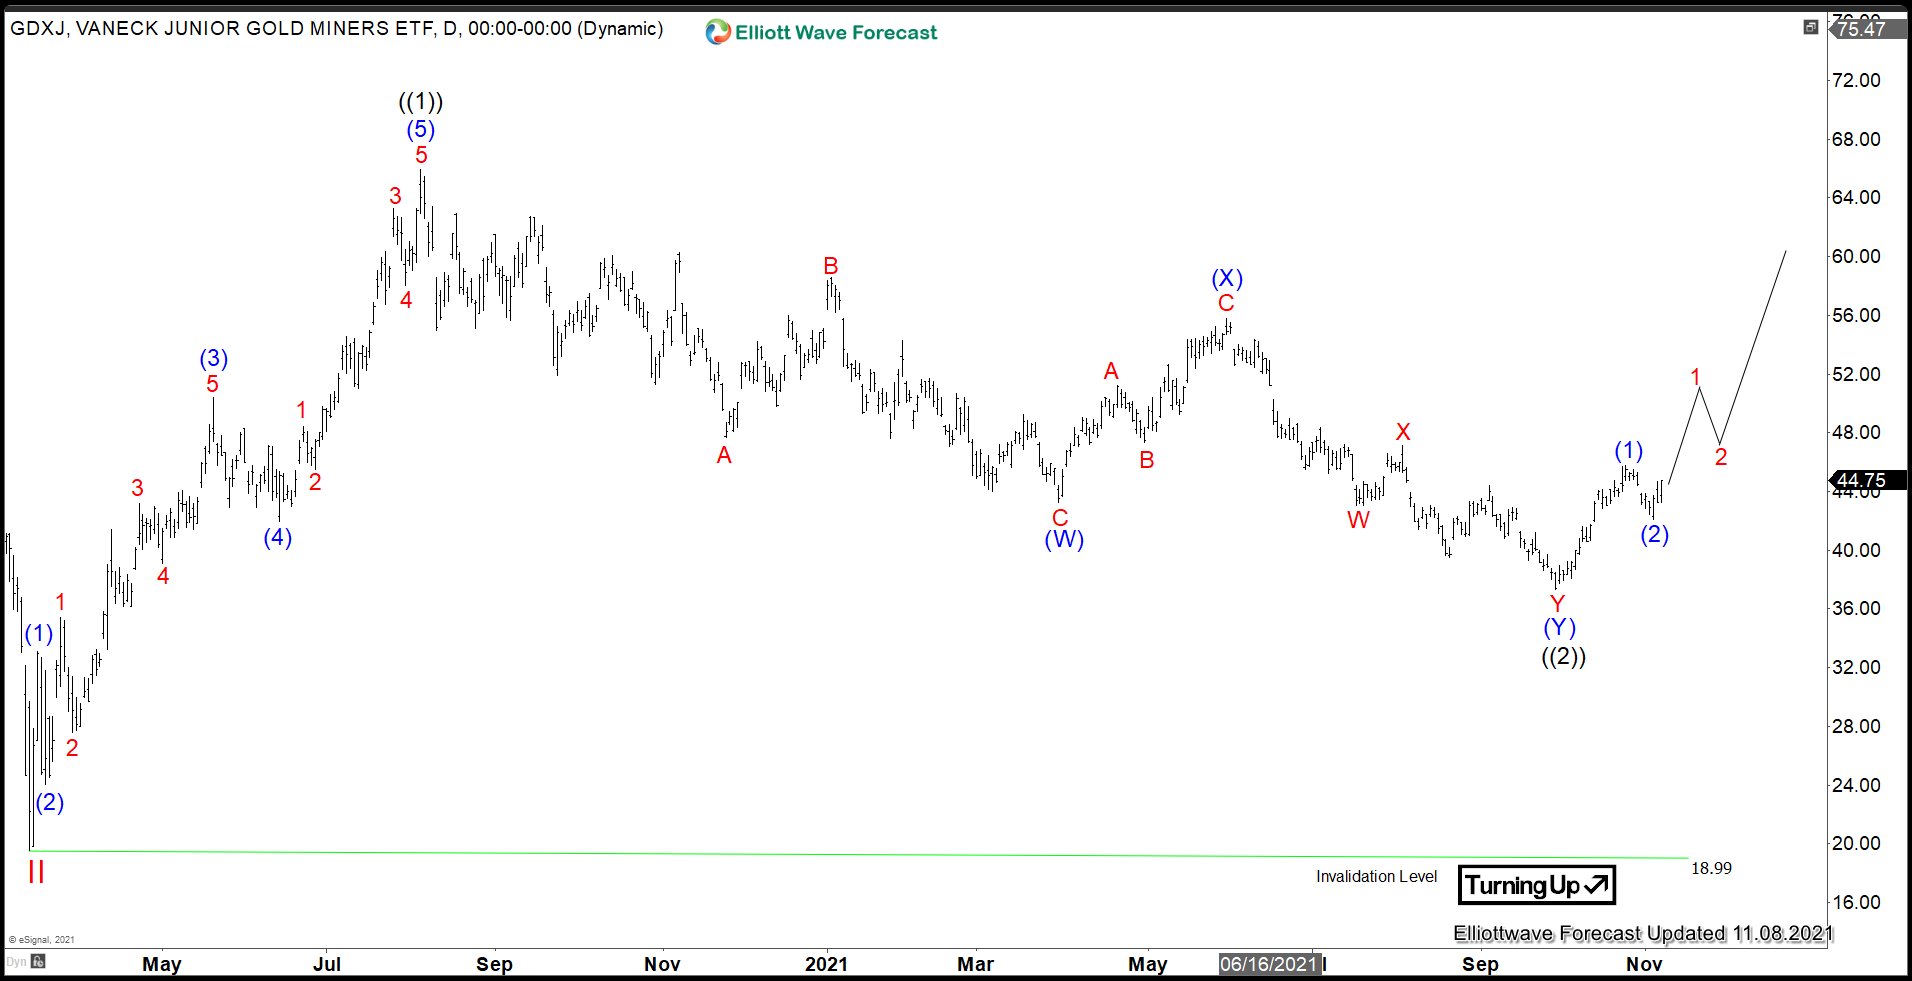
GDXJ Daily Chart
The Daily chart above shows that GDXJ ended wave ((1)) at $65.95 on August 2020 peak. It then corrects the rally from wave II low on March 2020 for 13 months before ending wave ((2)) at $37.31. It has turned higher with structure of the rally looking impulsive. Up from wave ((2)), wave (1) ended at $45.75 and dips in wave (2) ended at $42.12. Near term, while above $42.12, and more importantly above $18.99, expect the ETF to extend higher.

