Let it Ride...Basic, Long Term Strategy Testing for the Working Stiff

No, this is not an advertisement, lol. I’ve been wanting to test this strategy for some time now, so what better place to document it than here?

My plan is to enter a trade and let it ride, either to the SL or TP. Enter it, then forget it. Hey, it’s got to go somewhere, right? So if my trend lines and S&R’s are accurate and the stars are aligned, then more will hit the TP than not.

Sounds too good to be true, right? Well it probably is because I’m a dreamer. And I know there are a lot of skeptics out there when it comes to chart patterns, but for the most part they work for me.

The whole idea is to keep things as simple as possible by only using basic chart patterns combined with RSI (my indicator of choice) to determine an entry point. That’s it, that’s all, no noise. This will take confidence, knowledge of chart patterns, some luck and lots and lots of patience…IF it even works. It will definitely be a test for me in all 3 categories.

My parameters are…
Account Size: $25,000 CAD
Trade Size: 10% NAV
TP: 1% Balance
SL: 1% Balance

I thought about using a 5% trade size (which I actually did with USDJPY) but the SL & TP’s were too far apart and could potentially take weeks to reach either end.

I’m using a Stop Loss instead of a Trailing Stop to give the trade more room to ride those waves. TS’s can limit losses but will also narrow the distance between the SL and TP, making it more likely to stop you out in the red during a dip or spike in price, unless of course you set it after you’re showing a profit. I have a love/hate relationship with stops, which I’m sure most of us can relate to.

I’ll be working off daily charts mostly. Weekly and monthly for overall direction, 4 hour for entry.

I’ve entered 3 trades since yesterday, (I hope these pics show up clear):

Jun 24/19 USDJPY: Long 16,951 units: 106.909. TP: 108.102. SL: 105.722


After over 24 hours this has gone 56 pips in the right direction ($118.08 profit) so far, and is 62 pips away from my TP, 176 pips from my SL. There’s still a good distance to go there. I’ll also add that another popular source has been showing a 96% sell signal ever since I entered it yesterday. Needless to say I was hesitant, but went for it anyways.

Jun 25/19 EURAUD: Short 27,847 units: 1.63285. TP: 1.62303. SL: 1.64243


I entered this one earlier today, so far so good, 23 pips in the right direction ($60.33 profit). 74 from TP, 120 from SL.

Jun 25/19 CADCHF: Long 83,405 units: 0.73984. TP: 0.74204. SL: 0.73764.


Another trade showing an 88% sell signal. I entered this trade shortly after the previous one. So far it’s up 7.1 pips ($73.19 profit). 15 from TP, 28 from SL.

I will update again, but it’s late now and way past my bedtime. Any feedback or constructive criticism is welcome.

Good Night from Canada.

5 Likes

If I might ask - you mention a 96% sell signal and an 88% sell signal. How do you evaluate signals so precisely, what criteria are you applying?

Tommor, that’s not my evaluation, that’s based on Barchart’s Tecnical Opinion. They have a lot of very good info there, but always do your own work to verify.

My CADCHF position hit my TP overnight for a profit of $251.28. I might open another position today but I need to look at it carefully first. My 2 other trades have also increased, at quick glance they’re both at $144.00, so looking good.

I’m at work and have meetings all morning, but will update more later on when I get time.

1 Like

sound like an advertisement for barchart

1 Like

He literally says do your own work to verify - how is that an advertisement?

1 Like

I was simply answering a question with as much info as I could, to be helpful. The fact that their Technical Opinion could not have been more wrong is not really a plug, lol.

I’m more than happy to share any websites or info that I might find will help you or I become a better trader, as long as It’s not violating any forum rules.

it was just a pov
there are zillion of sites that give forecasts
and most of them would be glad and willing to pay money to be mentioned in this forum

1 Like

Next I’m looking at AUDUSD. It’s been forming a falling wedge for some time now, however I don’t believe the pattern is complete yet. It seems to be having trouble breaking through the 38.2 Fib level, so I have put a short entry order in at 0.69700 as I expect some more downside to this one before it makes its big move up. If I’m wrong, which I could be judging by tomorrow’s (Forex Economic Calendar) then it could keep moving up to the 50.0 Fib level and even beyond.

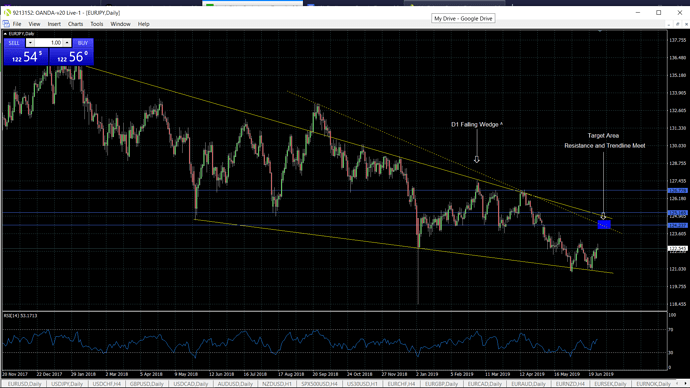
I had to jump on this one. EURJPY long term falling wedge. Looks purdy don’t it?

Jun 26/19 EURJPY: Long 24442 units: 122.600. TP: 123.44. SL: 121.76.

He’s probably advertising self-reliance and hard work. Sounds fishy to me! :rofl::rofl:

Perhaps we should flag, ban, bring in some sock puppet dictators and notify management of regime change!

2 Likes

This one could be a stretch, channel down on the 4hr chart. As long as it gets past that 1.4917 support level then I think we’re good down to the 1.484 area.

Jun 26/19 EURCAD: Short 57075 units: 1.49151. TP: 1.48711. SL: 1.49591.

That sounds like an upgrade to me, lol.

Here’s an update on the 6 trades I’ve opened…the account’s looking pretty good so far, it’s up from $25,000 to $25,746.39 over 3 days (not including active trades). 3 trades hit their TP and 3 are still running.

Jun 24/19 USDJPY: Long 16,951 units @ 106.909. TP: 108.102. SL: 105.722


This hit my TP @ 108.102 for a $245.54 profit.

Jun 25/19 EURAUD: Short 27,847 units @ 1.63285. TP: 1.62303. SL: 1.64243


This hit my TP @ 1.62302 for a $251.84 profit.

Jun 25/19 CADCHF: Long 83,405 units: 0.73984. TP: 0.74204. SL: 0.73764.


This hit my TP @ 0.74206 for a $249.45 profit.

Jun 26/19 EURJPY: Long 24442 units @ 122.600. TP: 123.44. SL: 121.76.


Currently negative -6.7 Pips, or -$16.65.

Jun 26/19 EURCAD: Short 57075 units @ 1.49151. TP: 1.48711. SL: 1.49591.


Currently up for 11.7 Pips, or $58.79.

Jun 27/19 AUDUSD: Short 60,485 units @ 1.49151. TP: 0.6969. SL: 0.7031.


Currently up for 6.1 Pips, or $48.41.

You are on another level. Interesting read and eye opener.

Good Luck and more profits to you!

1 Like

i see that this site has quite a few supporters in this forum
poor fellas they are out here trying to make ends meat in this forum

Just to be clear, this is a practice account not a live account. I would not take risks like this on a live account without doing a test run first, such as this one. I would normally be putting in TS’s and closing trades much sooner. However, looking at these results so far I will consider this approach in the future.

I actually opened a similar practice account specifically to test their opinions using the same 1% TP and TS. If they recommended any pair 88% or higher I bought it, no questions asked, no research or extra work done whatsoever. It did not turn out very well at all, horribly in fact, lol. This is why it’s sooooo important to learn for yourself through trial and error, and not just follow or copy someone else.

sorry for the misunderstanding
this thread is not advertising Barchart site
keep up the good work man

1 Like

I’m watching NZDUSD closely over the next couple of days. Price just passed through 2 resistant levels (yellow and blue lines) I had marked out. So, anticipating a reversal, I put an entry order in for a short at 0.66680. If it continues north then I expect it to bounce off the next main resistance trend line (yellow), around .6770, but I don’t think it has the steam, not without taking a breather first. Either way, I’m gonna catch that sucker on the way back down.

P.S. Ignore the dotted trend lines I mapped out previously. When the pattern runs its course I like to keep them there as sort of a journal to look back on to see what I could have done differently.

@MattyMoney,

Do you have a target TP for the short?

KC