
1 Like
TRIGGER- Behaviour
Once price takes out a Key structure high or low(KSH/KSL), we have a TRIGGER. Next will be to observe the price behaviour at trigger point.
What is price doing at the KSH/KSL, Is it giving a
- True B/O, or
- False B/O, or
- A Failed B/O
I personally do not trade ranges as ranges.---- I look for triggers around them on lower time frames. As such, it still boils down to 1 of the 3 listed above.
True Break-out
This is when price closes above a KSH or below a KSL and does not go back.

In the chart above, price closed below the Previous Year Low (PYL) and has not closed back above the PYL. This is a true B/O
The distance between the PYL and PYH is the trading range (TR) for the year. So, we can say the TR has been extended.
When price gives a True B/O, what I’ll be looking for is a True Break-out Reversal (TBR) Set-up. Here I make use of the Demand and supply levels.
More explanation will come on this in subsequent posts on SET_UP.
1 Like

False Break-out
Here, price closed below the KSL or above the KSH,( outside the TR), then comes back and close into the TR.
Example above is a bearish False Breakout.
In this scenario, I’ll be looking for a False Breakout Reversal (FBR) set-up, then later into the move, I’ll be looking for False Breakout Trend (FBT) set-up.
These will be explained in details later on.
1 Like

Hello.
Where will be the SL and TP?

Another Brief Summary of the whole process
My approach to the market has been basically the same for over a decade now and it still works perfectly well…though with a little tweaking here and there to make it more effective…however, the basics remain the same.

Look at the big picture using the Higher Time frame…I call this Main time frame, and I employ the weekly or the daily or the 4hr never below the 4hr.
If I don’t see any a trigger on any of these 3 time frames, I move to another instrument.
After the trigger, I want to see how price behaves around the Key Structure Highs and Lows
Is it a True breakout, false or failed b/o?
This will determine the type of set up I’ll be looking for.
Next is the cycle…This tells me the phase the market is presently at.
If market will change its direction, it won’t just go straight down or straight up…
It may intend going into a bearish trend, but there’ll be times it will be bullish, and you don’t want to be caught in such retracement.
This back and forth is mostly in 3 legs (not the normal SB’s 3 pushes stuff)
I label them X-D
XA, AB, BC, CD…just for identification purposes.
This behavioural pattern happens over and over and over again in anything chart.
Next is the entry…This is as essential as all other aspects of my approach. Here I employ all sorts of tactics I’ve learnt over the years.
Trade Management and exit is the final lap of the approach and it’s also not less important than others…especially so for swing trading to be successful.
This is a brief summary of what I do.
Detailed explanation are being posted.
Next discussion will be on THE CYCLE
3 Likes
MY SWING CYCLE
If you are familiar with the ‘M’ and ‘W’ patterns, then this will not be strange to you, but you’ll be adding more to what you know.
When price breaks a KSH/KSL,(that is, The trigger), we have our ‘XA’. This starts from the origin of the
move that broke the KSH/KSL. XA will always either be a True Break-out or a Failed Break-out. XA can never be a False Break-out nor a Range

1 Like

XA…Failed Break-out
1 Like


First confirmation given
Whatever entry I take here is not considered the safest 90/10 entry yet…except of course you are day trading…
For swing trading, you need to move into the the market when it’s of the highest probability (in your favour) that price is ready to move/trend.
1 Like
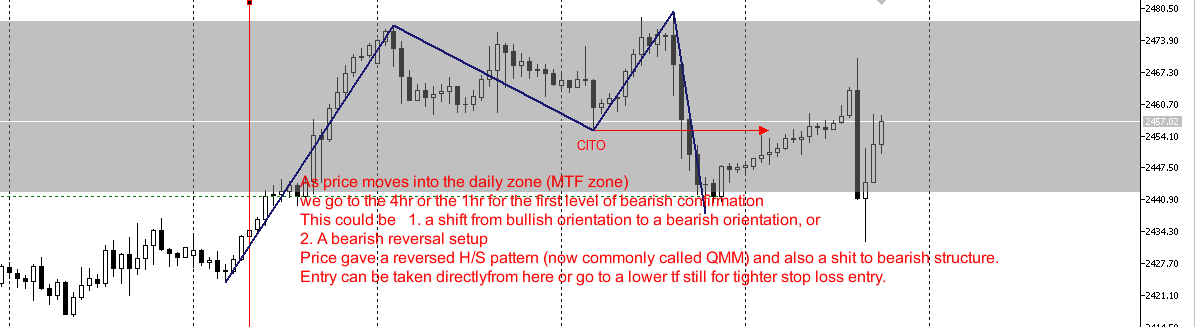
Step 3 :

Step 3 : Change Of Character
Here, I need to see price change from a Bullish Orientation to a bearish orientation by taking out cito (Change in Trend Orientation ) point, then move a bit further down, then retrace and give an entry.
2 Likes
Patiently waiting for your updates! Thank you for taking the time to make this post.
After a long break…am back posting here…
1 Like
Gold…Daily tf

1hr tf
15m Entry

The catch here is recognising the right big players zone. Once you get that that, then you can follow big quick moves
1 Like
Welcome
New week, New Opportunities
I pray God will favour our trades in Jesus name (Amen!!!).
1 Like
How about the people holding the other sides of our trades? Do God and Jesus need to look after them, too? Is there a potential conflict of interest there?
1 Like
Starting with Gold
The main trend is still Bullish, so, safe trades to take for now will be bullish trades.
My main Swing Strategy that I actually call Vipreta is yet to take a loss in 3 months…This (vipreta) takes trade that are in line with the main trend direction…using the Monthly to 4hr as the main time frame to determine daily bias.
However, looking at the daily as the main time frame, we have a possibility of a retracement

Price took out a Key structure High (KSH)…known in some circles as ‘Stop Hunt’.
Ideally, when price takes out a key structure high or low, it is expected to come into the next PRZ after the KSH/KSL, then retrace…
In this case we dont have data above the present KSH …hence no prz to look at…this is one of the reason why the risk on this is on the high side.

4hr is also bullish…Presently, price is consolidating at the top…this further fuels the possibility of a retracement…the risk of a bearish move is now 50/50

on the 5m tf ( I use this tf for snipper entries only)…
Here price gave a bearish reversal and H/S pattern (now commonly known as Quassimodo Reversal Pattern)…
Based on expected price behaviour at KSH and the reversal pattern on lower tf, the risk is now lesser on the bearish side… this gives an 80/20 risk in favour of a bearish move.
took my entry based on this…
1 Like