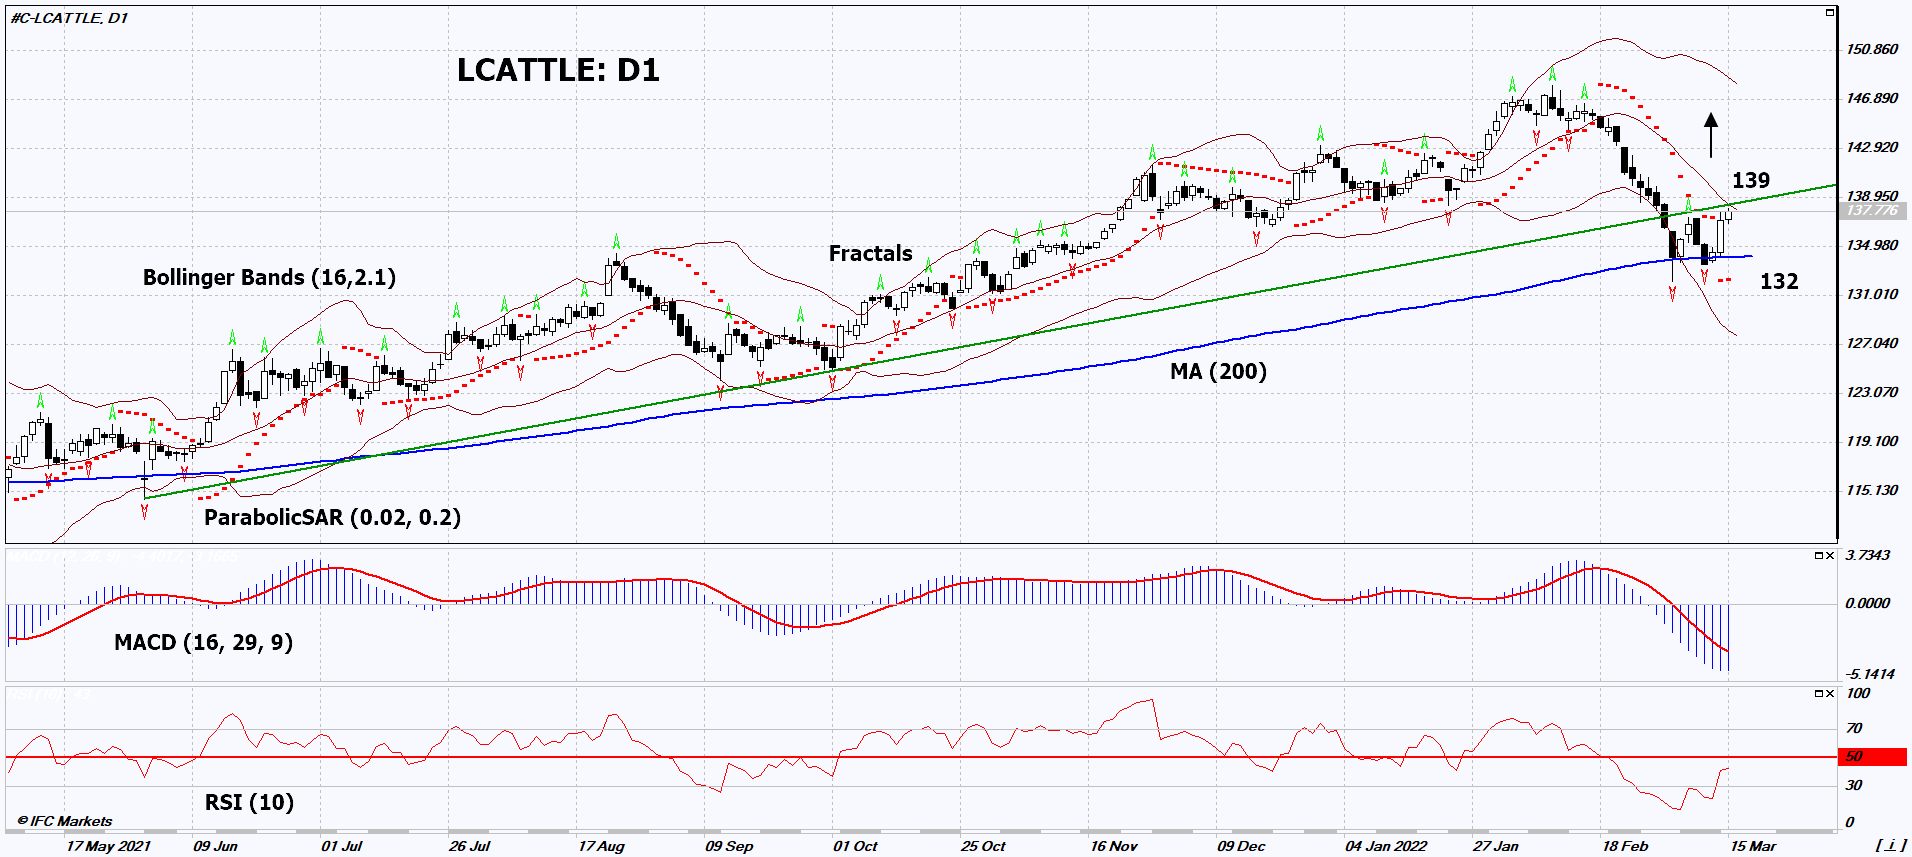
Live Cattle Technical Analysis Summary
Buy Stop։ Above 139
Stop Loss: Below 132
| RSI | Neutral |
|---|---|
| MACD | Sell |
| MA(200) | Neutral |
| Fractals | Buy |
| Parabolic SAR | Buy |
| Bollinger Bands | Neutral |
Live Cattle Chart Analysis
Live Cattle Technical Analysis
On the daily timeframe, LCATTLE: D1 failed to break down the support line in the form of a 200-day moving average and is trying to get back into a long-term uptrend. A number of indicators of technical analysis formed signals for further growth. We do not rule out a bullish movement if LCATTLE rises above its latest high and returns to the long-term uptrend at 139. This level can be used as an entry point. The initial risk limit is possible below the 200-day moving average line, the Parabolic signal and the last two lower fractals: 132. After opening a pending order, we move the stop following the Bollinger and Parabolic signals to the next fractal low. Thus, we change the potential profit/loss ratio in our favor. The most cautious traders after making a trade can switch to a four-hour chart and set a stop loss, moving it in the direction of movement. If the price overcomes the stop level (132) without activating the order (139), it is recommended to delete the order: there are internal changes in the market that were not taken into account.
Fundamental Analysis of Commodities - Live Cattle
The slaughter of cattle has increased in the USA. Will the LCATTLE quotes continue to rise?
According to the United States Department of Agriculture (USDA), cattle slaughter on March 14 this year amounted to 125 thousand heads. This is 17,000 more than the same date in 2021. An increase in slaughter in the US is observed for the 2nd consecutive week. An additional positive factor for beef could be the shutdown of the JBS Brazil meat processing plant due to the Covid-19 outbreak. In addition, the USDA previously reported a reduction in the number of cows and calves in the United States and Canada by 2% y/y to 103 million years on January 1, 2022.
