Glad to see your trade worked out. I was was following that one and rooting for you.
GBP/USD broke to the upside over night (EST). In positive pips now.
Approaching some supply just above the purple horizontal line.
Closed 2 GBP/USD longs. Had good I.D. on the Demand zone. Still entered a bit early and didn’t add to my position once it bottomed out. Lot’s to learn, lot’s to earn…
Have to stick to my 1 scout out and observe and set stop/limit orders deeper in supply/demand territory.
KC
that could also be a fib where it s at right now, just watch out, carefull cos the dollar in my book is still pretty strong. not saying it won t continue, cos i dunno, but caution.
cheers
edit :just looked at GU and yeah, all depends if it s gonna move up slowly or next 2 4hr candles close back below the fib and even 1.29.
Currently price is resting just above a trendline break and just below fib, with 3 penetrations into supply zone, on the 4 hr.
yep, haven t checked the volume on that green wide spread bar yet, but if its very high, that s weakness judging by the result… which is a doji and now a red bar. looks like the begining of distribution to me, ofc yet to confirm but caution if u wanna buy
.02 limit order triggered over night.
Chewing through orders at this level. Who will out last the other? Supply or Demand? 


 Could hit some running room around the 61.8 fib? Maybe… or could fall back to the 1.29700 zone… Mmm
Patience, sitting tight. Holding the course.
Hey Frandlost,
Like I said I have been following your trades, and I’m trying to learn from your thread. Could you take a minute and explain to me why you are long in GBP/USD. I guess I’m just not understanding your methods. I am looking at this and seeing a shorting opportunity down to the 1.286 area.
I’m terrible at support and resistance, so i’d appreciate it if you could help me understand what’s going on with GBP/USD from your perspective. Thanks man.
P.S. I don’t trade GBP/USD, i’m only looking at it because I am following your posts.
The pair put in a M low 7 candles ago. The past 2 are a pull back?
The Long green candle on the M had a lot of activity broke through a trend line and has remained above that trendline.
Looked bullish to me on the W. Drew boxes in the support/resistance areas. had some fib confluence and went long.
I am no pro trader. I usually have a paper bag over my head! This is what I saw but other traders may have seen a short. Earlier in the thread I said all indicators said short but I went long. Perhaps that’s a sure sign of a beginner.
I am still trying to reconcile my entries and exits. I feel as though my id’ing s/r has improved.
Let me know if this makes things any less foggy.
I’m a flounder. I have 2 eyes on the same side of my face! 

KC
edit: Closed both positions for the weekend.
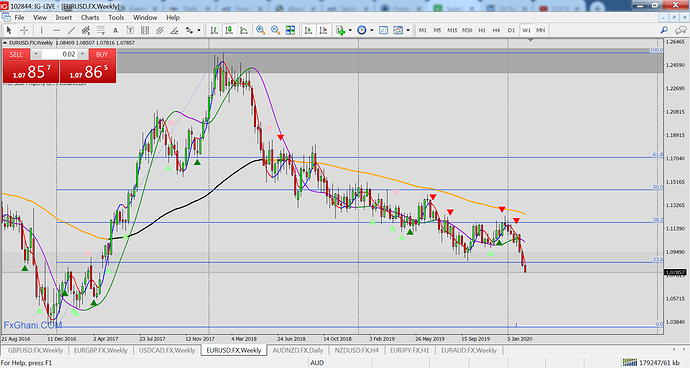
Watching EUR/USD… here’s the weekly into a support zone. Looking for a long. Waiting, Watching, it’s 9 o’clock and …
Thanks frandlost, your explanation was helpful. I assumed you were using 4H and Daily charts only (I have no idea why I did that) and once I looked at the monthly and weekly charts everything made sense.
Good luck on EUR/USD
Glad that helped. Again, I am no pro by a long stretch… learning like everyone else.
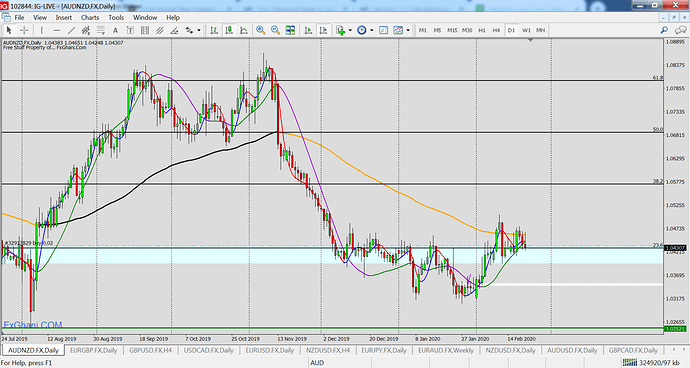
Buy limits were triggered on the EUR/GBP & AUD/NZD
While price is still below the 50 which is bearish, shorter term and S/D have me looking long with a possible TP approaching the 50.
FWIW there’s fib confluence on the A/N pair and the prior candles have been grinding through sell orders as seen from the wicks with support from below based on the price.
Again, I am no pro and this is my limited interpretation of the charts… 

Here’s an interesting exercise that I often do and have found it to be illuminating. In this case I placed a rectangle on the most recent A/N pair’s candles from 2/5/20 - 2/21/20 as this appeared to be a demand/support area based on PA.
Then I opened the dialog box for the rectangle and adjusted the parameter dates changing the years to 2002 and 2021. Then zoomed out to see how price reacted at this level over the years. I am sure some folks will put this in the “indicator” category, old info that is not very helpful but for me, I have found it useful in setting limit/stop orders. YMMV!
another aud/nzd stop order triggered
Aud/nzd and eur/gbp seem to have some support as they grind through supply.
Closed EUR/GBP in the green.
Will post chart tomorrow.
KC
EDIT:
Here are the charts. The blue line is my trade. I had a good entry using limit orders. What I notice is I got out way too early for fear of losing gains. Will be monitoring and looking to enter on a pull back. Still have to improve my stoicism.
I also noticed in relation to where I exited I could have had an earlier TP and entered again lower. @Lang15 discusses this in a video he posted in a recent thread about “banking money” every 50 pips.
AUD/NZD is still on in the red.
AUD/NZD in the green was at $14 last night bumpinig up against a fib. and should have taken my “50”, retraced.
Here’s the 4H
I don’t know if this has already been mentioned but how much did you start with for this live account?
Started with 300 US


