Lockheed Martin is one of the the largest defense, arms and aerospace companies based in the United States and the world. It employs approximately 110’000 people worldwide. The company operates mainly on four business segments, i.e., Aeronautics, Missiles & Fire control, Rotary & Mission system and Space systems. It’s the world’s largest defense contractor based on revenues in the fiscal year of 2014. Headquartered in Bethesda, Maryland, USA, Lockheed Martin is a part of S&P100 and S&P500 indices. One can trade it under the ticker $LMT at NYSE.
Back in March 2019, we have presented the impulsive structure of $LMT. Our anticipation was an extension towards 391-437 area. Then, a pullback in wave ((IV)) before higher again. We were right. Later, in November 2021, we expected the pullback to find support from 299-266 area. It has ended with truncation and $LMT broke to new all-time highs. Now, we present an updated view, discuss wave structure and next buying opportunities…
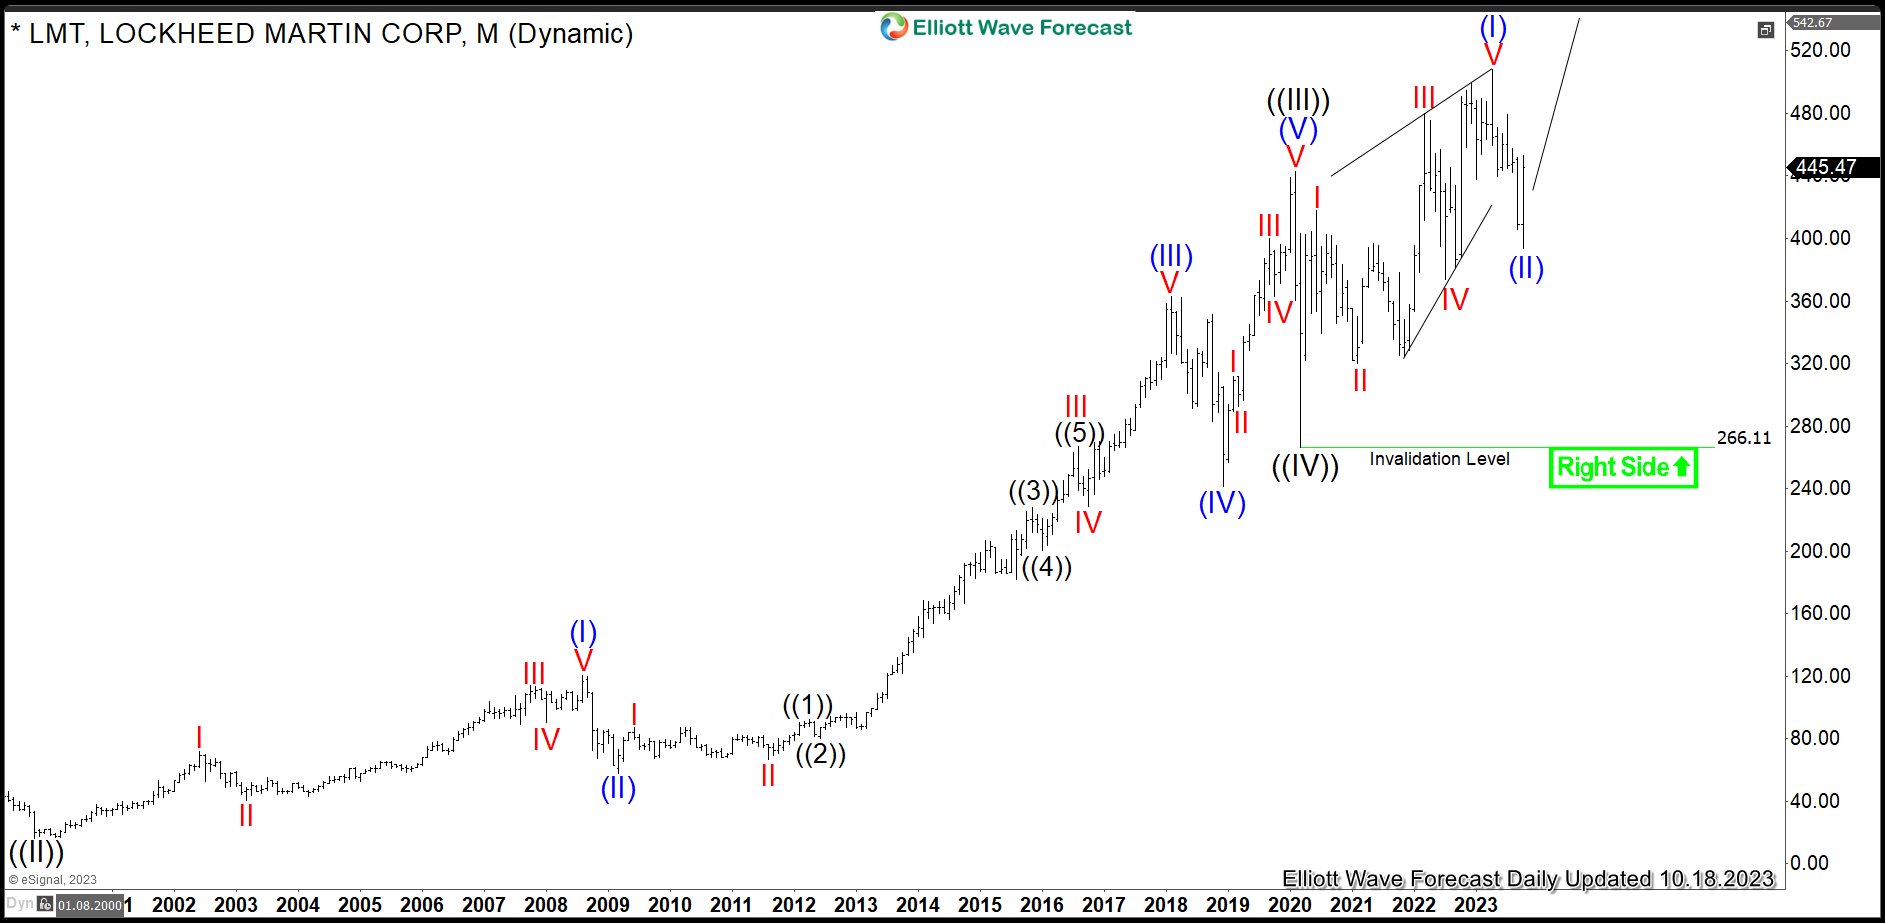
Lockheed Martin Monthly Elliott Wave Analysis 10.18.2023
The monthly chart below shows the Lockheed Martin stock $LMT traded at NYSE. From the all-time lows, the stock price has developed cycles higher in black waves ((I))-((II)-((III)) of grand super cycle degree towards the peak on February 2020 at 442.53. Hereby, the wave ((III)) shows an extension beyond 2.618 as related to the wave ((I)) (not shown). Moreover, wave ((III)) shows an extended subwave (III) on its own. From the February 2020 highs, a correction lower in black wave ((IV)) has found its bottom in March 2020 at 266.11 low. From there, a new cycle within wave ((V)) is in progress. It has been confirmed by breaking to new all-time highs. The target for wave ((V)) will be 484-551 area. The minimum level has been reached. Therefore, one should not be too agressive. But still, there are no signs of the market’s top. Pullbacks in $LMT should remain supported.
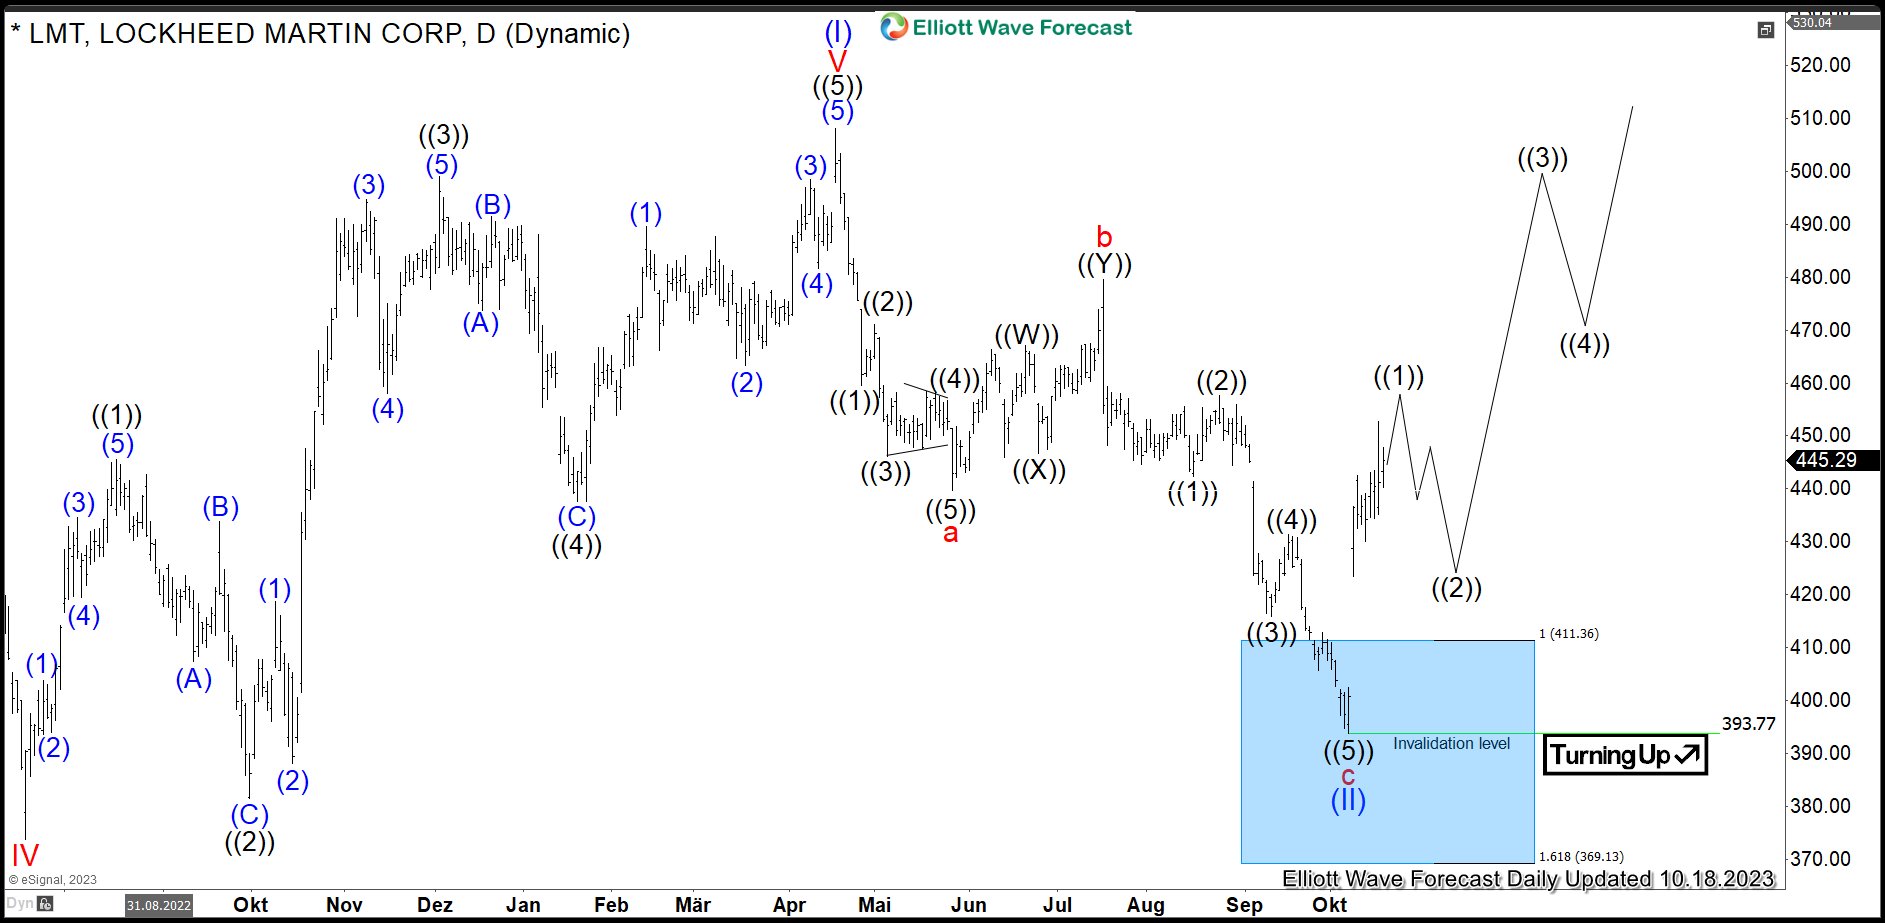
Lockheed Martin Daily Elliott Wave Analysis 10.18.2023
The daily chart below shows in more detail the final stages of the advance higher in blue wave (I) of black wave ((V)) and a pullback in blue wave (II). From March 2020 lows, blue wave (I) has unfolded as a leading diagonal being 5-3-5-3-5 structure. Within it, red wave V of blue wave (I) shows 5 waves into the top of a new all-time high on April 2023. Then, from the 508.10 highs, pullback in blue wave (II) demonstrates an Elliott wave zigzag pattern. Firstly, red wave a has printed a low in May 2023 at 439.70. Secondly, bounce in red wave b has set a connector in July 2023 at 479.50 highs. Thirdly, price has broken 439.70 lows confirming next extension lower. Now, red wave c has reached 411.36-369.13 area. From there, a bounce is taking place.
It is the preferred view that blue wave (II) has ended in October 2023. While above 393.77 lows, wave (III) is in progress. The target will be 542-583 area and possibly higher. Traders from 411.36-369.13 area should have taken partial profit already at 436.63 level and stay long. Once the all-time highs will be broken again, then pullbacks from extremes should remain supported in 3, 7 swings.