oh ok, sorry, I read the edit but it just didn’t register in my brain. Had to go read it again :o
Thank you for posting the Fibonacci Pivots MT4 indicator.

Thanks Muthusai, think am gonna stay with my demo for a while till i get pretty good with this stuff.
By the way, don’t know how to post charts.
Ade
I stay with demo till I generate net 200 pips or one month whichever is longer.
Hi Your welcome. Looks like the pairs already made big moves. My friend also was telling me about the movements that has happened much earlier in the day. I use photobucket to post charts. If you are not sure how to do that, check page 51 of Joy of Candle stick trading Part 2 thread in Newbie Island. A detailed explanation is give on posting charts. Also there used to be a thread that was dedicated to posting charts. Must be buried in heaps i guess.
Regards,
Muthu.

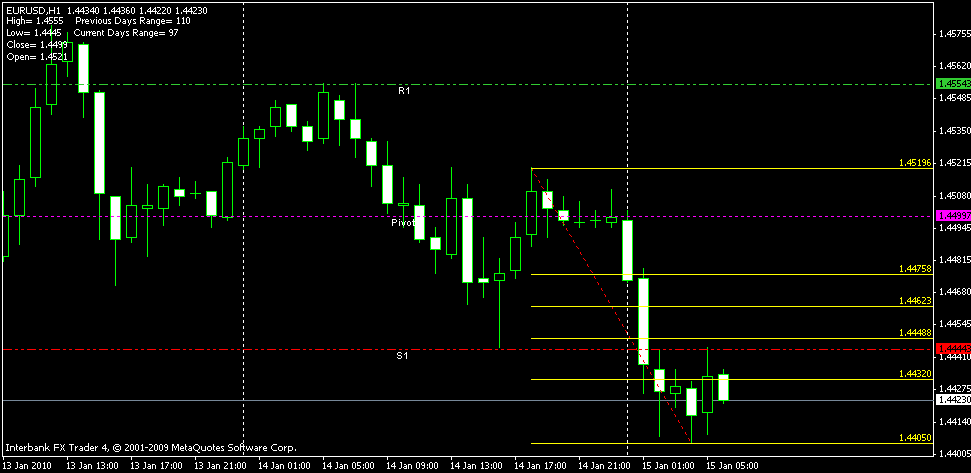
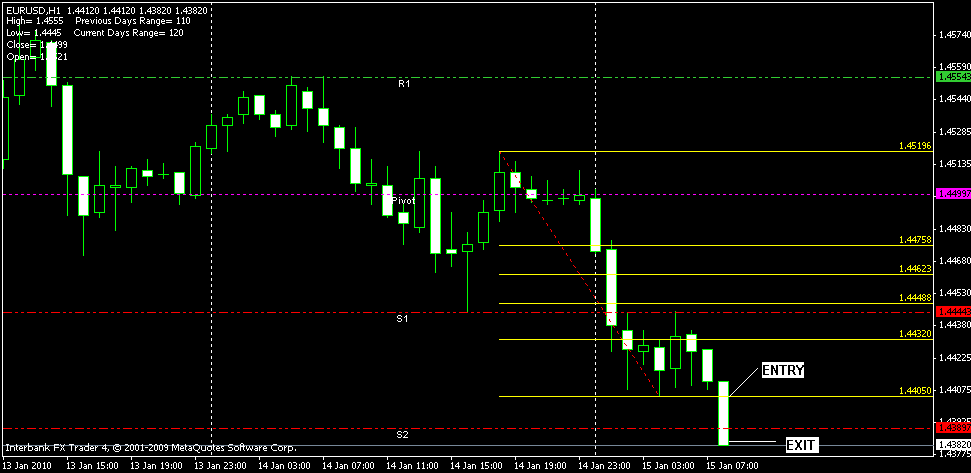
As part of the trials, I am trying to trade the break of high/low of the day. A quick trade here that broke the day’s low triggering an entry and exited at the nearest support level.
Edit: Drawing trendlines off Euro looked almost impossible today.
Regards,
Muthu.
Chennai.
India.
Lots of trades call it ABC Breakout or 123 Breakout. If you can learn to build it up from lower time frames chart it can be very rewarding.
Thank you noted your point.
Wouldn’t your stop have been above that candle anyway?
Now, how does that look on a 5min/10min chart. Does a candle close below the trendline?
Probably worth a listen for some of you guys to consider…not to change things but to get some alternative opinions: London Open Breakout Forex Strategy | Learn Forex Live
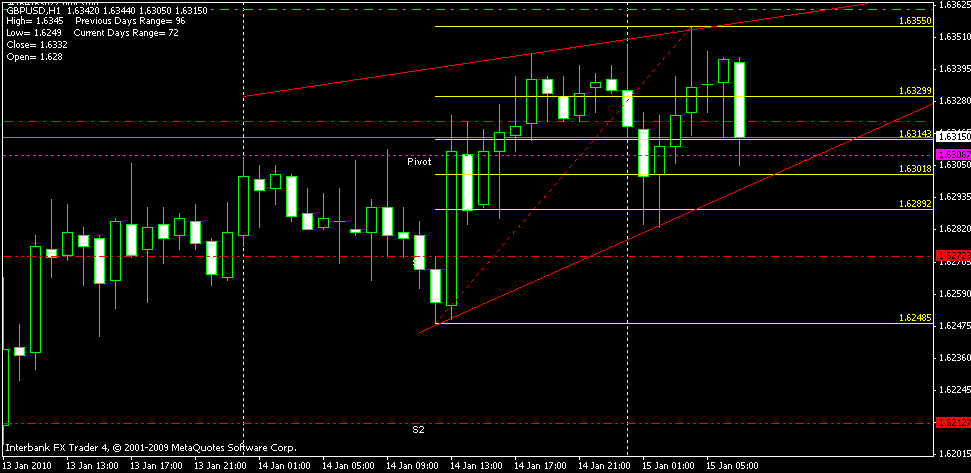
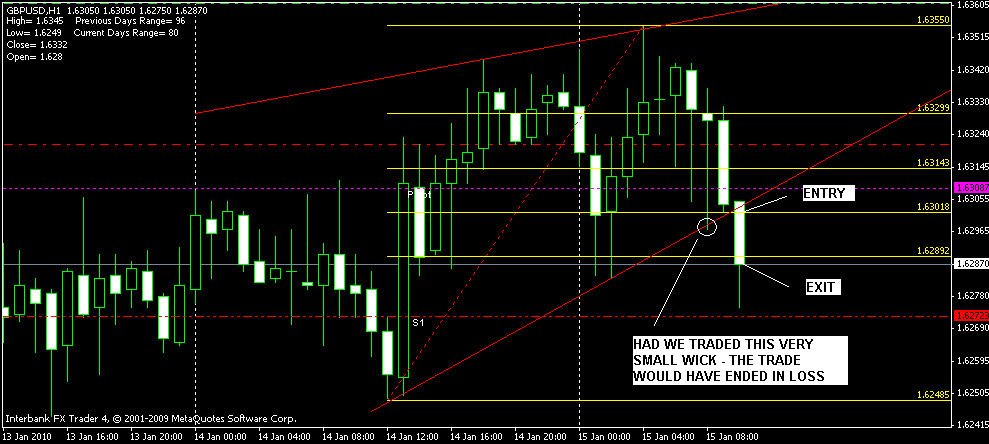
[QUOTE=TalonD;162723]you have a candle marked ‘entry’ the candle before that rose above the trend line, why did’nt you enter on that one? Even the one before that got above the trend line just a little bit, why not enter on that one?[/QUOTE]
I hope this will help.
I take only one trade per system per day with 10 pips profit.
Why…! Its a long story.
For me this trade was a sale trade.
Just wona know the latest about Carter’s strategy? Hope he’s still with us.
You are right. I meant the drawdown was really big. Zommed in to check the 5m chart. 0805 (5m) candle closed above the trend line showing a small wick that i marked.
Regards,
Muthu.
SanMiguel:
Thank you for the link. This is really worth looking at.
Muthu.
That’s how I like to trade it, wait for a 5min/10min candle close - this avoids some of the fakeouts. However, it has its own disadvantages in missing quick moves - one to back test.
Makes a lot of sense. I will definitely bear it in mind as well. Missing quick moves, well looking at 1000 5m chart that triggered the trade, it dropped almost 20 pips. Now as you have stated had we waited we lost an opportunity making pips in that move, but we could have still safe guarded against fake breakouts.
The video link makes interesting reading.
Thank you.
Muthu.


