It is an alternative way to trade it but it relies on validating the Asian session high/low as a valid SR line. You could use the same principle on the trendlines but, and I do not know the answer yet as I haven’t looked back through the charts, is how often the trendlines are tested/validated.
These are all things to be aware of in the coming trades and note down when they happen…all [B]theoretical [/B]improvements that could be made while developing experience using this method - that is the way to think about it 
Can some one confirm the Tokyo session timings in GMT Please ?
Thanks,
Muthu.
Informative again thank you. The video link looks very useful as i said and I request you to come up with such treasure troves frequently to benefit us all.
Regards,
Muthu.
I just finished watching the video. Very interesting. Reminds me of the old ‘win ratio’ london breakout thread. But an improvement on it.
1900-0400EST
0000-0900GMT
Take into account the Australian open and also summer timme changes but these are the times as currently.
Forex Market Hours

Yes, definitely, the validation of the lines and strategic look at trends and what the Asian range has been doing was part of what was missing from the Win ratio set and forget thread. It looks interesting - we should keep an eye on it…
Yep still here. Busy trying to break the system at present… got 10 currency cross counter trades running into the weekend. If that dont bust it nothing will. :D:D:D
Hi SanMiguel:
Do you use the 123 setup off 5m chart (the gentleman in the video was talking about 123 setup of 15m though) to trade or you just take the trade off the break of the high/low of tokyo ? Do you use trendlines ? I am unable to find one on this trade. Pls enlighten.
Thanks,
Muthu.
Since when does a 1h chart show 22 candles, only?
What kind of chart and what daily open are you looking at?
Don’t get too stuck on this one, I simply posted a trade with the 5min chart. Stick to the trendlines and if you want to monitor that one with 1hr/15min Tokyo breakout also then all the better to test out.
I do use trendlines and I do use the Tokyo breakout depending on what looks better to me on the day.
What are you referring to in the 1st question?
For the purposes of this method, I look at the 1hr chart and I use the lower TF charts to fine tune the entry.
Frankfurt open and/or London open.
I was not trading euro today off this method as i was doing an experimentation trade of another method with euro.
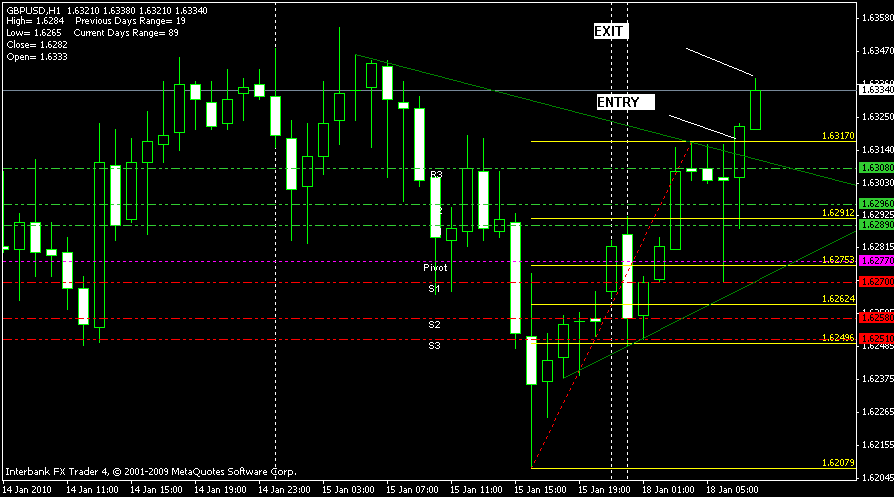
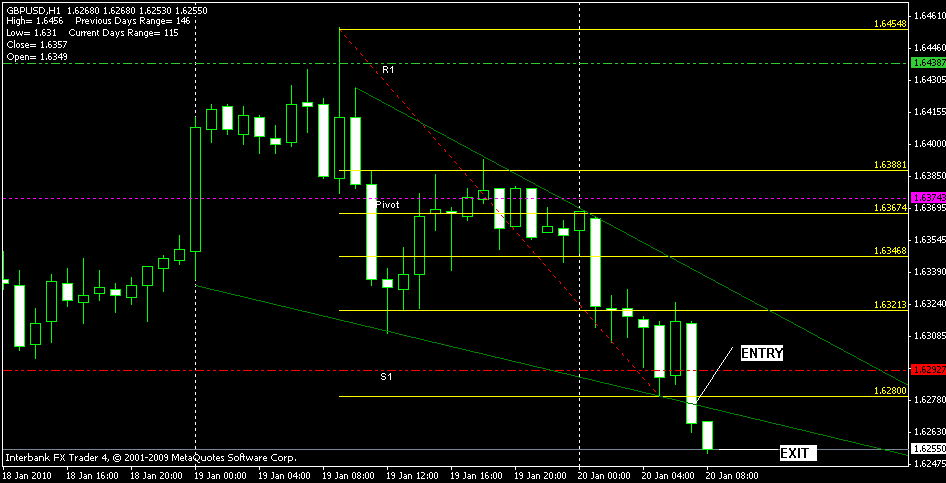
Today’s trade was not just a break of trend line entry. I took in to consideration day’s high as well as it was too close (check my upper fib level). Entry was just above the fib level. A small profit but as you can see, if the trade was taken off the previous candle which broke the trend line but still below the day’s high and the upper fib level, the trade would have ended in a loss.
Regards,
Muthu.
Chennai.
India.
Its Bank Holiday in USA so be careful for any trades
I realized it just some time back when a friend alerted me. Anyways, thank you for the headsup.
Regards,
Muthu.
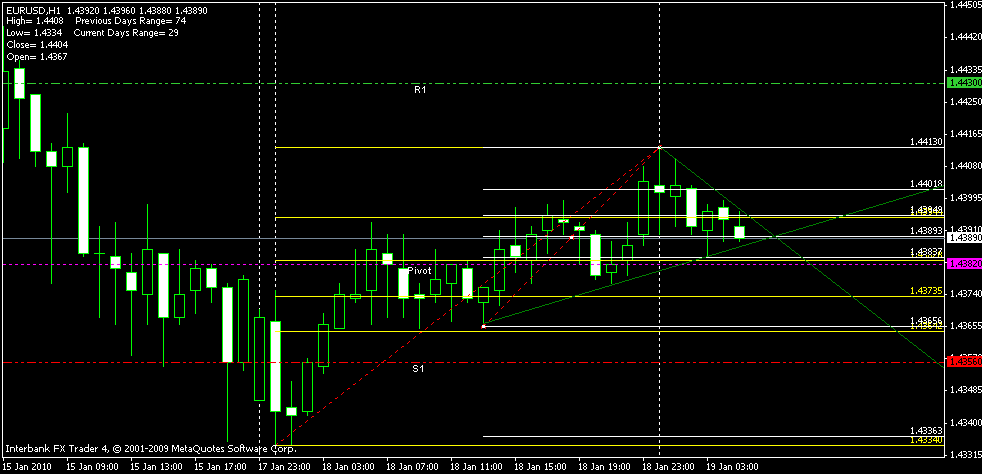
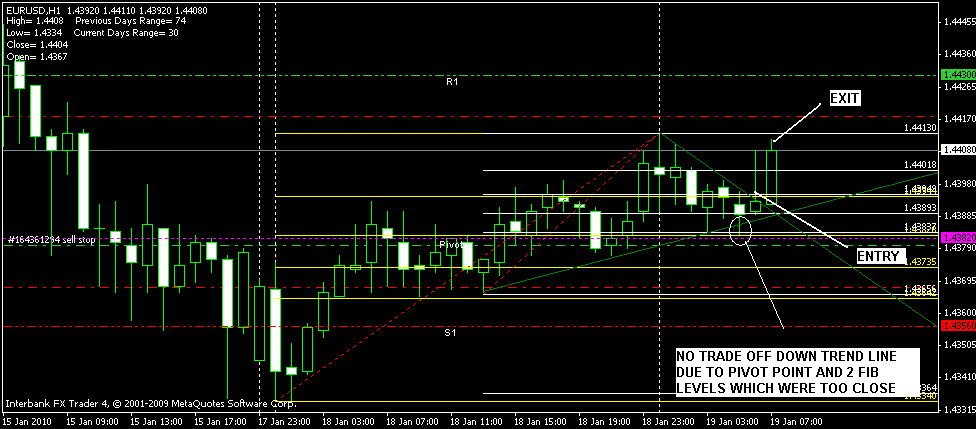
There was a brief break of the downward trendline. However, trade was not taken as i had two fib levels (double fib was used today) acting as a support and pivot point just below it. Pending order was below these levels which never got triggered (See the sell stop order a green dotted line and the order # at the left of the chart). Price bounced off these fib levels and went up. Even on the upside buy was just above the fib level close to the break of upper trendline. We are losing few pips here and there. However, trying to make a safest possible entry to avoid bounces off support/resistance.
Edit : Exit was exactly as planned, two pips below the day’s high.
Regards,
Muthu.
Chennai.
India.
Small profit.
But they say " Profit is a Profit no matter how you look at it".
Seems lika a good strat to have in your trading arsenal:cool:! Waiting for the london to turn around is a real zzznore, when (if) it happens, you are usually to unfocused to jump onboard, at least thats the case for me:o!

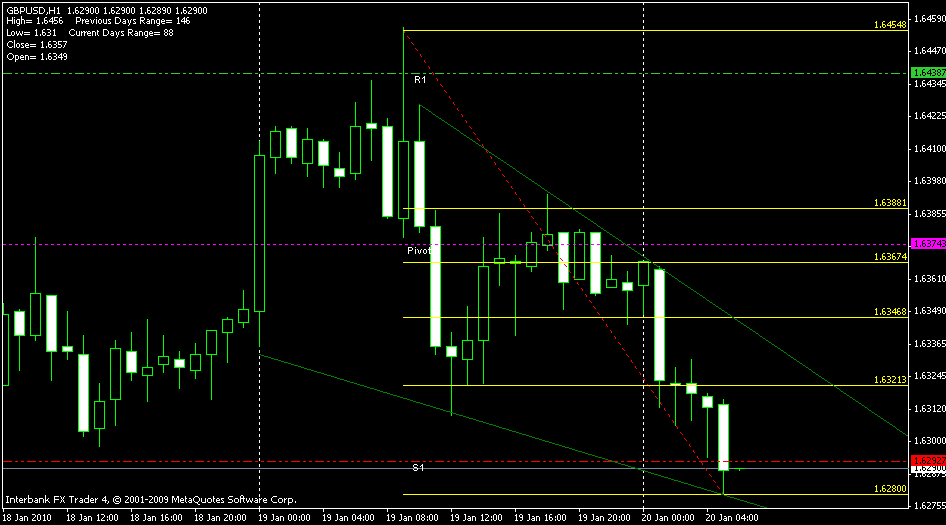
Trade was above the break of the day’s high at that time. Gave ten pips before it retraced to hit my stops. Next hour went high up to get to target area R2. Well thats how cable moves :o
Regards,
Muthu.
Chennai.
India.
on the above chart R1 is marked as R3 it is a mistake.

