London Breakout Strategy - 1H Timeframe Modified

Hello everyone,

This is not something new but rather is something I have stumbled across and made a few small changes along the way to suit my own trading style a little better.

Back-tested this and it has shown really good results over the last 6-12 months so I thought I’d share this with you all.

Once again, this is not 100% my own strategy, but rather something I found through research that has been around for a long time and just made changes to it to suit my own lifestyle and trading style.

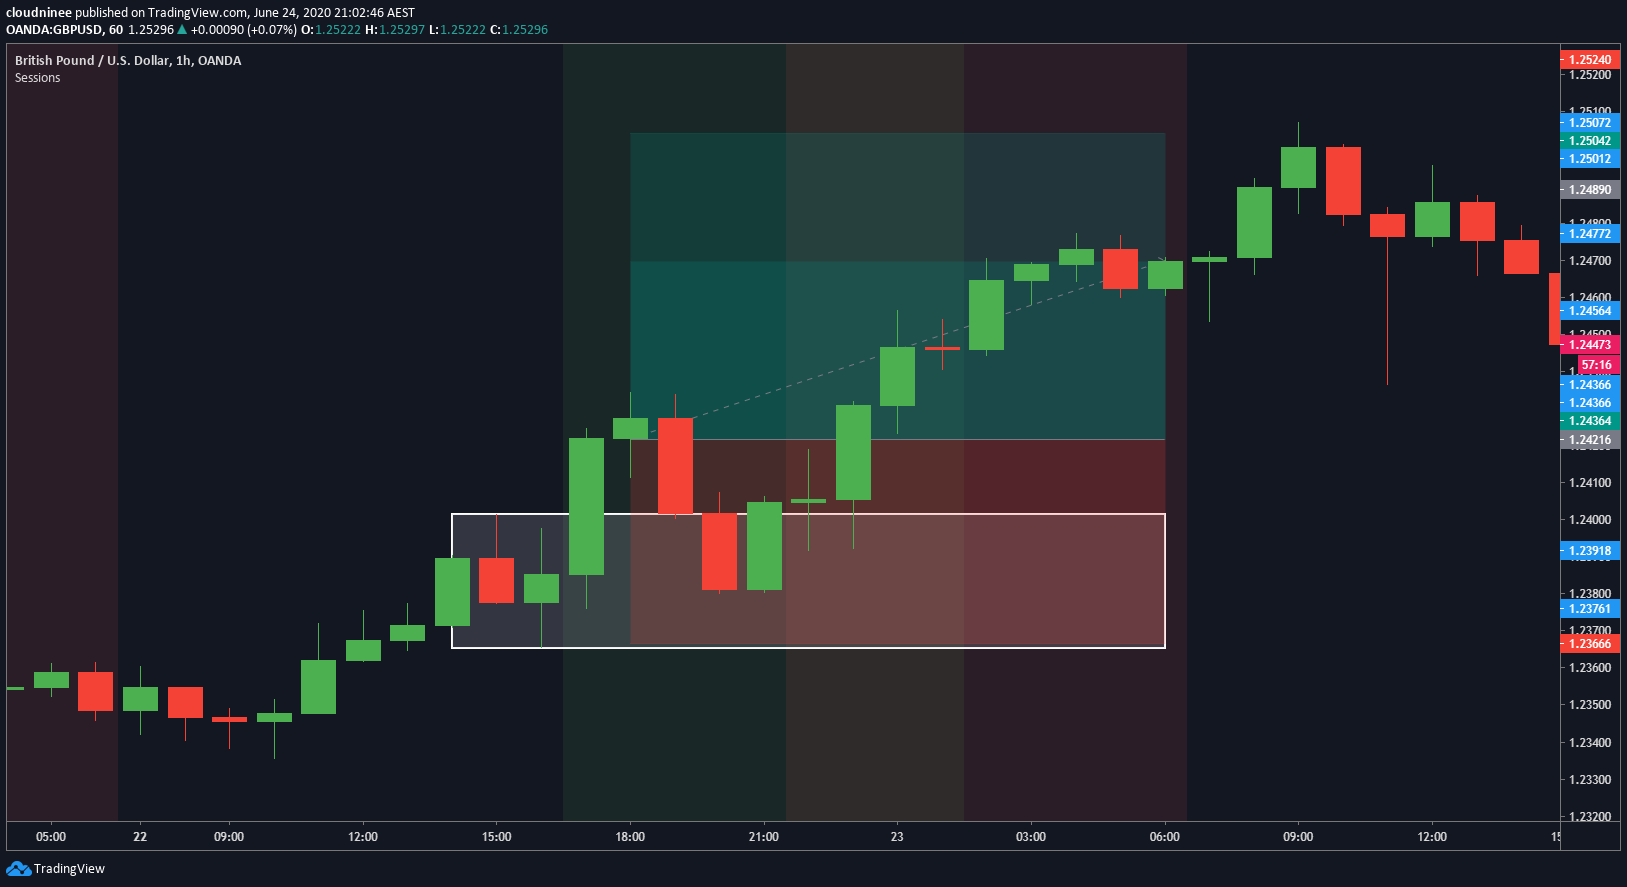
The strategy is based on the good old “London Breakout Strategy”. It’s a very nice and clean way to trade, I use no other indicators other than the “Session” indicator and draw 2 lines and/or a rectangle box to determine the ranges.

Here are the rules:

  • Candlesticks - 1H
  • Plot the high and low of the last 3 candlesticks BEFORE the London market opens (refer to examples below)
  • Once the London market has opened and the high or low of the range has been broken and the breakout candle has CLOSED, you enter a trade in that direction
  • SL is at the opposite end (if BUY then set SL at the bottom of the determined range and vice versa
  • TP is 1.5 R:R
  • Risk is 1-2% of your account per trade

Note: What I usually do if I don’t have the time to monitor is to let the trade run all the way through until just before the US market closes. If your trade has not hit SL or TP by then, close the trade regardless of whether it is in profit or loss.

I currently use 6 currency pairs for this strategy: EURGBP, EURUSD, GBPJPY, GBPUSD, USDCHF & USDJPY.

Once again, this is what I personally do, and obviously, like anything in the trading world, it does not work 100% of the time but because of the 1.5 R:R, you only need to win 50% of the time and would still make decent returns over time.

Feel free to backtest this yourself and let me know if you have any feedback or changes that could potentially make it work better?

Here is why this works for me:

  • Obviously, the backtest of results has shown to be very positive, demo traded this for about nearly 6 months and have been live trading this for about nearly 3 months now and have made nice returns weekly.
  • I live in Australia, so to be able to trade this strategy, I just need to hop on to my charts at around 4:45PM, draw my ranges and check back every hour from 5PM onwards (6PM, 7PM, 8PM etc.).
  • Once I have my breakout, I enter the trade and let it run and forget about it until the next morning, I’d wake up at about 6:45AM to check my trades and close off those that have not already hit SL or TP.

I have included below 2 recent examples on 2 different currency pairs (only a few days ago). Example 1 shows you a full trade that hit TP before the end of the day and Example 2 shows you a trade where TP was not hit but still closed before the end of the day with a profit.

Thank you for reading and wishing you all the best!

Kind Regards,
Cloud Nguyen

58 Likes

Welcome and thank you for sharing. If it’s not too much to ask, can you show us some examples with pictures? Again, i thank you

1 Like

Ooooh! :open_mouth: This looks interesting Cloud. :open_mouth: Do you have any plans of creating a demo with the results of this strategy? :open_mouth:

Avg winner
Avg loser
Max drawdown
Sharpe ratio
Risk of ruin

?

2 Likes

Sure thing, I can try to send some up to you when I finish work today.

I actually had one before but have deleted it :cry:. It can easily be tested though if you just pull up a chart and backtest it, especially on Tradingview with the “Sessions” indicator on. Maybe I will do a demo account when I have some free time :slight_smile:

Ooooh. :open_mouth: :frowning: Why did you delete it? :open_mouth: But yes please! :blush: Hope you get more free time. :blush: And maybe I could try it out too! Thanks for sharing!

Can you explain this TP is 1.5 R:R to a dummy. or better still give an example.
Thanks for sharing

Hi, 1.5 R:R means your take profit is 1.5 times the risk you are taking. For example, if your SL is 50 pips (risking 50 pips to lose your trade), then your TP would be 75 pips (50 x 1.5.).

This means that if you lose a trade and win a trade, you are still ahead and in profit.

Hope that make sense? Let me know if not and I can try to explain better.

7 Likes

I was trying to keep my account clean as at the time I had too many different demo and live accounts haha. Hope I can do the demo to show you the results.

Many thanks Cloud…you have explained it perfectly …even to a dummy like me. Best of luck with your trading

1 Like

One more dummy question. If the 8am London candle closes lower than the previous low of any one of the three one hour candles range immediately prior to 8am we sell and visa versa?

Hey Mick, it’s easy to see if you draw horizontal lines (1 for high and 1 for low) or I prefer the rectangle box tool connecting the high and low (including the wicks) of the 3 candles prior to the open of the London market. So if the market opens and it breaks the high or low and CLOSE, then place your trade in the direction of the breakout. Hope that make sense.

1 Like

Hey Mick, I have attached here some examples for you in case you are still confused :smiley:

Hi, as requested I have attached here 2 examples for you. Keeping in mind the time on the chart is MY TIME which is Brisbane, Australia. Let me know if you still have any questions :smiley:

1 Like

Thank you sincerely Cloud. Entry time is my problem. We wait till the 1hr 8am candle has closed before we enter? Im in Europe so 9am is my time to enter the market if that 8am candle is nice?

Hey Mick, it’s not just the 8am candle, it’s that and/or any candle after that that breaks the high or low of the last 3 candles BEFORE the London market opens, once we have a candle the breaks the high or low and CLOSE outside, we enter.

In recent times due to the virus, the market is very volatile hence why you will see most days as the market open it will break the range straight away. At times (if you scroll back to mid-late last year, you will see some times it takes a bit longer for it to break the range (also depends on how big the range is).

If I see the market has made some ridiculous moves during the Asian session, I also try to avoid trading the pair that day.

So my advice for you, is maybe check in at 7.50am, draw your ranges, then check back at 8.50am, if nothing, then 9.50am, and so on until you have a break of the ranges.

4 Likes

Thanks Cloud. I owe ya

You are very welcome :blush:

Do some backtests to see the results for yourself first though before jumping in. It’s quite a clean way to trade so it’s nice and easy to backtest also. It has been working really well for me even during the current market conditions.

On days that the market decides to do crazy things you just have to accept the losses, but again, due to the risk and reward per trade, you can lose 3 trades a night out of the 6 and still end up breakeven or a bit in profits.

1 Like

Here are my trades that I took yesterday (24th June 2020):

GBPJPY - LOST -$200
GBPUSD - LOST -$200
EURUSD - WIN +$300 (TP hit)
EURGBP - LOST -$200
USDJPY - WIN +$240
USDCHF - WIN +$300 (TP hit)
P&L = +$240

Overall, won 3/6 trades (50%) and still profit nicely with not much to do other than just placing the trades and let them run. USDJPY was the only trade I had to manually close in the morning as it did not hit TP or SL but still in profit. GBP was also doing some crazy swings yesterday as you can see.

Once my trades are entered and if it hits SL, I don’t look to reenter, just accept the loss for the day.

6 Likes