Southwest Airlines Corporation like every Airline took a deep during the first quarter of 2020. The stock ended a Five waves advance within the Grand Super Cycle degree. And now, it is correcting lower in an ABC structure. The idea represents the classic pattern of the Elliott wave theory, which is nothing more than five waves with the trend and three waves pullback against the main trend. As we all know that the Transportation sector has suffered due to the lack of traveling lately. But the wave structure at LUV is showing that soon traveling will start to pick up. Here is the Quarterly chart of the stock:
LUV Quarterly Elliott Wave Chart
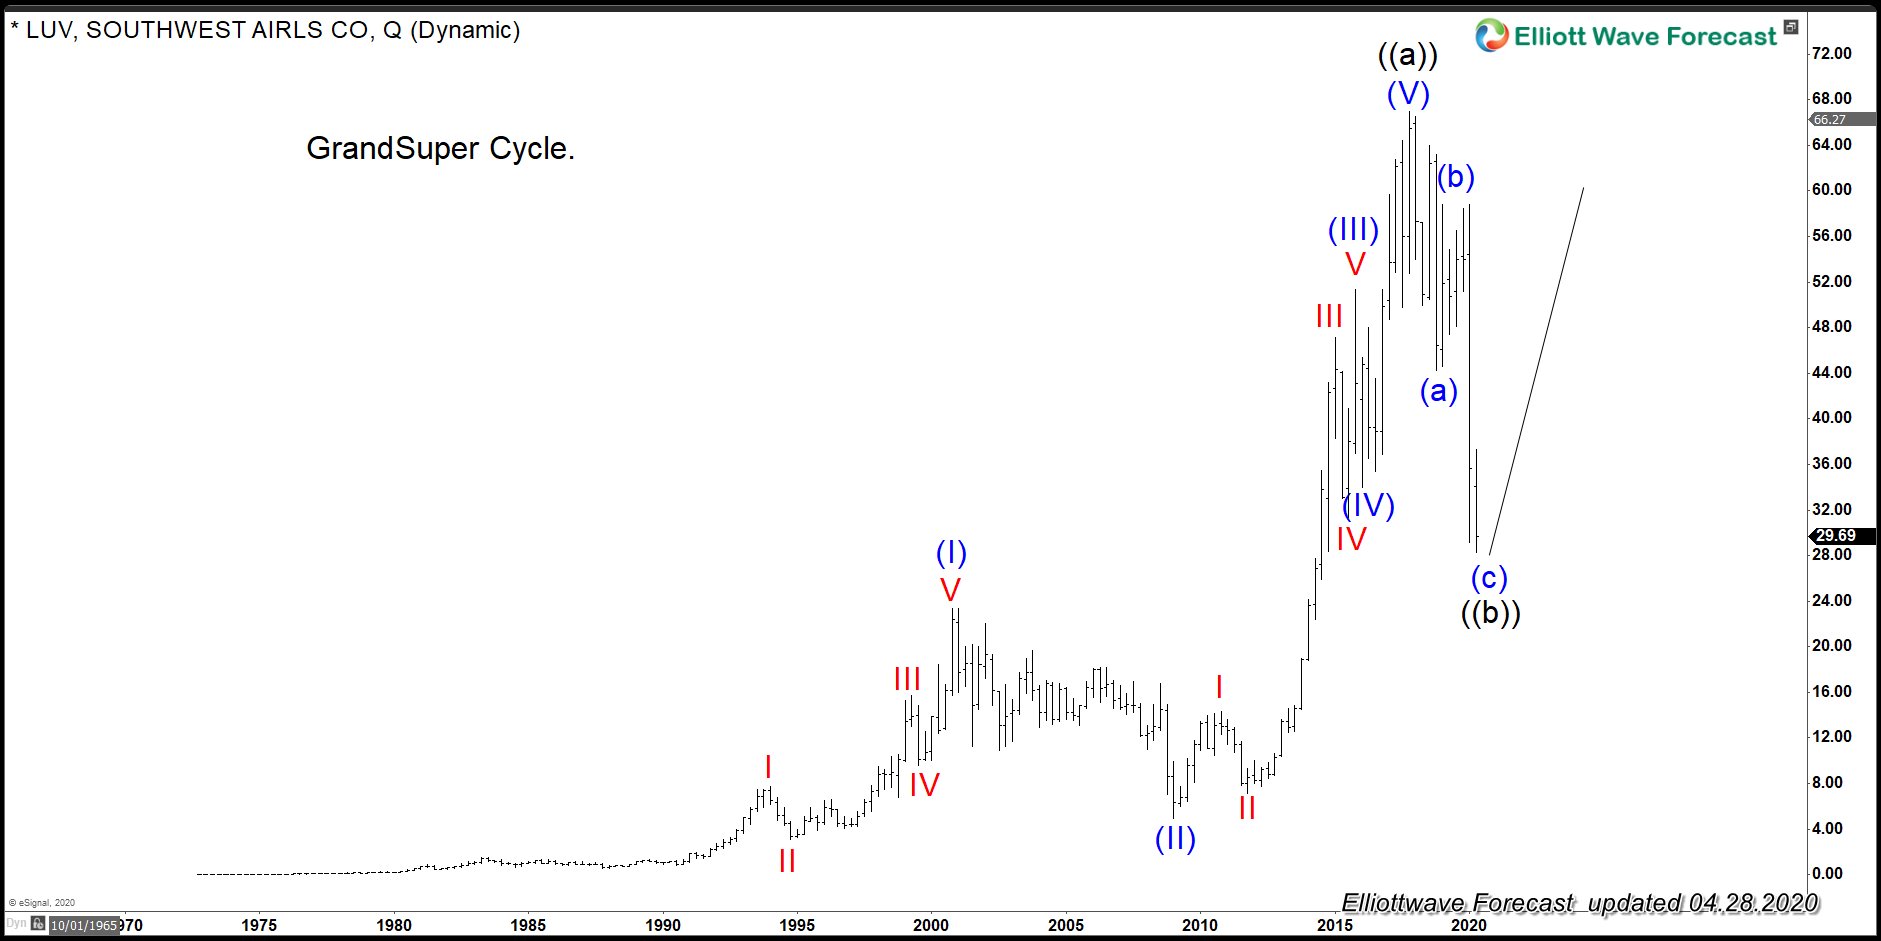
In the above chart of LUV, the stock is showing the Five waves rally and a three waves pullback is taking place. An ABC is nothing more than a two-cycle of five waves each. The impulses need to follow every single rule of the Theory. And have an impulse sequence which always is 5-9-13 area. If we take a look at the structure since the peak at 12.18.2017, at this moment, we can see how (a) Blue was a clear five waves. Then the instrument did three waves back in (b) and now we are in the process of finishing the third leg in also five waves. An ABC does not come with an extension which is the main difference with an impulse. So the ABC always ends above the 1.618%. The relationship between (a)-(b)- © is reflected in the following chart (Weekly) with the Blue Box area.
LUV Weekly Elliott Wave Chart

Blue boxes on our charts are high-frequency areas and are expected to produce 3 waves reaction at least or the renew of the higher degree trend. Many do not believe in the idea that the everyday market is more and more related to computers. Consequently, for years, we have added it to our forecast at Elliott wave forecast. We used the Boxes to enter or exit the Market knowing the Market Nature related to the Boxes. Downgrading the charts, we are reaching a very interesting stage. Because trading within the Box means a turn has an 85% chance to happen. As far as to stay above $21.76 area which is the 1.618% between (a)/(b)/© or the bottom of the Blue Box. The following chart is the Daily Time frame view of the instrument:
LUV Daily Elliott Wave Chart
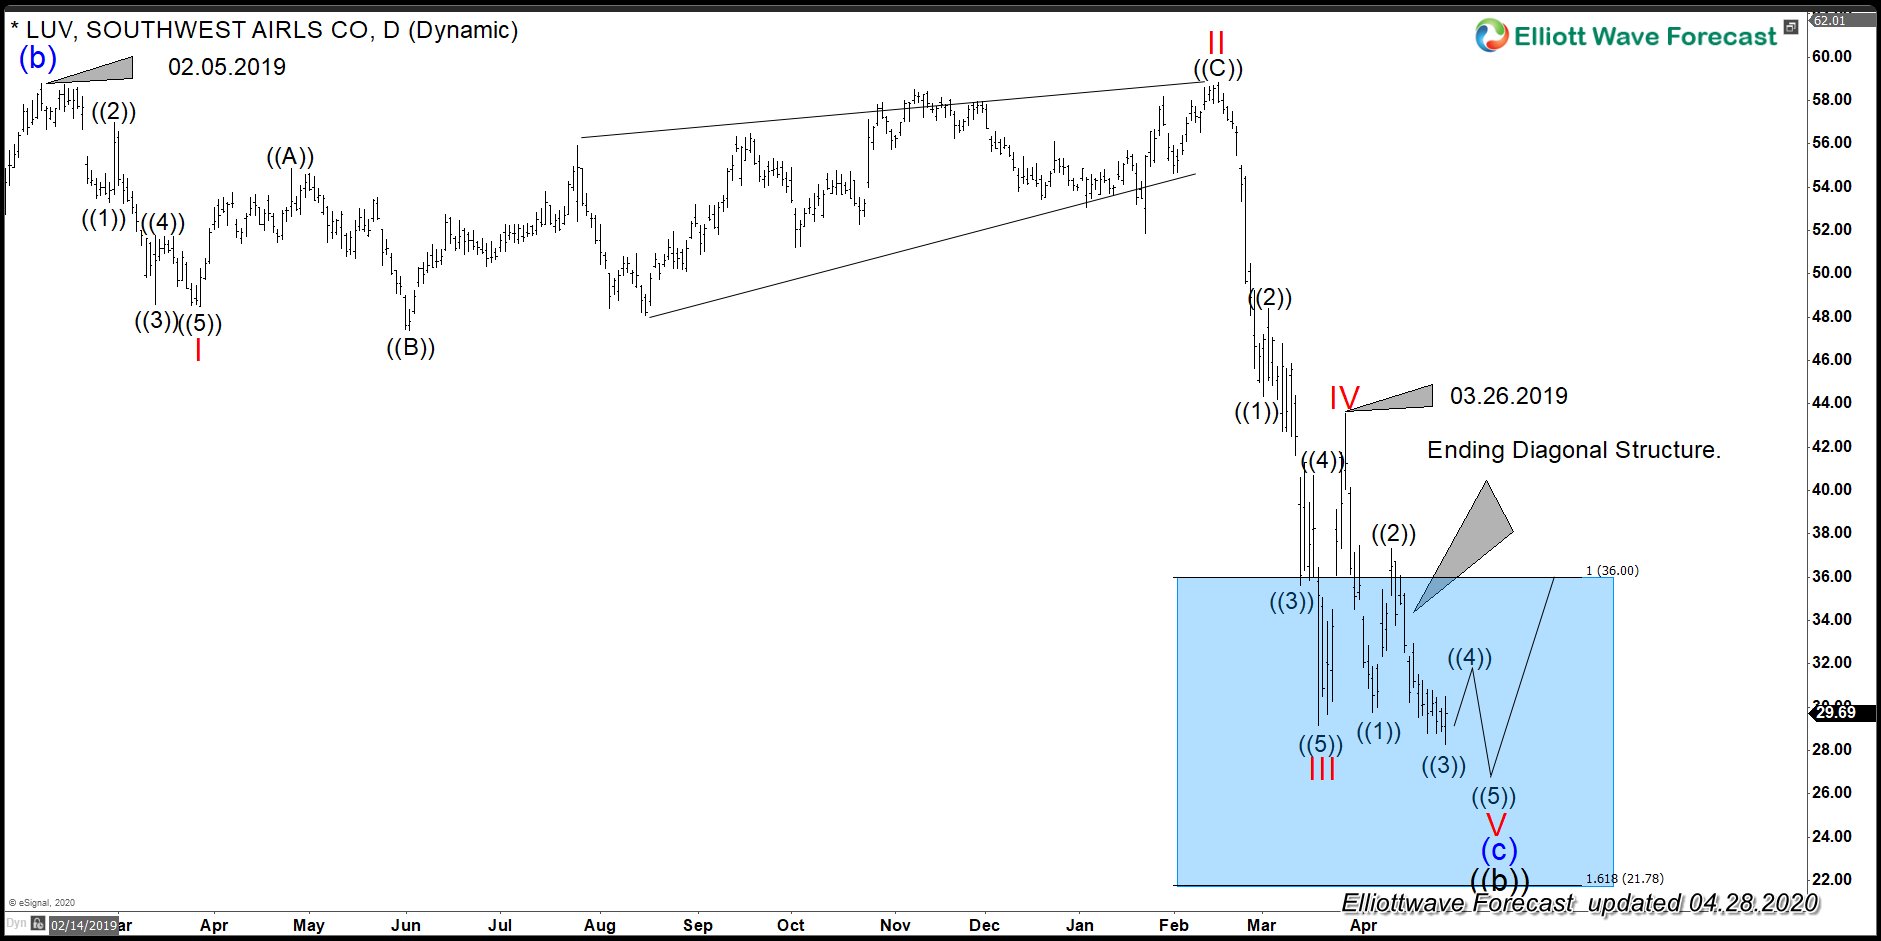
As we have said previously an ABC is two impulses in one direction. But also needs to have a corrective sequence, which should unfold in 3, 7 or 11 sequences. At this moment, we already have five waves (red) in (a)=5 +plus (b) blue 1 wave =6+five waves in red within © blue give us a grand total of 11 swings since the peak at 12.18.2017. The number of swings is there, but we need the closer which is the perfect number within the last leg in this case © blue.
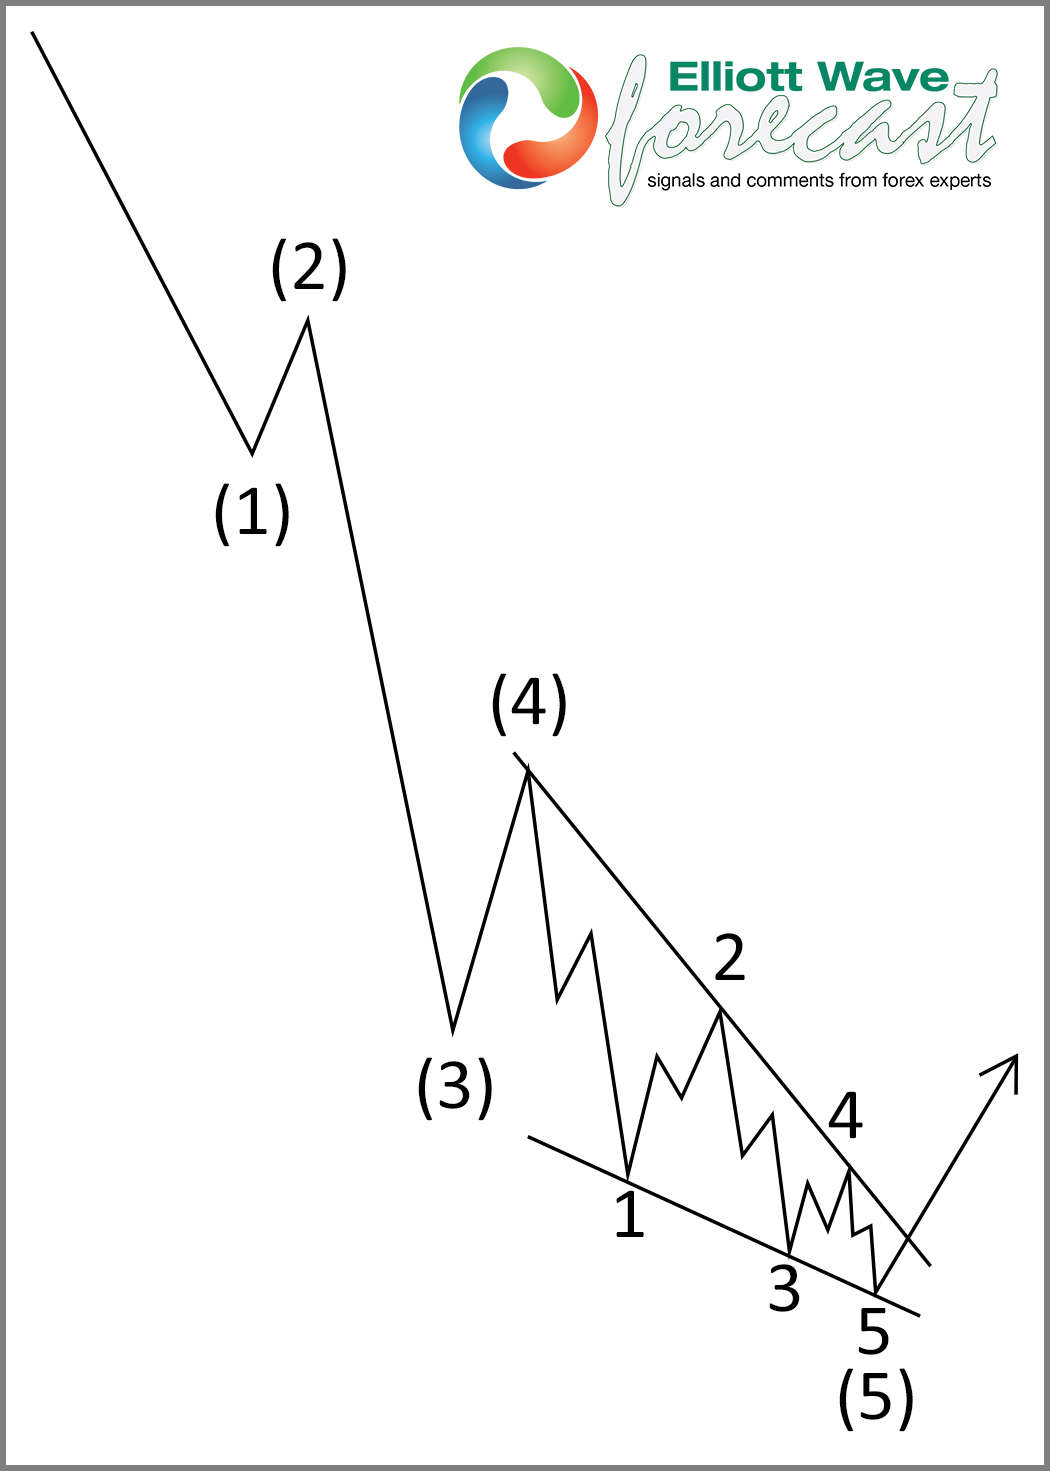
As we have been saying an Impulse is 5-9-13 and each impulse within the cycle should be in five waves. Since the peak at 02.05.2019, the decline is in five waves in red, but the last decline which started at 03.26.2020 the decline is in three waves, with no extension. We believe the instrument is doing an Ending Diagonal which guidelines
- • Special type of motive wave which appears as a subdivision of wave 5 in an impulse or subdivision of wave C in a zigzag
- • The ending diagonal is a subdivision of wave 5 in an impulse, either in wave 1 or 5.
- • Ending diagonal is usually characterized by overlapping waves 1 and 4 and also by the wedge shape.
- • The subdivision of an ending diagonal is 3-3-3-3-3 or 5-3-5-3-5.
The following chart represented how the diagonal looks in Subdivision of 3-3-3-3-3.
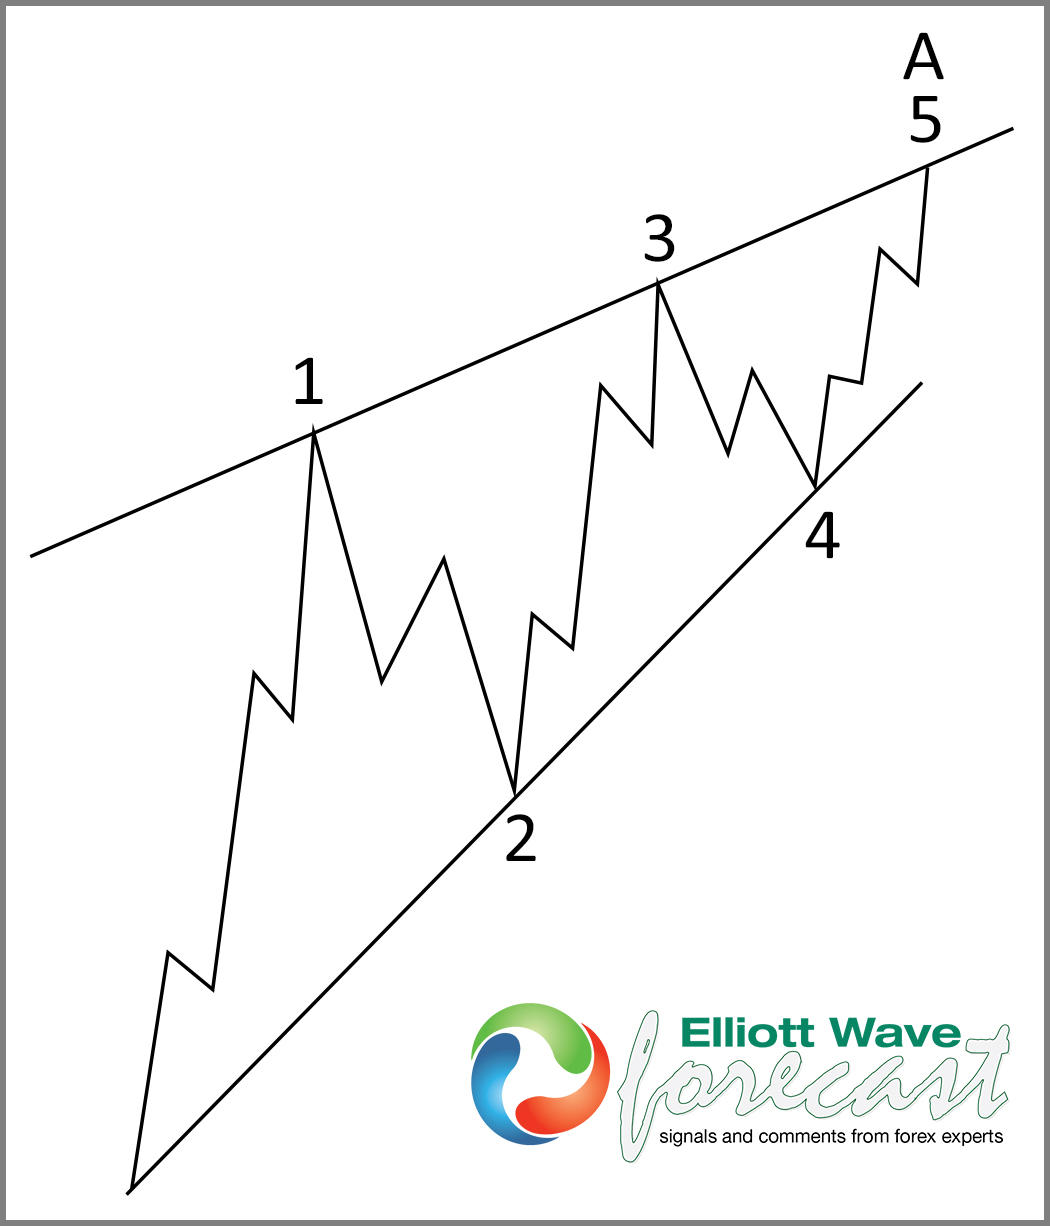
The following chart represented how the diagonal looks in Subdivision of 5-3-5-3-5.
The ending diagonal is a very great tool to locate the turn because of the terminal nature of the structure and the wedge look. Seeing the Ending Diagonal and the Blue Box it is a nice area to anticipate a turn higher soon and the possible renew of the higher degree trend.