The Elliott Wave Theory’s main pattern has a five-waves advance and three-waves pullback. The Theory explains that the market moves in sequences of five waves starting from the lower Subminutte to the higher Grand Super Cycle degree. Long-time investors look for higher degrees of correction to enter the Market. The higher degrees provide higher risk but also higher degree return.
Elliott Wave Theory’s Main Pattern

The graph above shows the main Elliott Wave’s Pattern. As we explained before, it shows the five waves’ advance and the three waves’ pullback. The Market will always trade in the direction of the previous five waves after the Zig Zag correction ends. Southwest Airlines (ticker symbol: LUV) shows a clear five-waves advance within the Grand Super Cycle which ended on 10.01.2017. Since then, it is in a correction with a structure of five-three-five. This structure is what the Theory calls a zigzag or ABC. It is a clear corrective structure because it is straightforward. We believe the market has changed and high frequency machine often indicates the 100%-161.8% area to provide a unique opportunity to enter the market in the direction of the right side.
Weekly Southwest Airlines (LUV) Elliott Wave Chart
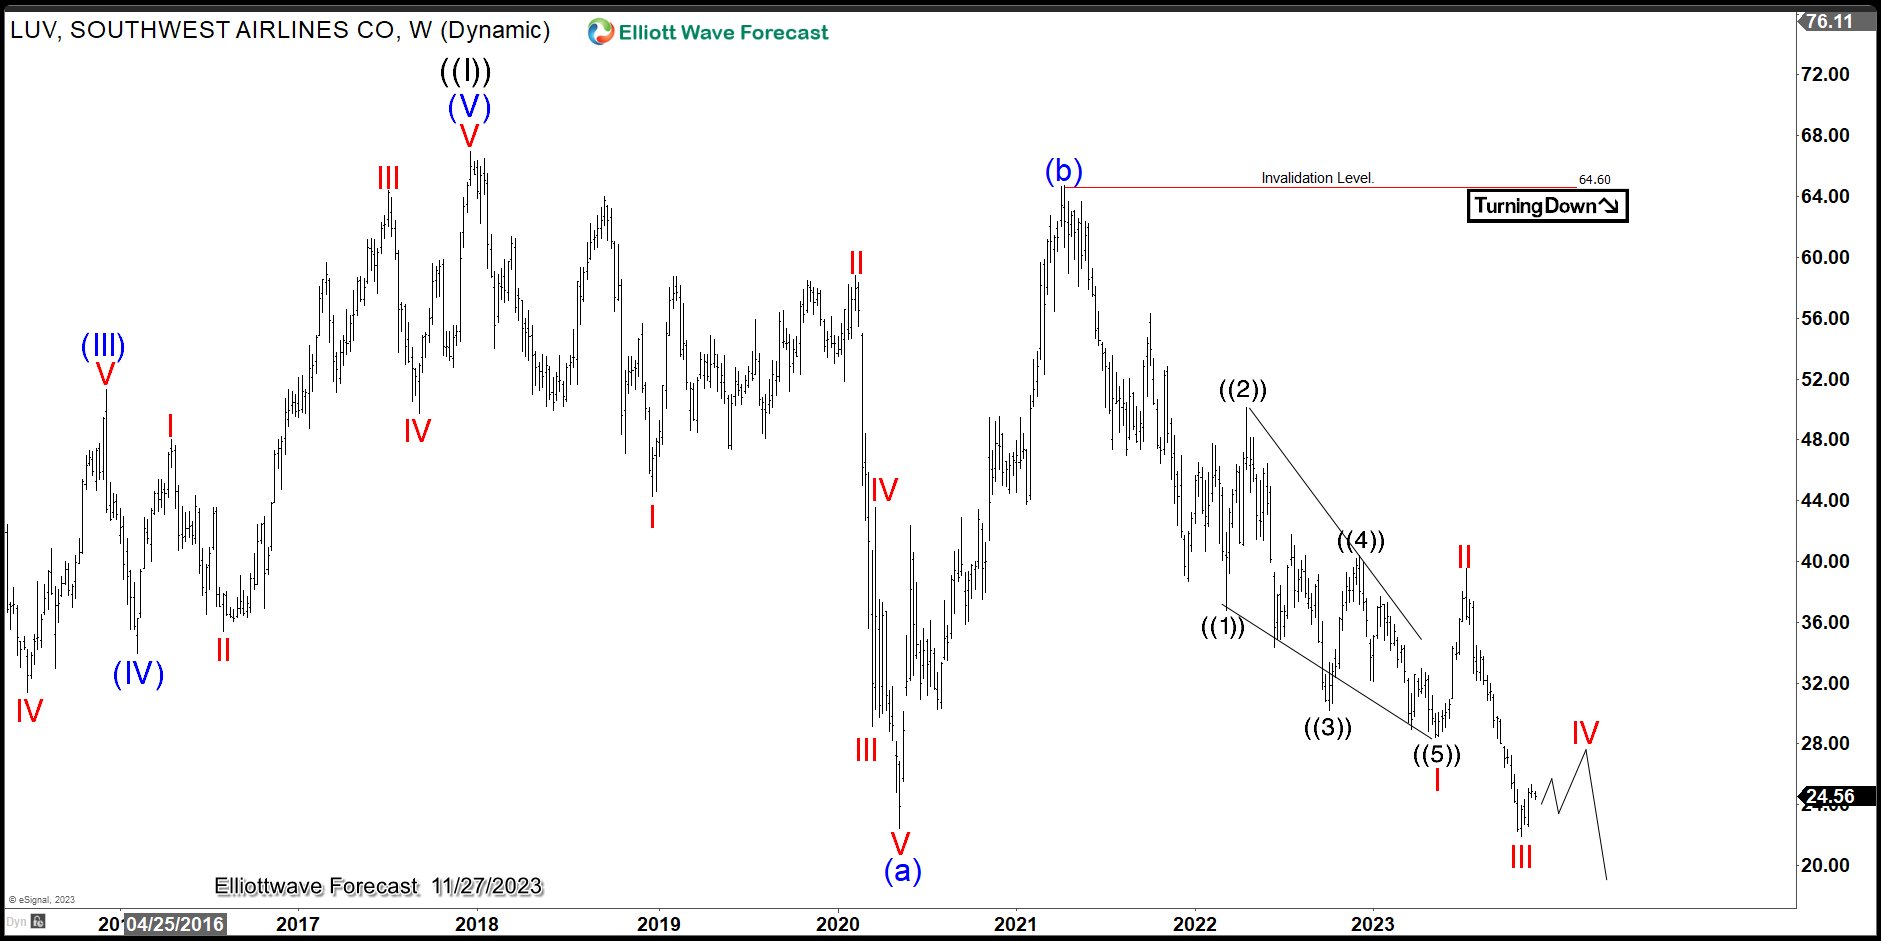
The weekly Elliott Wave chart above shows the structure of a simple ABC correction. The move started from the peak on 10.01.2017, and the C wave started on 04.01.2021.
Monthly Southwest Airlines Elliott Wave Chart
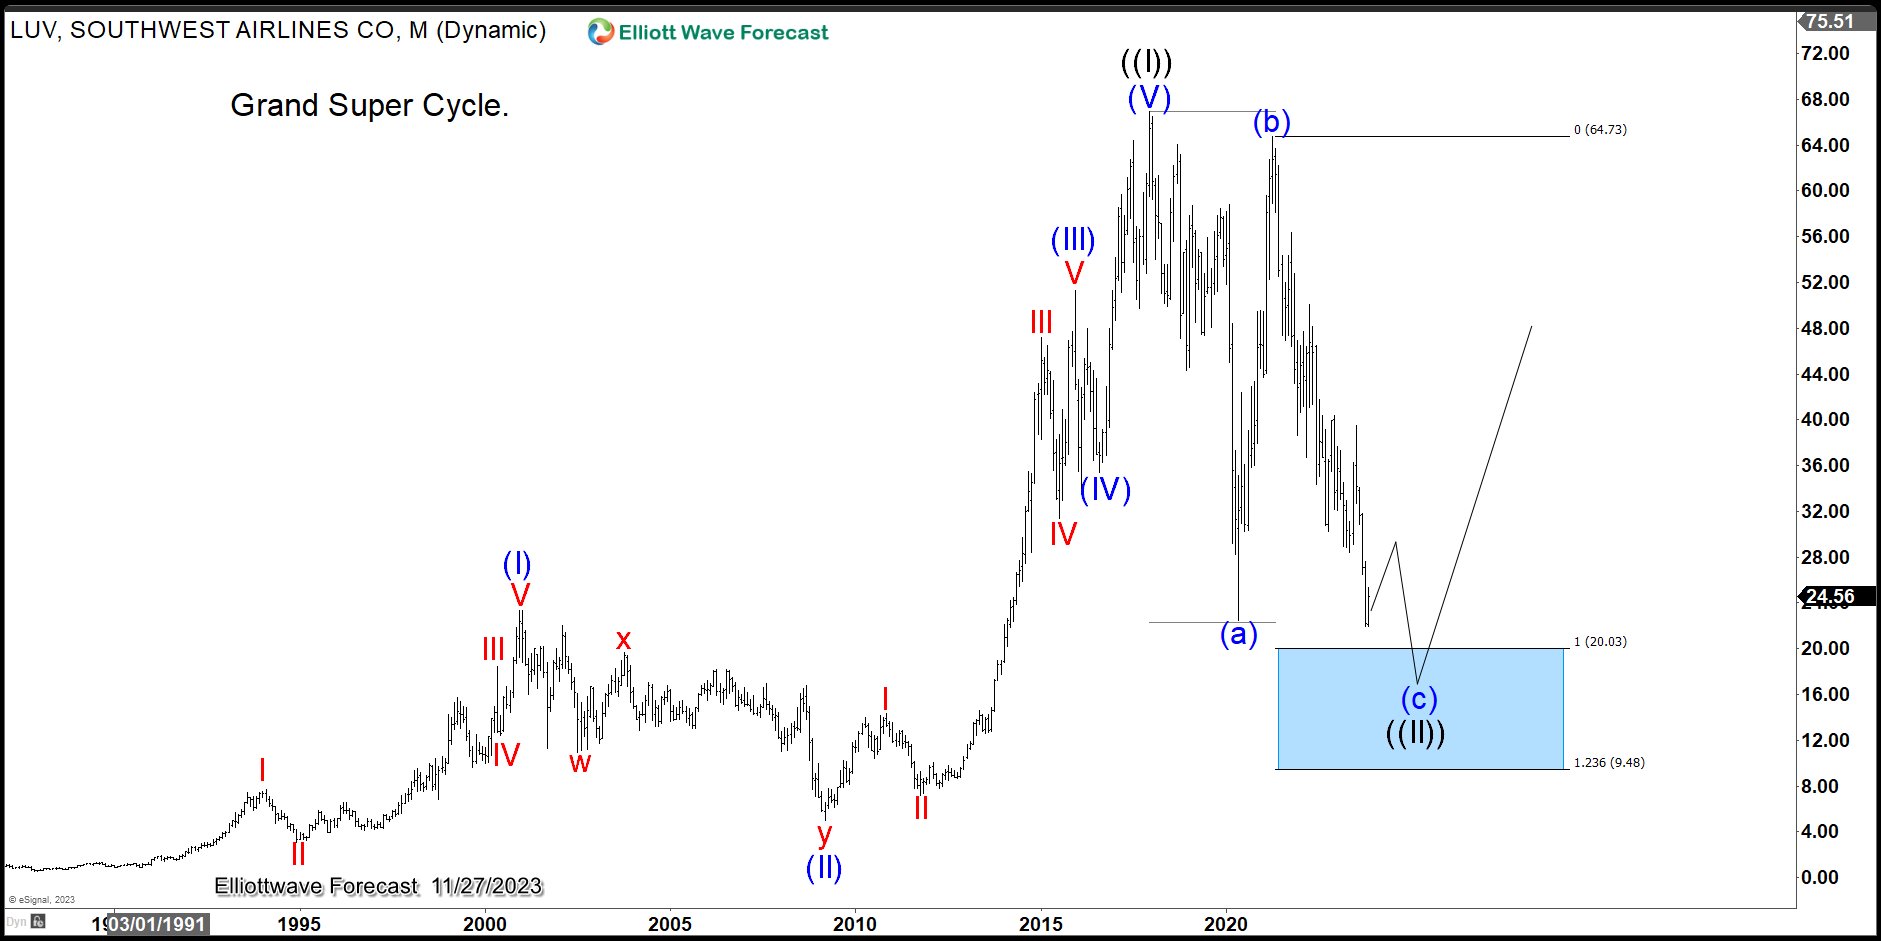
The monthly Elliott Wave Chart of LUV above shows the Grand Super Cycle for the company. It suggests the technical three waves (ABC) pullback to the Blue Box area. As we explained earlier, the right side (trend) is higher because of the five waves advance. The buyers are in complete control when the market’s impulse runs in a sequence of 5-9-13-17-21. The ABC within the correction should be trading at wave ((4)) of wave (c) lower at this point before the stock reaches the buying area.
In corrective structure, the market moves in 3-7-11. Once the correction ends, the chances of new highs from the blue box area are pretty high. Long-time investors should enter the market at the Blue Box area and let the market decide. A reaction should happen regardless. Even if the trade can take years to reach the target, the return is worth the wait.