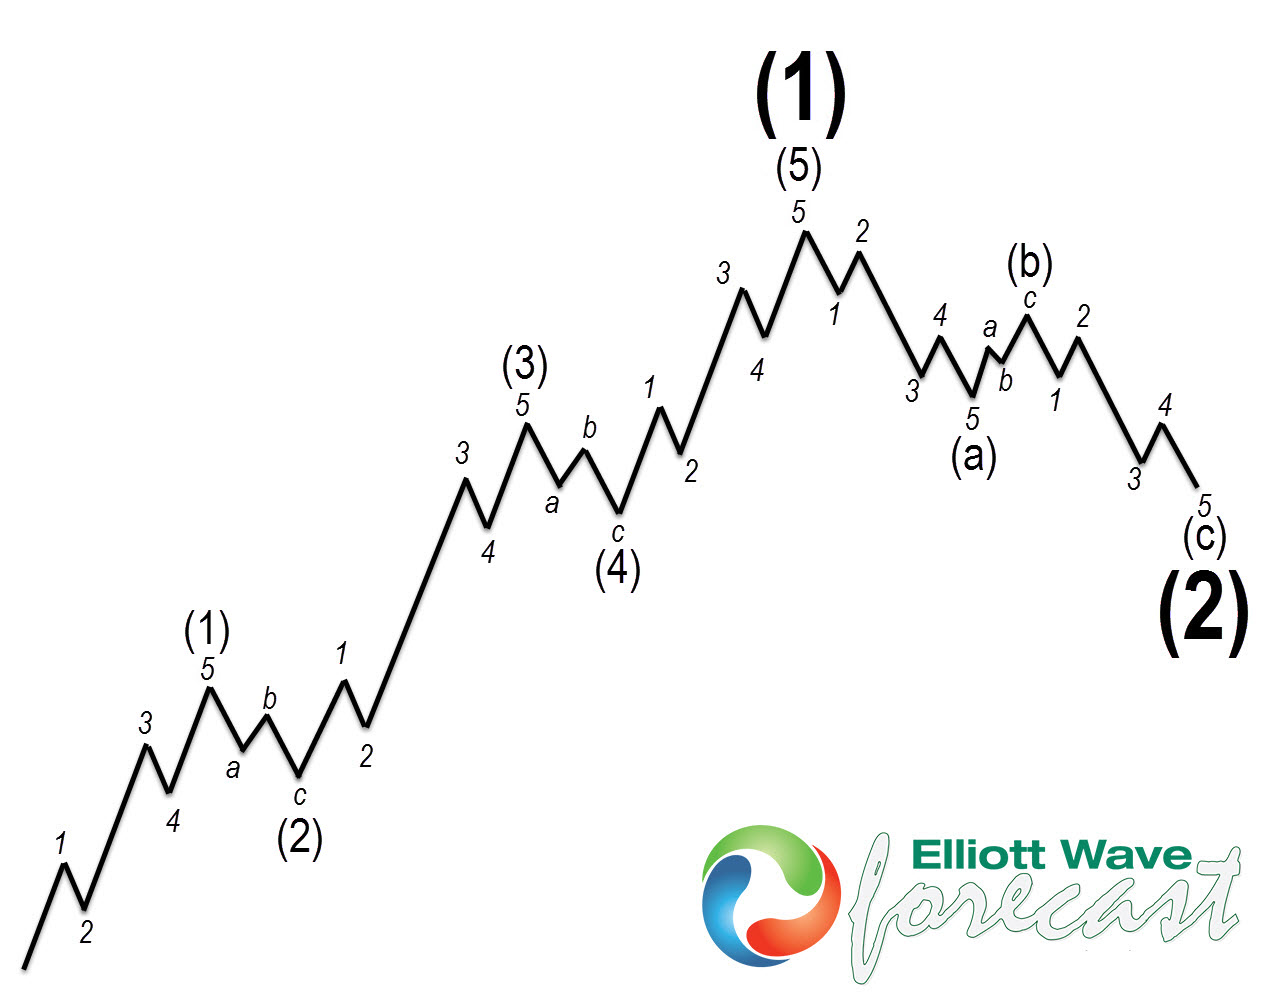
LUV (Southwest Airlines) shows a very constructive price action since the all-time lows. We can see a very nice impulse or five waves into the peak in 2017. The Elliott Wave Theory’s main message is that the trend advances in five waves and then a pullback in three waves. The following chart is a representation of the basic pattern in the Elliott wave Theory. We can see a clear five waves in which each subdivision with the trend is in five waves and each pullback is in three waves.
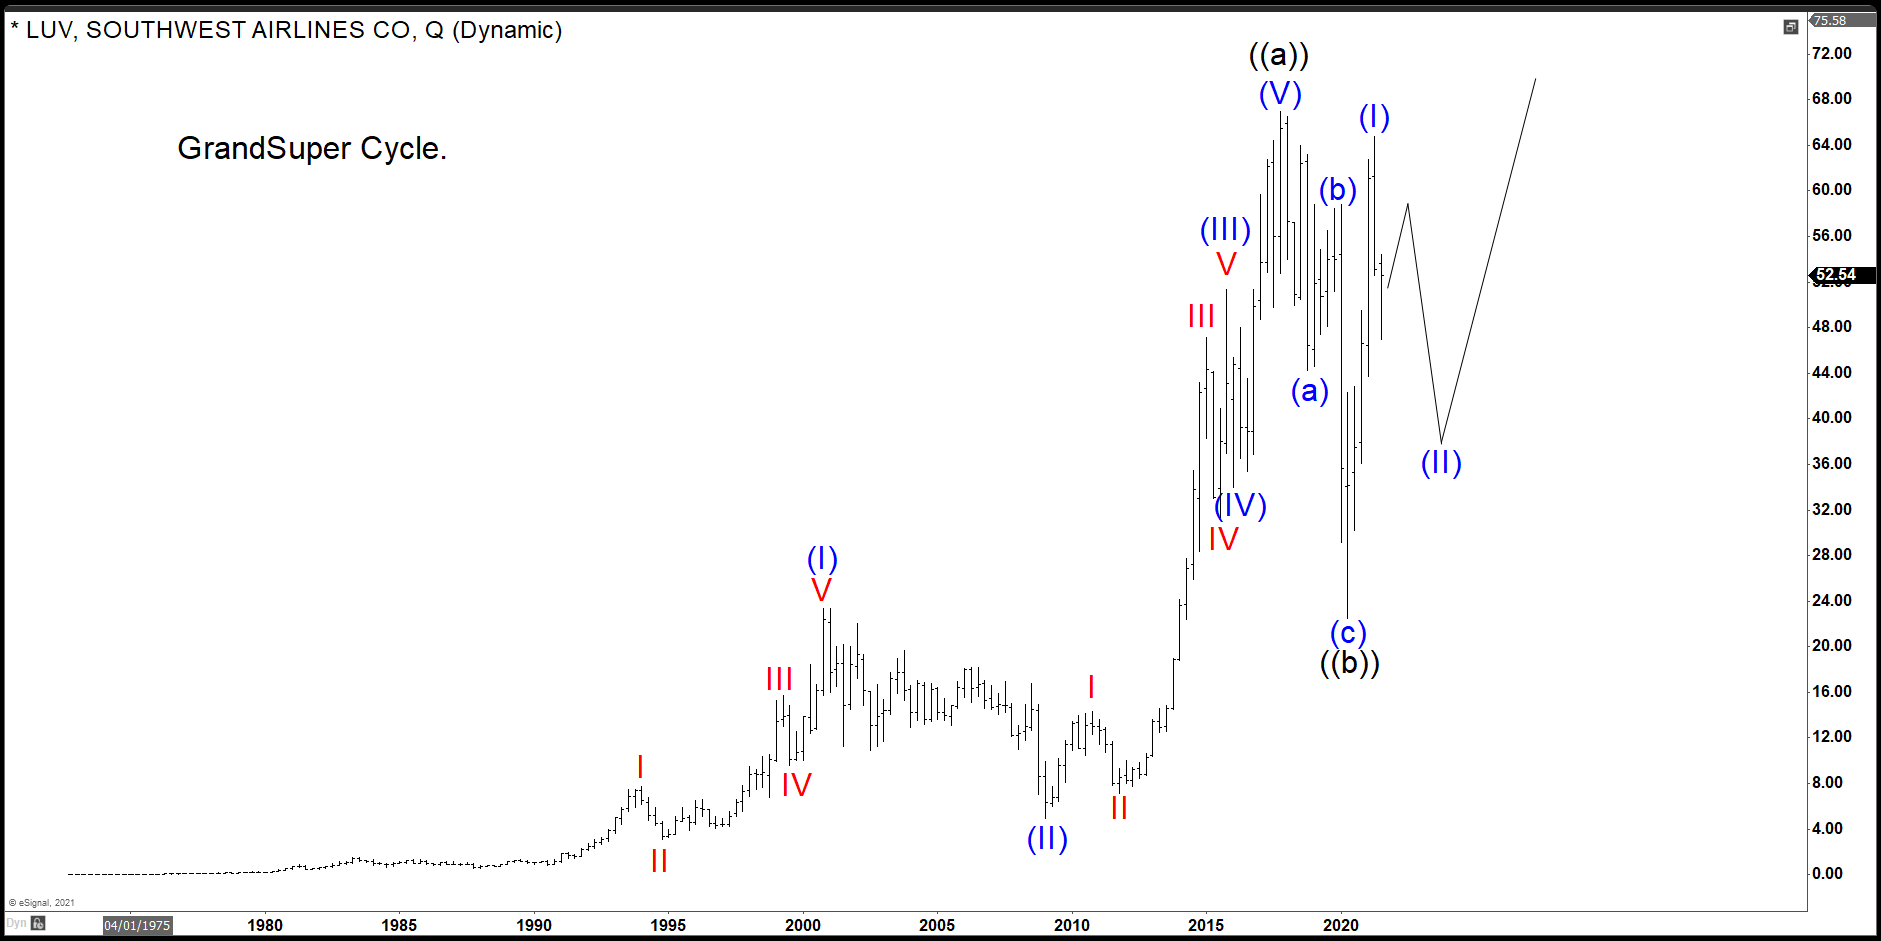
The following chart shows LUV (Southwest Airlines) Grand Super Cycle advance which is a very clear impulse or five waves advance. The five waves are represented in the blue degree, and the peak is either wave ((a))/ ((I)), and the three waves pullback might have already ended in wave ((b)) during the Covid decline. The correction can be completed and might start the next leg higher.
LUV Quarterly Elliott Wave Chart
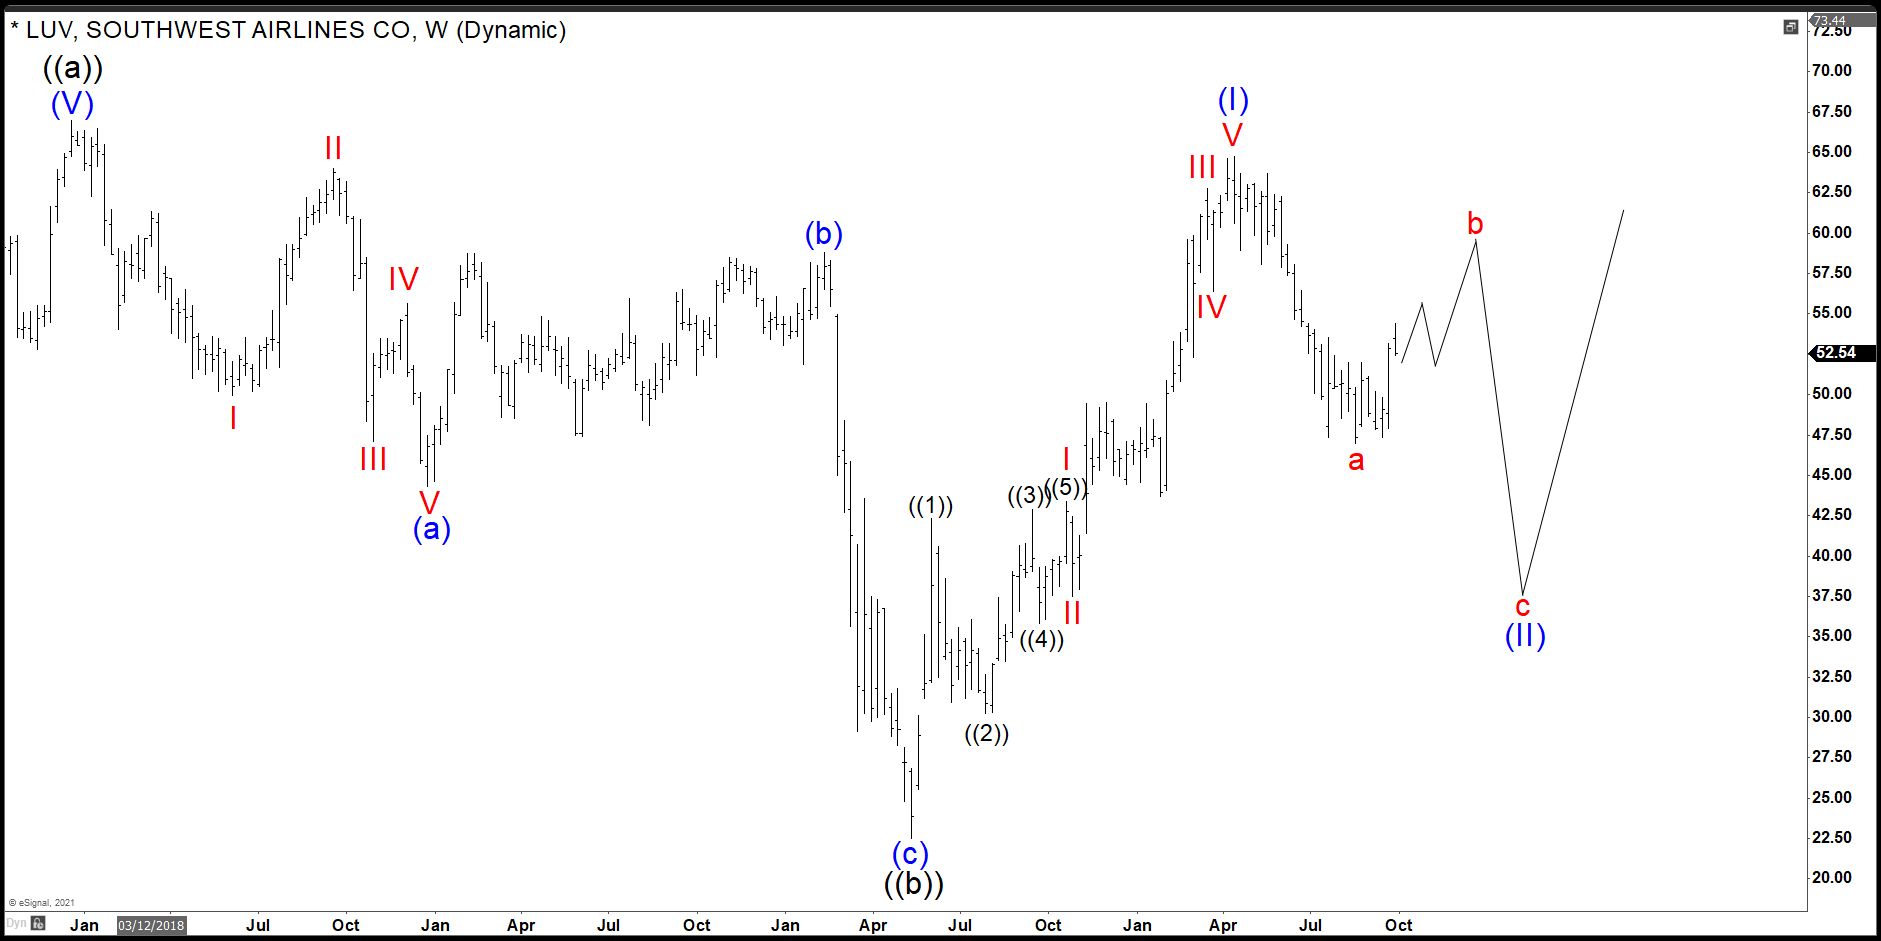
Downgrading the time frame, we can see the reaction off the lows from 05.18.2020, which is in five waves. From the peak on 04.12.2021, the price action seems impulsive which ended wave a in red. Now we are trading higher in wave b in red. We are expecting wave c lower into next year. The three waves pullback should represent a unique opportunity to buy the trend into all-time highs.
LUV Weekly Elliott Wave Chart
We can see how the Elliott wave pattern is repeating in the Grand Super Cycle and the Super Cycle trend provides a very encouraging price action for the buyers. We have a very simple recommendation to wait for the stock to drop into a long-term equal leg area before buying into all-time highs.
Source: LUV (Southwest Airlines) shows a nice Elliott wave structure