Market Structure Concepts

Hey Babypips Family,

This is Market Structure from my point of view. Interpretations of Market Structure and opinions on the topic will vary and constructive discourse is always accepted but before you think about flaming me, keep in mind that I’m describing how my brain interprets Market Structure in order to make sense of the markets. I’m not claiming to be the supreme authority or a subject matter expert on Market Structure. I’m always open to learn more about this important aspect of analysis.

Please don’t blindly accept what you read in this thread. You need to verify everything against your own charts and in fact you should do that with all information that you receive online. You don’t need to trust what I show you, you need to trust your own eyes.

I’m not intending for this to be a strategy thread, but you can use Market Structure to create or refine your own trading strategy. I believe that Market Structure can improve almost any strategy, after all there is a reason that Market Structure is King.

The reasons for this thread:

  1. In response to questions I see regarding Market Structure. Particularly when someone asks about a trade that didn’t work out as planned and misreading Market Structure was the culprit.
  2. I’m fascinated by Market Structure, which is why when Market Structure related questions come up in the forum, I’m all in.
  3. Instead of having this information spread across the forum in random replies, I figured having it organized and in one place would make it easier to follow.
  4. Market Structure is probably one of the most important concepts in chart analysis but it is also one of the concepts that is most glossed over and taught at a superficial level. I’m hoping this thread will be a resource to fill the information gap. That is not a jab at the excellent Babypips’ School of Pipsology.

Disclaimer: The content of this thread should not be considered as financial advice. DYODD.

I want to discuss Market Structure thoroughly, so I’m going to start from the very basic beginning. The beginning part of this may be a review for some of you but it will ramp up as we go along. If you’re wondering about the difference between Market Structure and Price Action, you can read my response to that question here: Market structure vs price action - #4 by MartialChartsFX.

This thread may end up being quite long but I’ll try to make it a worthwhile read (no promises :joy:).
14 Likes

What Is Market Structure?

Before you start thinking that I’m going to say Market Structure is price making higher lows and higher highs in an uptrend, etc., that would be trend identification. I’d like to start off with the individual parts that when combined result in Market Structure.
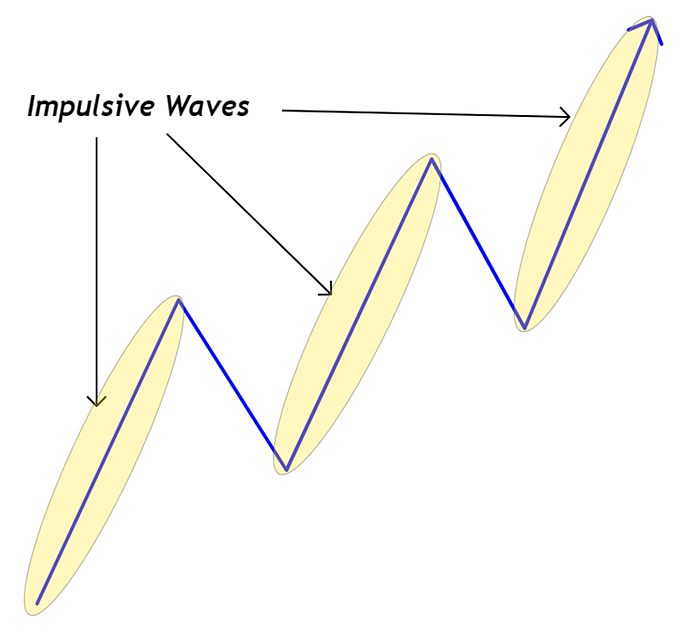
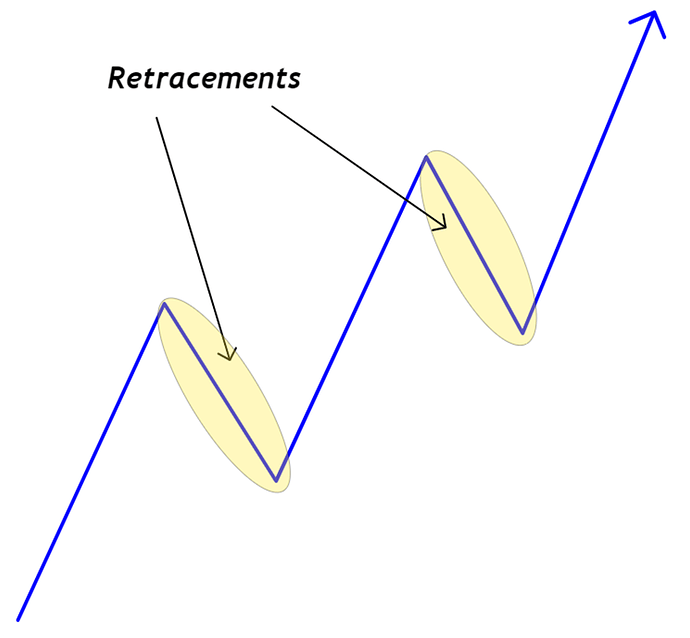
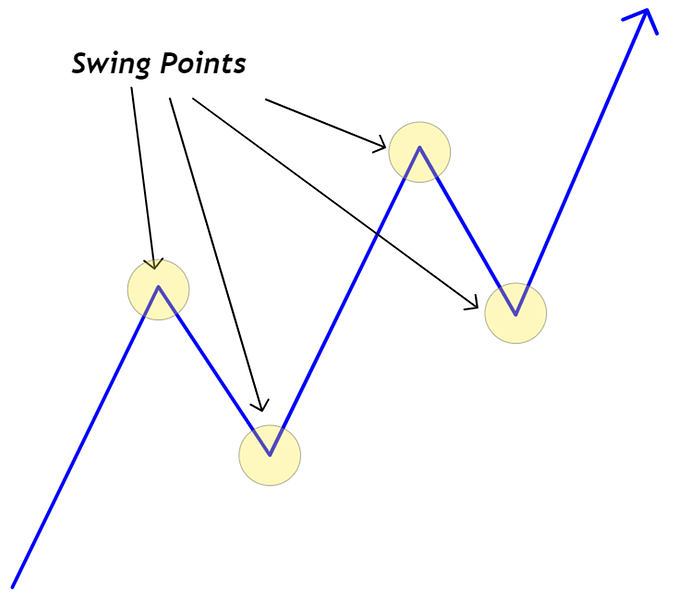
Market Structure is the structure of the market formed by Impulsive waves (also called Motive waves/phases), Retracement waves (also called Corrective waves/phases, or pullbacks), and Swing Points (also called fractals).

Impulsive Waves

Impulsive waves are strong price movements in line with the dominant trend.

Retracement Waves

Retracements are minor or corrective counter trend price moves in between the Impulsive waves.

Swing Points

Swing Points form between Impulsive waves and retracement waves and are the transitional points of connection between the Impulsive and Corrective phases of the market.

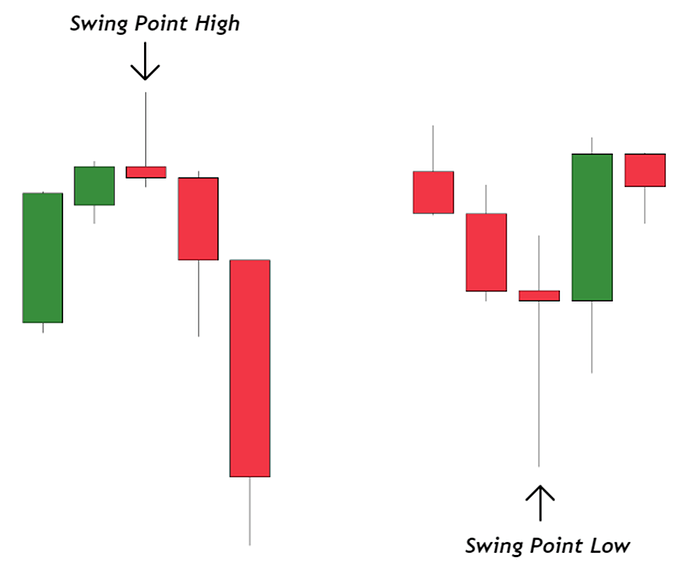
On a candlestick chart, within the circled areas above you would find either Swing Point Highs or Swing Point Lows.

The Swing Point High or Swing High is the highest candle at the peak of an impulsive wave or retracement and is flanked by 2 candles that are lower to its left and 2 flanking candles that are lower to its right. Outermost candles should have lower highs than innermost candles.

The Swing Point Low or Swing Low is the lowest candle at the trough of an impulsive wave or retracement and is flanked by 2 candles that are higher to its left and 2 flanking candles that are higher to its right. Outermost candles should have higher lows than innermost candles.

Swing points are more than just a point of connection or transitional point between the impulsive and retracement phases. Swing points are the structural points that give definition to Market Structure.

These structural definitions include:
• Higher Highs (HH)
• Higher Lows (HL)
• Lower Highs (LH)
• Lower Lows (LL)
• Equal Highs (EH)
• Equal Lows (EL)

4 Likes

How Does Market Structure Define A Trend?

This is where we get to the part that most people are familiar with and where most of the available information on Market Structure tends to end.

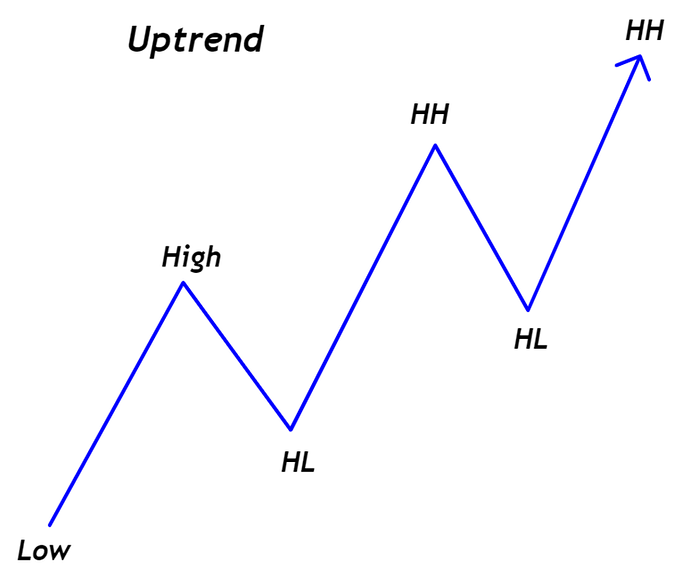
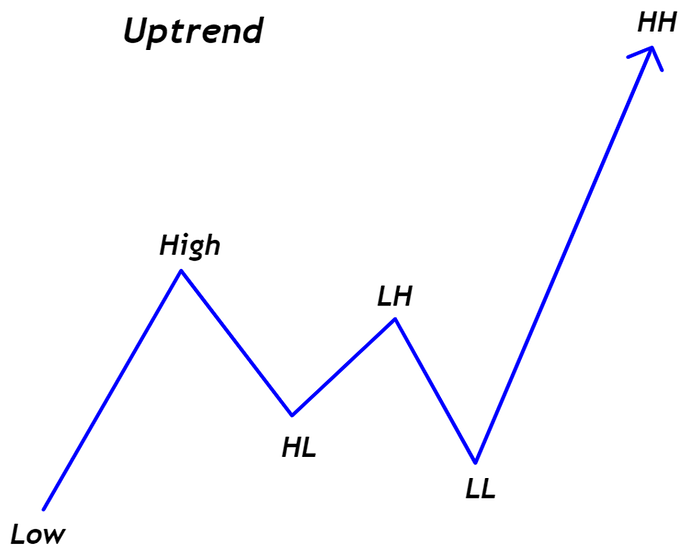
An Uptrend is defined by a series of Higher Lows and Higher Highs.

The emphasis in the uptrend is the creation of subsequent Higher Lows.

If price makes a Lower Low than the most recent valid Higher Low, the uptrend is considered to be invalidated.

A Higher Low is validated as a strong level of support if it leads to a Higher High.

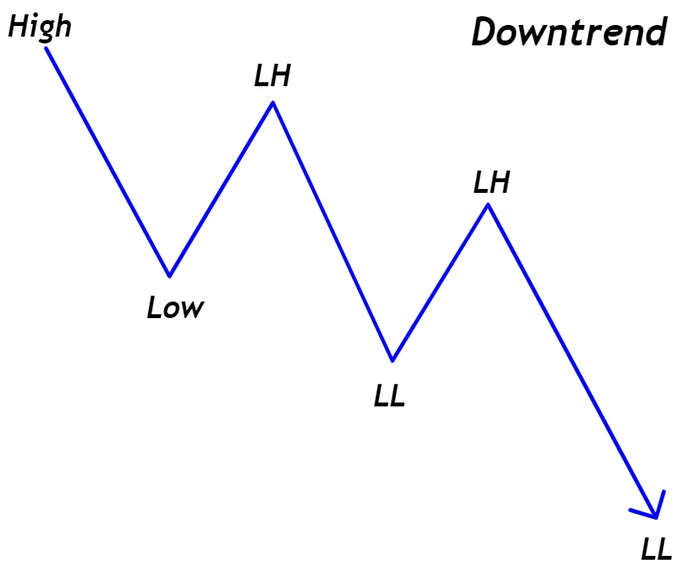
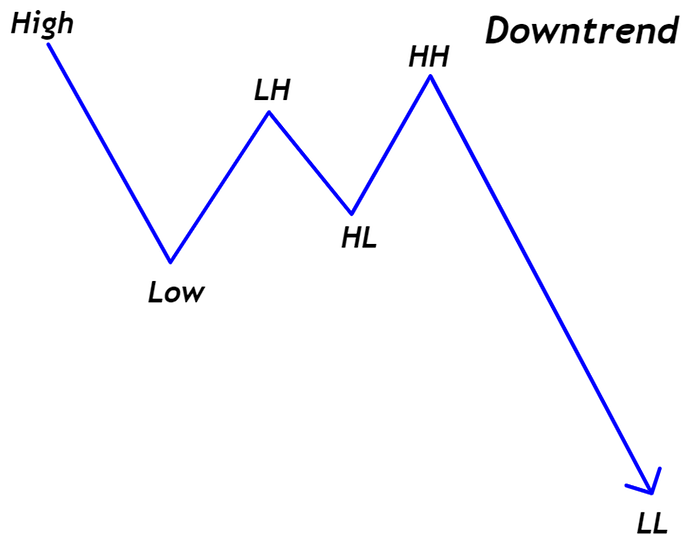
A Downtrend is defined by a series of Lower Highs and Lower Lows.

The emphasis on the downtrend is the creating of subsequent Lower Highs.

If price makes a High that is higher than the most recent valid Lower High, the downtrend is considered to be invalidated.

A Lower High is validated as a strong level of resistance if it leads to a Lower Low.

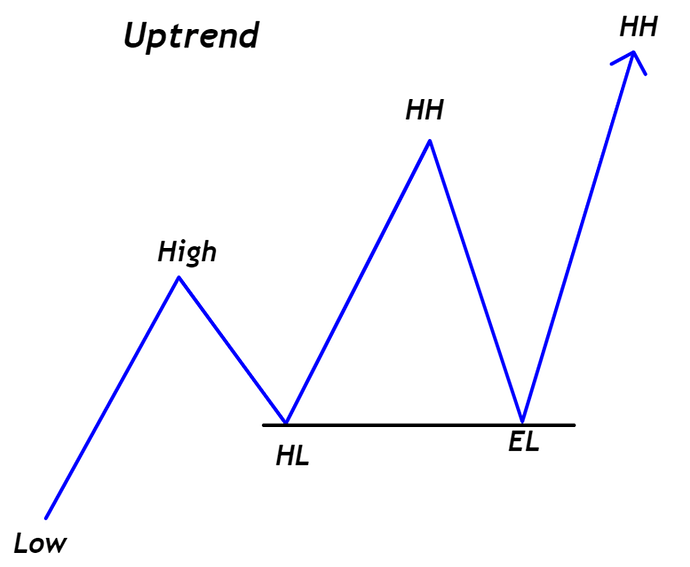
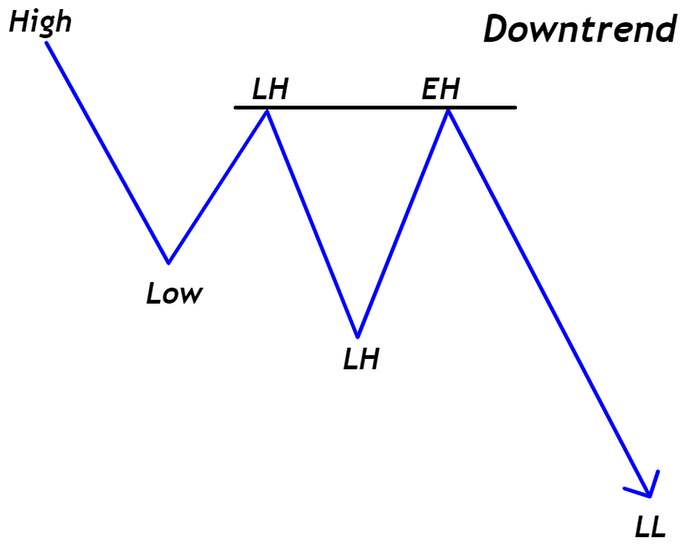
Here are some textbook examples of Uptrend and Downtrend variations. Don’t worry, I’ll get to the messy examples later but for now I want you to clearly see the structure.


Textbook example of an Uptrend


Textbook example of a Downtrend

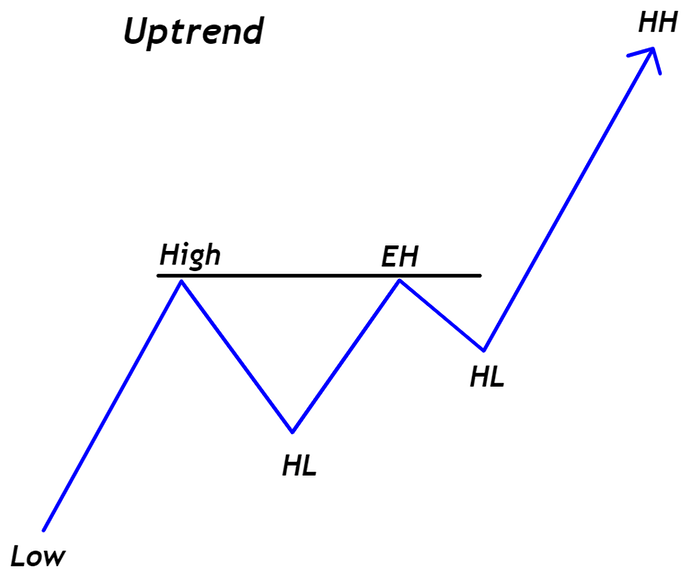
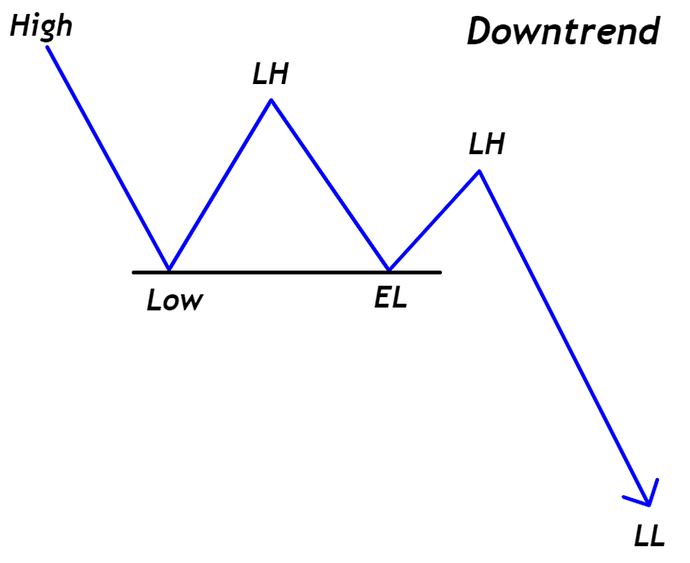
The following examples are variants of Uptrend and Downtrend formations that can cause some confusion because they’re not like the two previous images of a classic textbook Uptrend and Downtrend.

Price can make Equal Highs while respecting the Higher Lows and still be considered an uptrend until a reversal is confirmed.


Equal Highs in an Uptrend

Price can make Equal Lows while respecting the Lower Highs and still be considered a downtrend until a reversal is confirmed.


Equal Lows in a Downtrend

Price can make Equal Lows that respect the last valid Higher Low and still be considered an uptrend.


Equal Lows in an Uptrend

Price can make Equal Highs while respecting the Lower Highs and still be considered a downtrend until a reversal is confirmed.


Equal Highs in a Downtrend

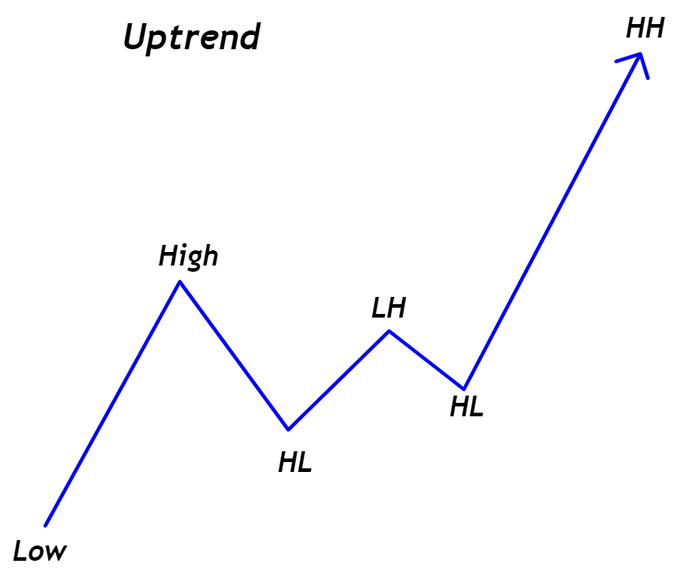
Price can make Lower Highs while respecting the Higher Lows and still be considered an uptrend until a reversal is confirmed.


Lower High in an Uptrend

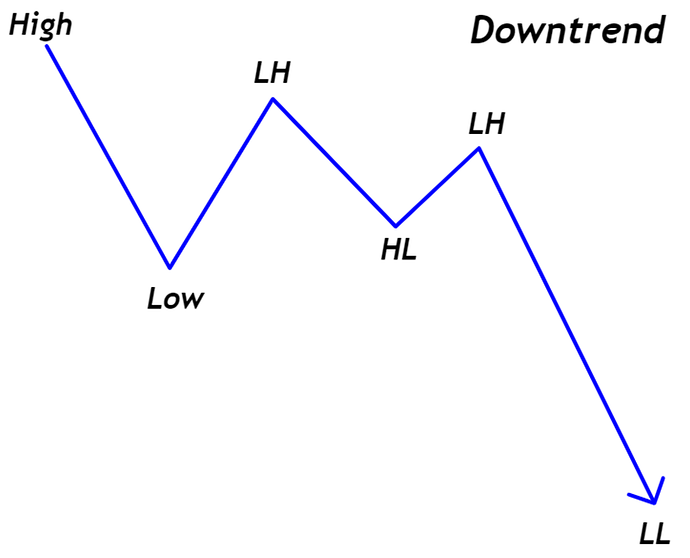
Price can make Higher Lows while respecting the Lower Highs and still be considered a downtrend until a reversal is confirmed.


Higher Low in a Downtrend

Note: The previous two illustrations of the Lower High in an Uptrend and a Higher Low in a Downtrend represent market noise and will be revisited in the case study later in the thread.

Price can make Lower Lows while respecting the Higher Lows and still be considered an uptrend until a reversal is confirmed.


This uptrend with a complex retracement often confuses traders when it forms in real-time

Price can make Higher Highs while respecting the Lower Highs and still be considered a downtrend until a reversal is confirmed.


Downtrend with a complex retracement

We will discuss the complex retracement at length later in this thread.

With all these variations of Uptrends and Downtrends, this all goes to say that the last valid Higher Low does the heavy lifting in keeping the Uptrend intact and that the last valid Lower High does the heavy lifting in keeping the Downtrend intact.

5 Likes

Market Structure Rules

To make following Market Structure easier for myself, I defined six rules that I apply to a trend. I find these easy to remember and if the market is ever unclear, I can compare the market against these rules and determine if conditions are suitable for trading or better suited for waiting.

Uptrend Rules
• In an uptrend price should not break below the last valid Higher Low
• Valid Higher Lows initiate the creation of Higher Highs in an uptrend
• Higher Highs lead to Higher Lows or Equal Lows in an uptrend
• Trend change from bullish to bearish requires the breaking of Higher Lows
• In an uptrend Higher Lows are strong support and Higher Highs are weak resistance
• Higher Lows that fail to make Higher Highs become weak support and a targeted level for retest or reversal.

Downtrend Rules
• In a downtrend price should not break above the last valid Lower High
• Valid Lower Highs initiate the creation of Lower Lows in a downtrend
• Lower Lows lead to Lower Highs or Equal Highs in a downtrend
• Trend change from bearish to bullish requires the breaking of Lower Highs
• In a downtrend Lower Highs are strong resistance and Lower Lows are weak support
• Lower Highs that fail to make Lower Lows become weak resistance and a targeted level for retest or reversal.

I know that you may be wondering about Ranges and Consolidation, well I didn’t forget about those, I’m saving that part for further down the thread.

4 Likes

The Market Structure Trading Range

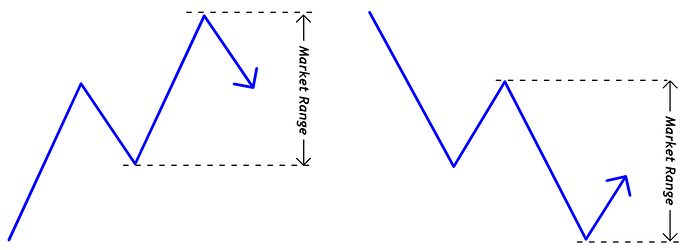
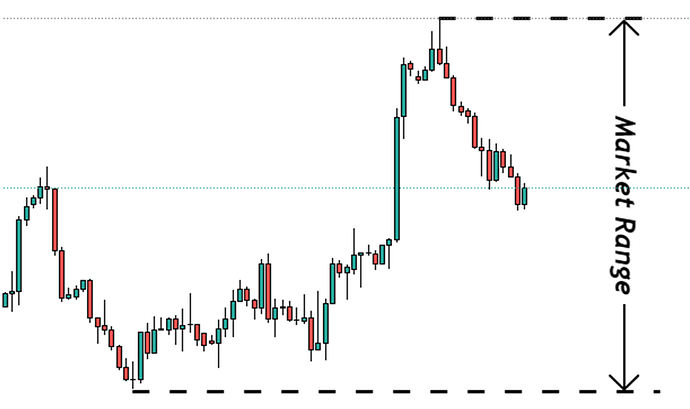
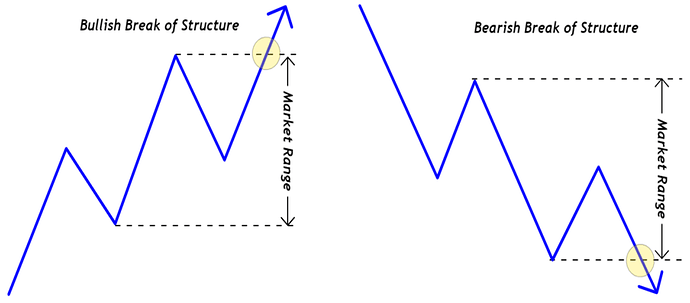
The Market Structure Trading Range is the distance between the most recent low and high of the impulsive wave that created a Break of Structure.

Within this Market Structure Trading Range is where a retracement will occur or a ranging market condition may form.


Market Structure Trading Range

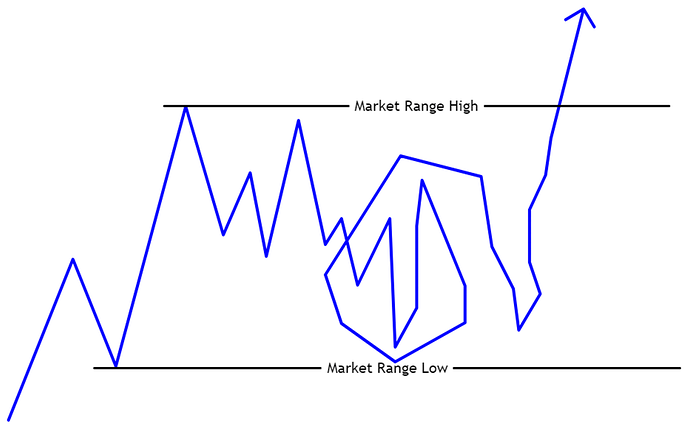
As long as price stays within this Market Structure Trading Range on the given time frame, the current structure is intact on that time frame.

It’s also important to note that price may retrace to the extremes of the Market Structure Trading Range without being considered a reversal. Price may also create Equal Highs and Equal Lows within the Market Structure Trading Range without being considered a reversal.

In this ridiculous image below, the uptrend is intact as long as the Market Structure Trading Range low is not violated. No matter how much price tries to fake us out, if the Market Structure Trading Range low is intact then the uptrend is intact.

Market Structure Trading Ranges can be found on every time frame due to the fractal nature of price. You will find Market Structure inside of Market Structure as you move between time frames.

If you use a strategy with a foundation in Market Structure, the most recent Market Structure Trading Range created by an impulsive wave is the Market Structure Trading Range that should be analyzed and traded within. Starting at higher time frame structures and working down to the lower time frame structures.

Next we’ll review some of the behaviors that Market Structure exhibits.

3 Likes

Break of Structure (BOS)

A Break of Structure (BOS) occurs when the Market Structure Trading Range has a breakout in a continuation of the trend resulting in the establishment of a new Market Structure Trading Range.

Before we move on, please understand the following 2 points regarding the Breaking of Structure:

  1. Retracements Do Not Break Structure.
  2. Only Impulsive Waves Can Break Structure.

If you see what should be a retracement suddenly breaking structure, that retracement should be treated as an impulsive wave and used to define a new Market Structure Trading Range.

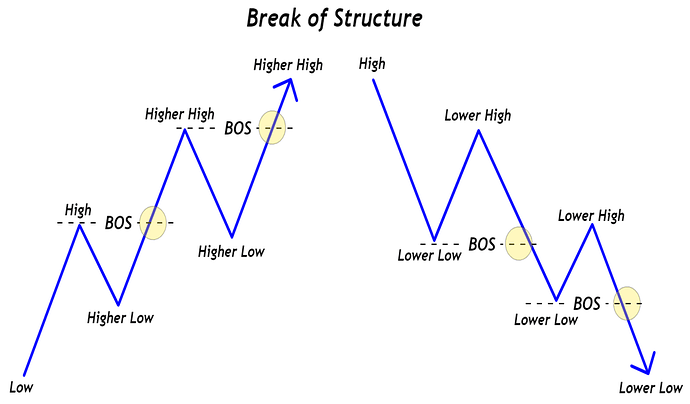
Bullish Break of Structure: The last Higher High is exceeded (broken) by a new Higher High in an uptrend.

Bearish Break of Structure: The last Lower Low is exceeded (broken) by a new Lower Low in a downtrend.

3 Likes

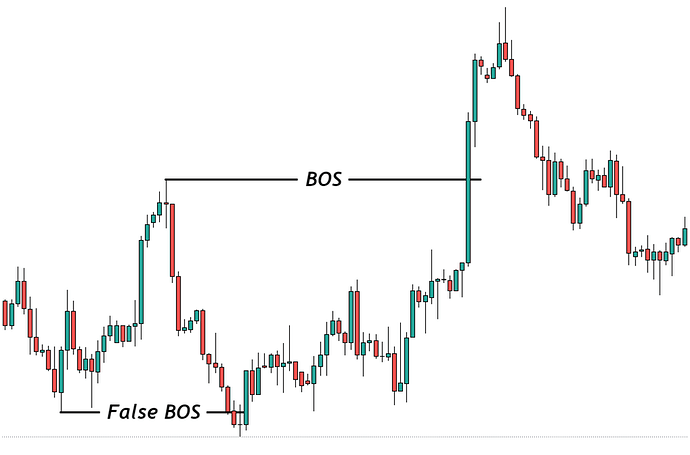
False Break of Structure

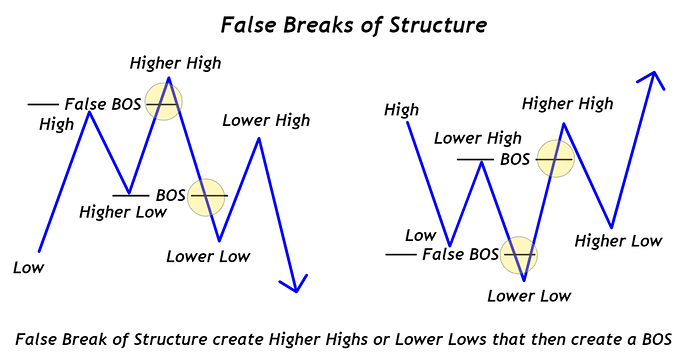
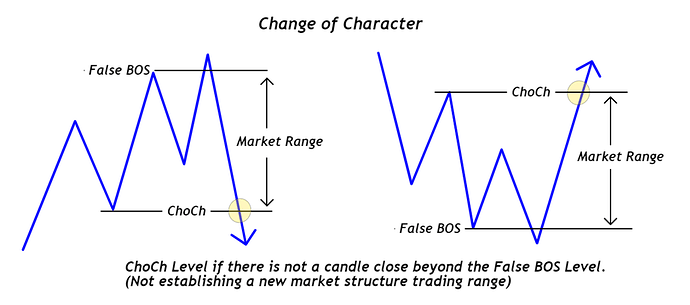
A bullish False Break of Structure makes a Higher High and then trades back down into the previously broken Market Structure Trading Range and often (but not always) violates the last valid Higher Low.

A bearish False Break of Structure makes a Lower Low and then trades back up into the previous broken Market Structure Trading Range and often (but not always) violates the last valid Lower High.

A False Break of Structure usually occurs with a candle wick that breaks structure without a candle body closing beyond structure. False Breaks of Structure are also known as False Breakouts, Failed Breakouts, Fake Outs, Liquidity Sweeps, Stop Hunts, and if you’re really paranoid you can call it Manipulation.

For all the purists out there: The BOS labeled in the 2 prior illustrations will later be defined as a Change of Character (ChoCh). The BOS label is used to highlight the difference between a False Break of Structure and a ‘True’ Break of Structure.

3 Likes

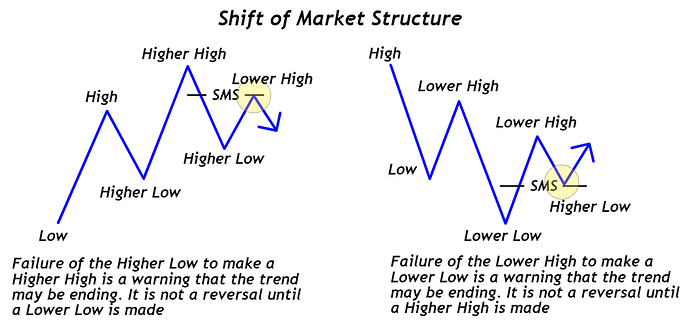
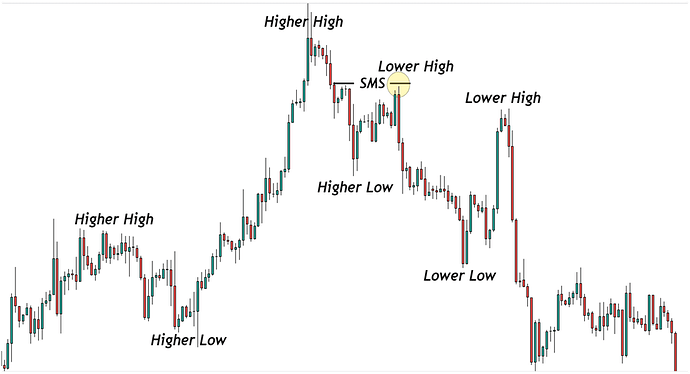
Shift of Market Structure (SMS)

A Shift of Structure or Shift of Market Structure, also known as a Failure Swing, is a failure of the Higher Low to create a Higher High in an uptrend or a failure of the Lower High to create a Lower Low in a downtrend.

This serves as a warning that the trend may soon be changing or a range forming. The current trend is still intact unless the Shift of Structure is followed by
• Equal Low/Equal High (entering a range)
• Lower Low (uptrend becoming a downtrend)
• Higher High (downtrend becoming an uptrend)

3 Likes

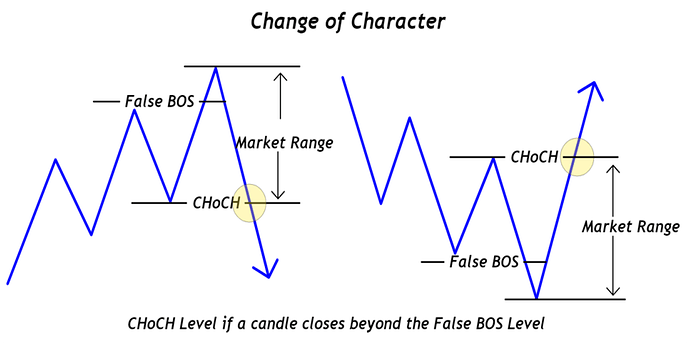
Change of Character (ChoCh)

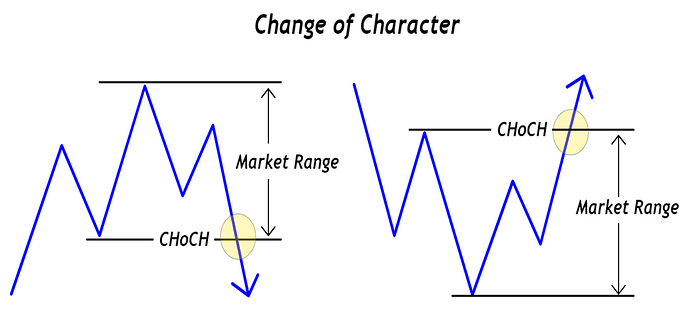
A Change of Character (ChoCh) is a type of Break of Structure but it only occurs in a reversal. The ChoCh occurs when the Market Structure Trading Range has a breakout in a reversal resulting in the establishment of a new Market Structure Trading Range. As with the BOS, please remember that

  1. Retracements Do Not Break Structure.
  2. Only Impulsive Waves Can Break Structure.

Bullish ChoCh: The last valid Lower High that is the Market Structure Trading Range High is violated (with a candle close) by a new Higher High in the reversal of a downtrend.

Bearish ChoCh: The last valid Higher Low that is the Market Structure Trading Range Low is violated (with a candle close) by a new Lower Low in the reversal of an uptrend.

This variation of a ChoCh (preceded by a Shift of Market Structure) is also valid:

4 Likes

The Complex Retracement

This is where we dive deeper and as promised we will discuss the Complex Retracement at length. Understanding the Market Structure Trading Range will help with understanding the complex retracement.

In the following images that were previously shared, you should ignore the LH, HL, LL, HH labels that are between the High and Low labels (between the Market Structure Trading Range). The descriptions will be re-assigned appropriately in this section.


The Complex Retracement can be difficult to analyze in real time as price is developing.

This complex retracement poses a risk to the trader that has not anchored their highs and lows of the current Market Structure Trading Range to the correct swing points.

I consider these to be traps or false changes of character that are internal to the Market Structure Trading Range.

3 Likes

Complex Retracement Case Study: XAUUSD M5

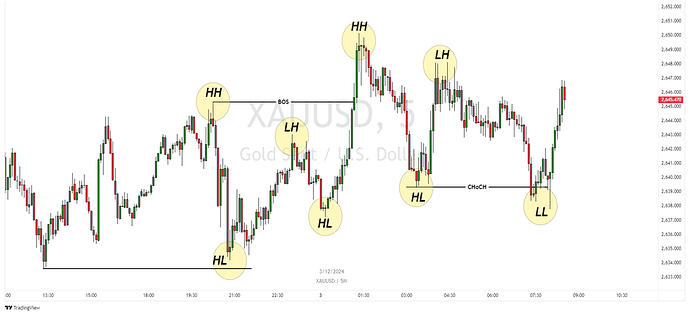
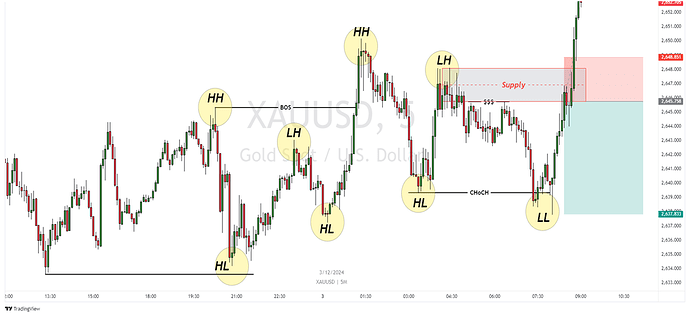
This case study of XAUUSD on the 5 Minute time frame, is based on a complex retracement before a continuation.

We will be able to see where the trap is set and how traders fall prey to the complex retracement and the false ChoCh.

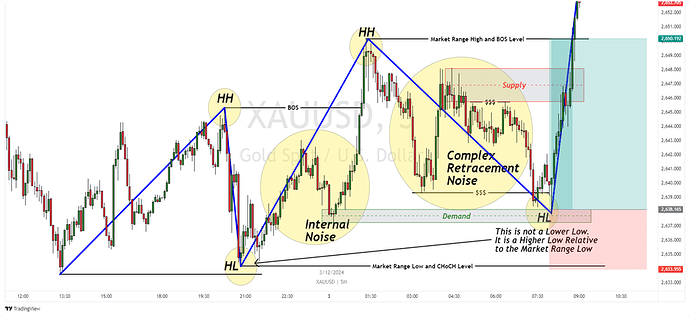
As price is making what is believed to be a Lower High and then a Lower Low that violates a Higher Low, it presents as a possible Change of Character.

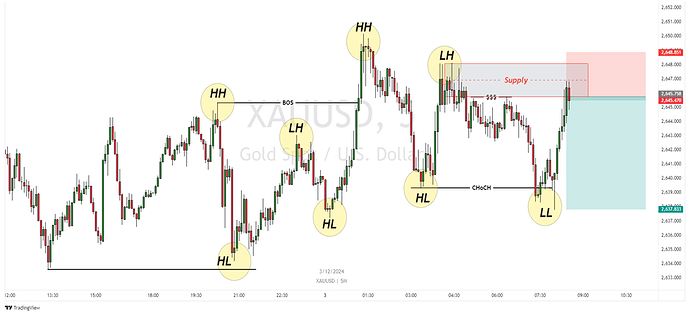
This ChoCh may induce traders into believing that now is the time to open a short position on the assumption that a new Lower High is developing. This trap further ensnares Smart Money Concepts traders with liquidity above relatively equal highs which SMC traders see as a strong confluence.


If you posted this setup on social media or in a forum, you would no doubt have some traders agreeing with your analysis.

However the results are what is to be expected when stepping into a trap based on market noise.

And just like that, a trade is lost to a complex retracement as shown in the original diagram below.

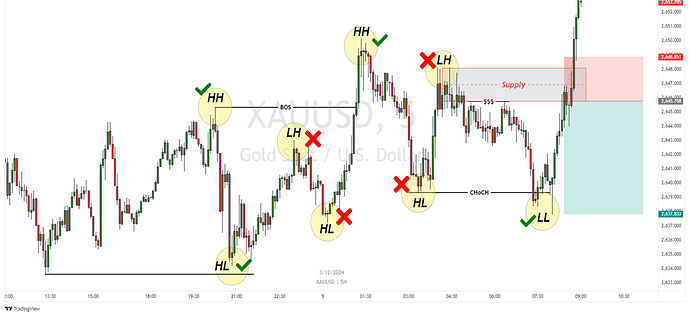
To correct this analysis error, we need to identify the valid structural swing points that we will consider and the invalid structural swing points that will be ignored as market noise.

You may be wondering why the swing points marked with a red X are invalid. This validation process is based on the Market Structure Rules that we discussed earlier. From left to right, I’ll list the reasons below:

Invalid LH : Valid Lower Highs lead to Lower Lows but this Lower High lead to a Higher Low so it’s invalid and a targeted level for retest or reversal. It is also internal to the range prior to the BOS.

Invalid HL : Higher Lows should come from a Higher High. The Higher Low was initiated by an invalid Lower High. Highs and Lows alternate so we can’t have 2 consecutive lows without a high in between and the Invalid Lower High doesn’t qualify. It is also internal to the range prior to the BOS.

Invalid HL : Valid Higher Lows create Higher Highs but this Higher Low lead to a Lower High so it’s invalid and a targeted level for retest or reversal.

Invalid LH : This Lower High was initiated by an invalid Higher Low. Highs and Low alternate so we can’t have 2 consecutive highs without a low in between and the Invalid Higher Low doesn’t qualify. Valid Lower Highs lead to Lower Lows but this Lower High lead to a Higher Low so it’s invalid and a targeted level for retest or reversal. Before you say “But it did lead to a Lower Low”, look again with the noise removed and when considering the Market Structure Trading Range (see below).

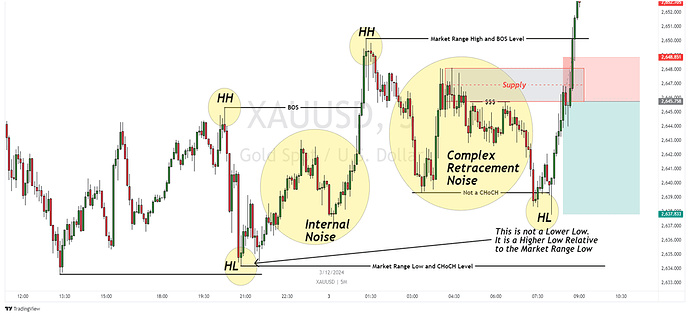
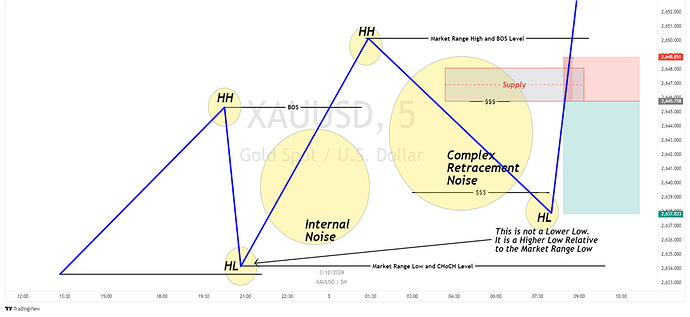
With the invalid swing points removed, we are left with the pertinent structural swing points only. Since we are now ignoring any invalid internal structure, we can properly label what was originally a Lower Low (LL) as a Higher Low (HL) because it is a higher low relative to the Low that actually matters.

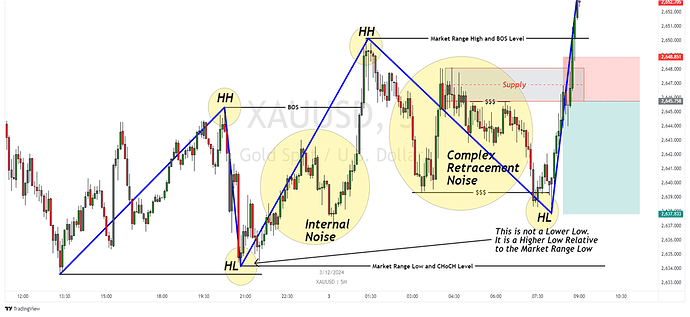
Connecting the valid structural swing points with a zig zag reveals the true market structure.
The zig zag is for illustration purposes only and is not required in order to properly analyze Market Structure.

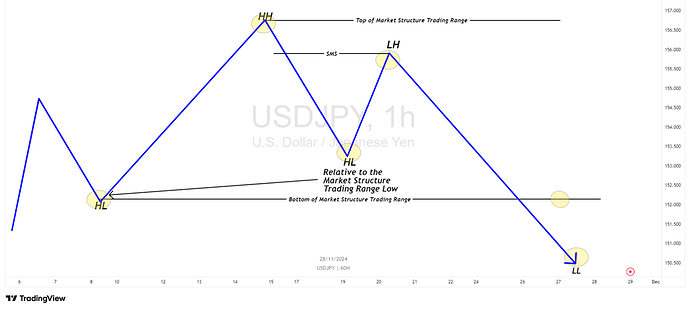
When you hide the candles, we are left with textbook Market Structure that is much easier to analyze.

Once you remove the noise, the Market Structure is much easier to follow and easier to trade correctly.

The Market Structure Trading Range is a very important anchoring point for your analysis. When the market is moving irrationally, the first thing I do is try to identify the Market Structure Trading Range so that I can regain my bearings. Now stick with me, we have another Complex Retracement Case Study.

5 Likes

Complex Retracement Case Study: USDJPY H1

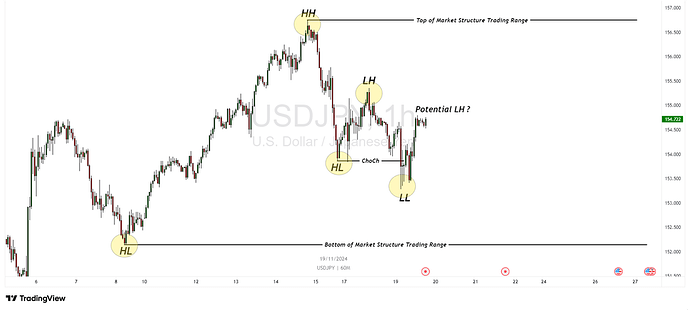
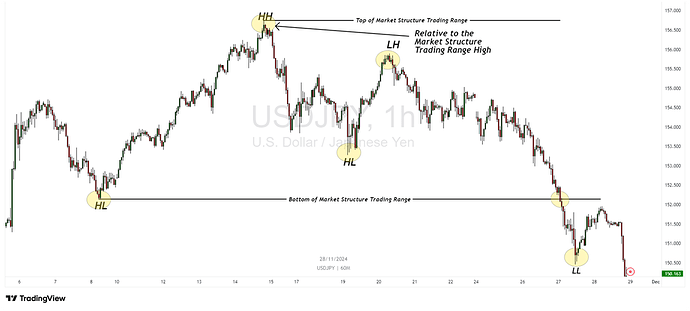
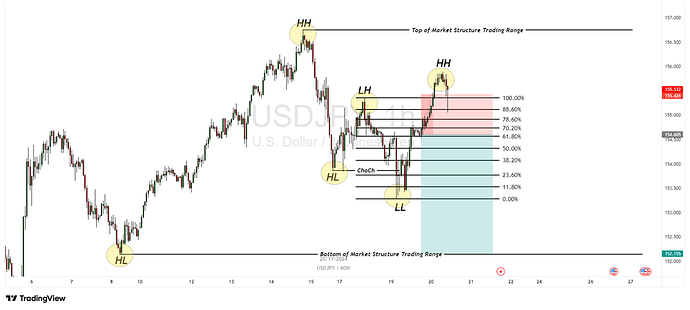
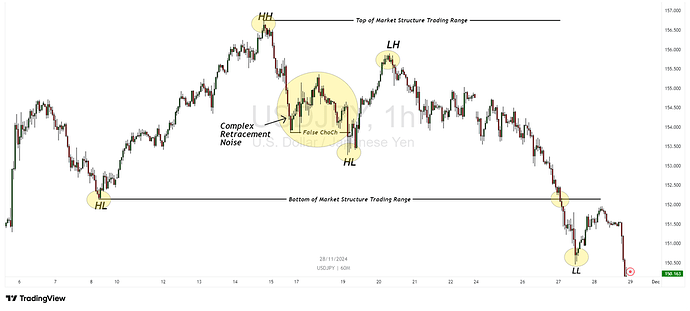
In this case study using USDJPY 1 Hour, we see this scenario play out with what could be mistaken as a ChoCh, but is actually a complex retracement.


This is how Market Structure may be read by traders that don’t dive deep into the understanding of Market Structure, particularly the importance of the Market Structure Trading Range. This is when the analysis of Market Structure goes wrong.

By focusing on the internal structure, the trader is ignoring the important external structural points.

To consider a Change of Character on internal structure as change of the trend is the trap of the complex retracement.

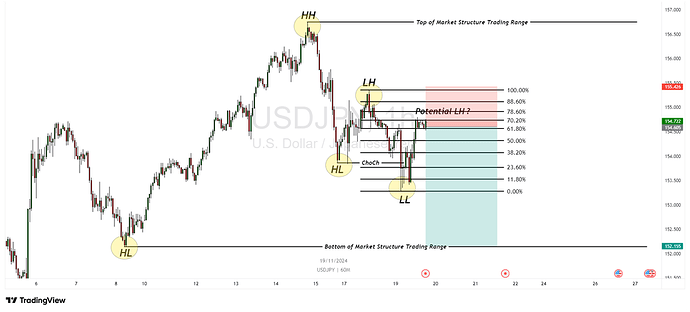
A trader could potentially enter a short position based on this incorrect analysis, as shown below:

On the surface this appears to make sense, because you have a violated Higher Low (ChoCh level), followed by a Lower High, then followed by another Lower Low, and price appears to be forming another Lower High.

This technically defines a downtrend, and it is a downtrend on a lower time frame. However it ignores the Market Structure Trading Range in coming to that determination.

This analysis error completes the trap that many traders unknowingly step into.

And with that another trade is lost to the complex retracement.

The invalid swing points are marked here but are removed, from left to right the reasoning is listed below:

Invalid HL (ChoCh level) : Valid Higher Lows create Higher Highs but this Higher Low created a Lower High and will become a targeted level for retest or reversal.

Invalid LH : This Lower High originated from an invalid Higher Low. Highs and Lows alternate so we can’t have 2 consecutive highs without being separated by a low and the Invalid Higher Low doesn’t qualify.

Let’s walk through the internal Market Structure and identify which structural swing points are valid for consideration and which structural swing points are invalid and should be ignored based on the Market Structure Trading Range and our Market Structure rules.

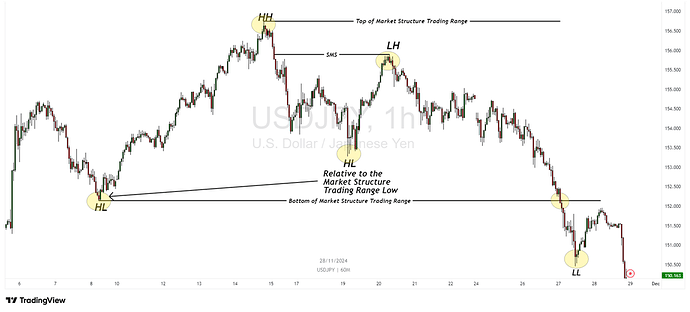
The internal Higher High is actually a Lower High when compared against the Market Structure Trading Range High (the High that matters).

The second internal Lower Low that was identified is actually a Higher Low when compared against the Market Structure Trading Range Low (the Low that matters).

This relevant structure actually creates a Shift of Market Structure (SMS) prior to the ChoCh reversal of the Market Structure Trading Range. Recall the 6th Market Structure Rule of Uptrends: Higher Lows that fail to make Higher Highs become weak support and a targeted level for retest or reversal.

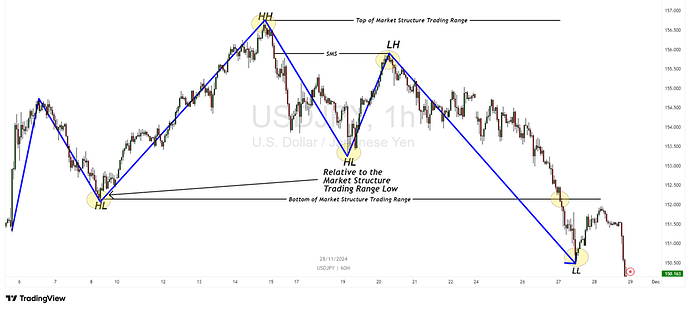
Once we have properly identified valid structural points, we can ignore the noise and see the true structure of the market, as outlined with a zig zag.

Note that a Change of Character (reversal) is only confirmed when the external Market Structure Trading Range Low is violated.

It is not a reversal of the external Market Structure Trading Range trend if the ChoCh only occurs on the internal Market Structure.

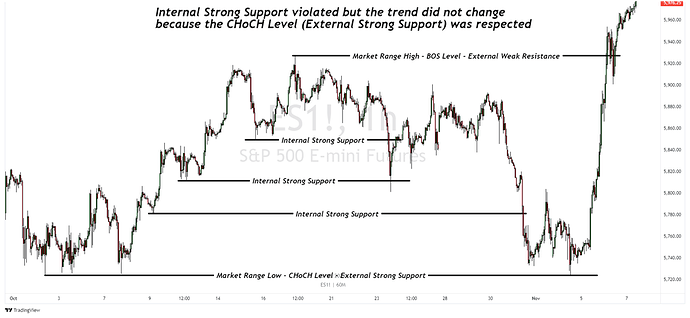
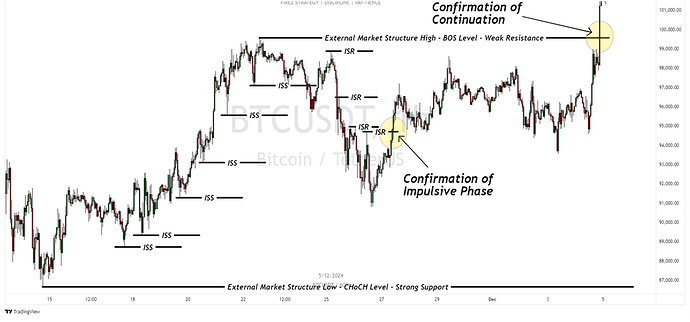
The high and low of the Market Structure Trading Range are made of a BOS Level and a ChoCh Level.
The BOS Level is a continuation level when broken and the ChoCh level is a reversal level when broken.

Any structure that forms between these levels cannot be used to validate a continuation or a reversal of the external Market Structure Trading Range, because it is internal to the Market Structure Trading Range.

As mentioned before price can do whatever it wants while retracing and as long as it does not violate the Market Structure Trading Range ChoCh Level, the trend will still be intact.

Moral of the story is that the Market Structure Trading Range is your compass.

I hope that you’re still with me. We’re just getting warmed up.

5 Likes

Ranging Conditions

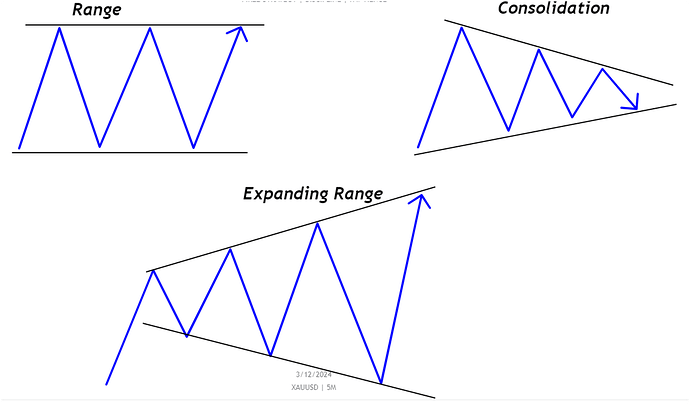
Ranging and Consolidation are often used interchangeably as a blanket term for sideways markets. There are differences between the two that should be explained. A consolidation is a form of a ranging market condition but not all ranging market conditions are consolidation, much like all dogs are animals, but not all animals are dogs.

Ranges represent a pause in the market where a clear direction is not readily apparent. Ranges can lead to continuations or reversals dependent on the direction of the break out or break down and based on the Market Structure Trading Range that contains the ranging condition. It is advisable to always look left to find the boundaries of the Market Structure Trading Range that contains the ranging condition. Tip: You may want to read the previous sentence one more time.

Regardless of the variation of the ranging condition, a breakout will eventually occur because the market cannot function if price does not cycle through the states of accumulation, mark up, distribution, and mark down.

These are some variations of the Ranging conditions that you will likely encounter in the market.

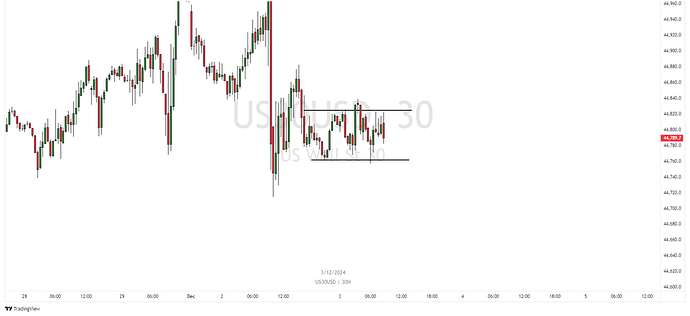
Ranging

The classic range is defined as price trading between well defined levels of support and resistance and creating relatively equal lows and relatively equal highs.

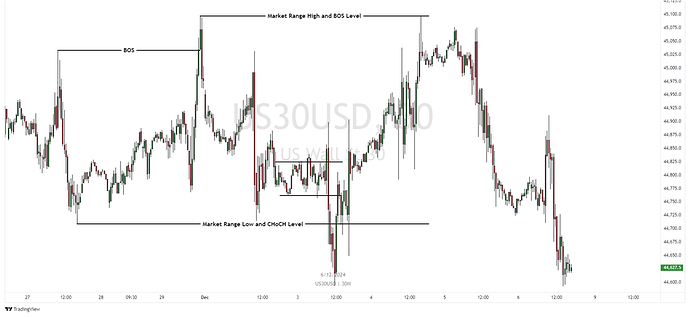
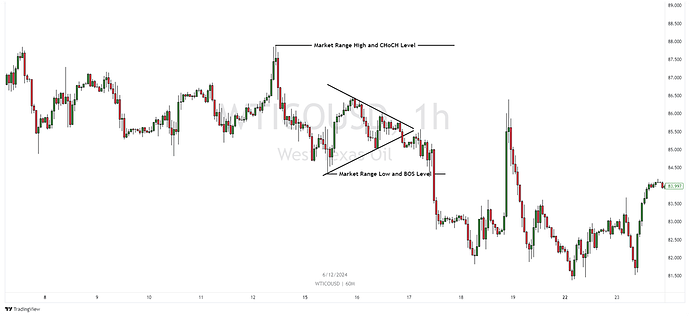
If we attempted to trade the breakout of the ranging condition, we would likely lose whether we went long or short, but if we waited for either a BOS or a ChoCh out of the Market Structure Trading Range, we would be able to short with our stop loss above what was originally the BOS Level or Market Structure Trading Range High.

In this illustration, the bullish BOS is actually a False BOS as price failed to sustain a breakout to create a new Market Structure Trading Range and then breached the Market Structure Trading Range Low and ChoCh level for a reversal. Once this occurred the high of the new Market Structure Trading Range (labeled here as Market Range High and BOS Level) becomes the new ChoCh level and a protected high (strong resistance).

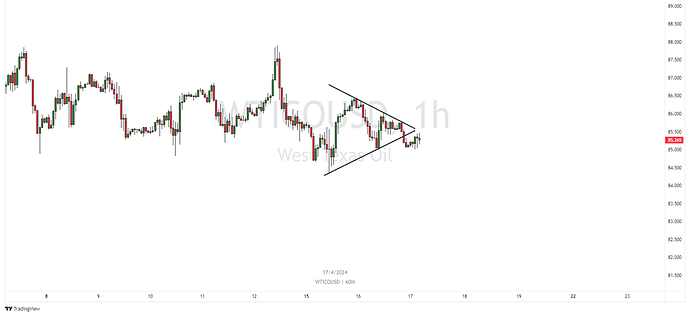
Consolidation

Consolidation is a range condition where price converges or consolidates into a progressively smaller trading range, by creating Higher Lows and Lower Highs.


When analyzed based within the context of the Market Structure Trading Range, this normally bilateral pattern makes more sense as a continuation pattern.

Expanding Range

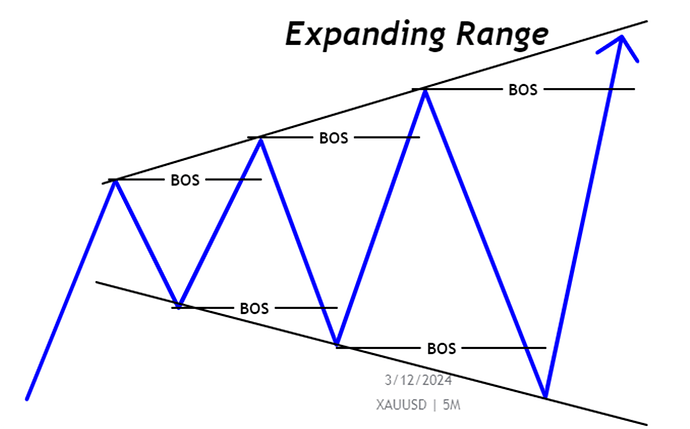
The Expanding Range is a range condition where price diverges into a progressively larger trading range, by creating both Lower Lows and Higher Highs.

The expanding range can be problematic to trade because it defies convention by continuously breaking out in both directions.

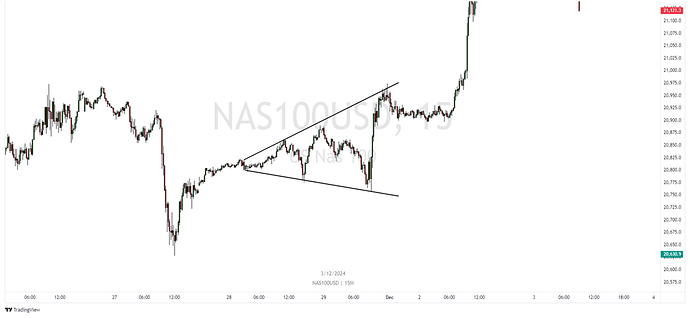
Looking at the example below of an Expanding Range that had a breakout. Were there any hints to which direction the breakout was likely to happen?

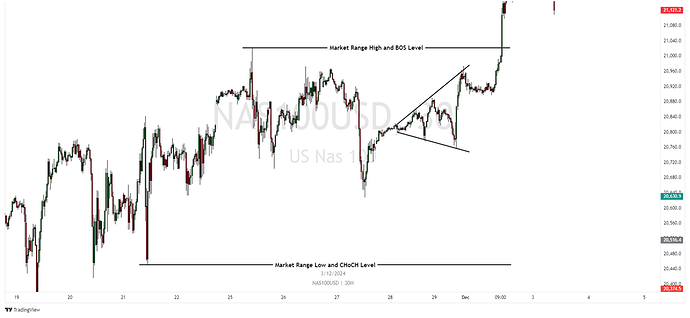
Ranging Conditions (including Expanding Ranges & Consolidation) should be analyzed from the left to identify if the ranging condition is internal to a valid Market Structure Trading Range as shown below.


If you look at this NAS100 chart, you can see that it’s actually a complex retracement prior to the expanding range.

Using a higher time frame can give a better perspective of the Market Structure Trading Range.

When the ranging condition is not internal to a Market Structure Trading Range and can’t be attributed as complex retracement noise, the best course of action is to wait for a substantial breakout so that direction is determined and a new Market Structure Trading Range is formed.

3 Likes

Strong and Weak Highs and Lows

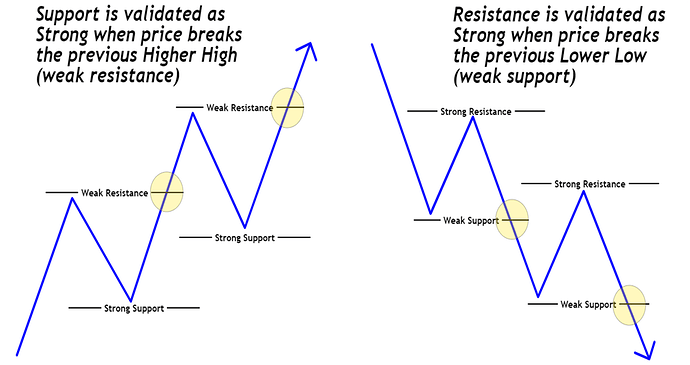
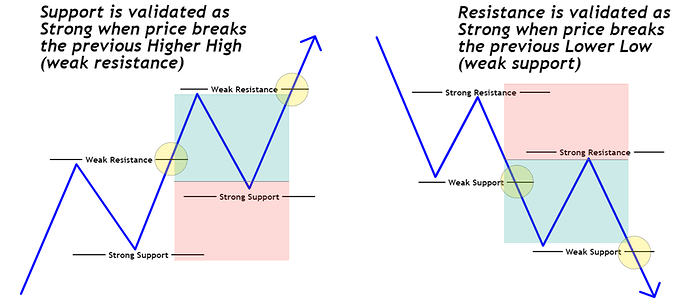
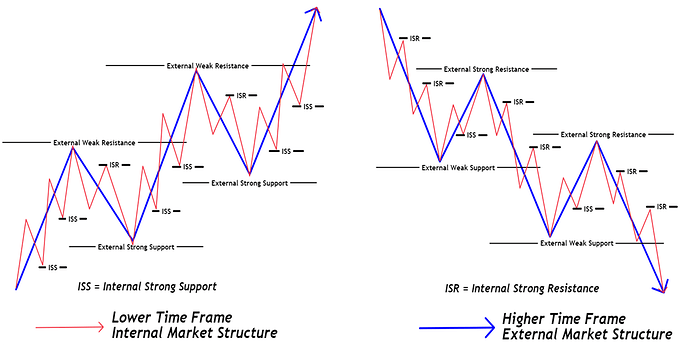
The Market Structure Trading Range will have a strong side and a weak side located at the ChoCh and BOS levels.

The exception to this rule is the ranging condition where both sides are equally strong while price is ranging.

In an uptrend the Market Structure Trading Range low or ChoCh level is considered strong support and the Market Structure Trading Range high or BOS level is considered weak resistance.

It is the opposite for downtrends, where the Market Structure Trading Range high or ChoCh level is strong resistance and the Market Structure Trading Range low or BOS level is weak support.

For a trend to continue, the BOS level (weak support or weak resistance) must continue to be violated and the ChoCh level (strong support or strong resistance) must continue to be respected.

Failure of price to violate the weak side (BOS level) of the Market Structure Trading Range (which would qualify as a Shift of Market Structure) is an early warning of a potential change of the trend but the trend change is not confirmed until the strong side (ChoCh level) is violated.

Strong Support or Strong Resistance at the ChoCh level based on the current Market Structure Trading Range are ideal for placing stop loss orders. Strong Support in an uptrend can be considered a protected swing low and Strong Resistance in a downtrend can be considered a protected swing high.

Internal structure of a complex retracement is not ideal for stop losses and often becomes liquidated prior to the continuation.

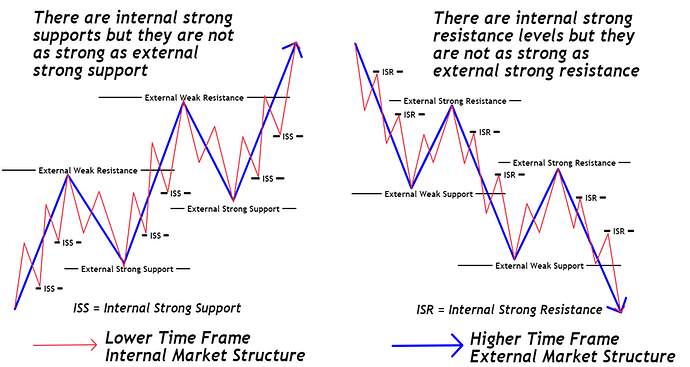
Internal Market Structure levels are not protected levels for the external Market Structure Trading Range and should not be considered as a ChoCh level for the external Market Structure Trading Range (as discussed in Complex Retracements).

There may be protected levels for internal Market Structure Trading Range but any internal protected level will be inherently weaker than the external protected level.

If that just confused you, take a look at the following diagram for a visual of this concept.

This concept of internal structure and external structure leads us to the next topic of Retracements versus Reversals.

4 Likes

Retracements and Reversals

There’s a thin line between a retracement and a reversal and that thin line is the Choch level.

A retracement is a short term reversal that does not violate the ChoCh level of the External Market Structure Trading Range.

A reversal of the Market Structure Trading Range’s trend will violate the External Market Structure Trading Range ChoCh level.

Now wasn’t that easy enough? But wait there’s more…

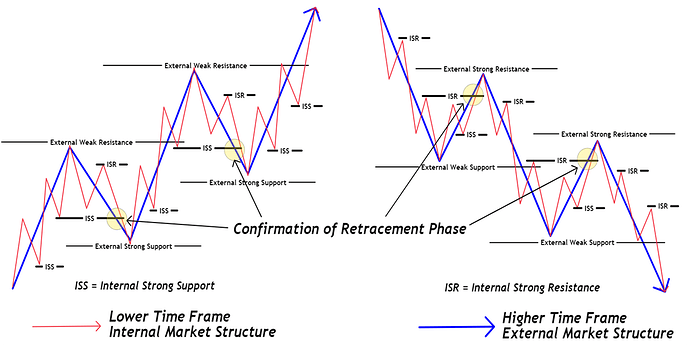
Let’s take a second look at the illustration of internal strong support/resistance and external strong support/resistance again but this time pay attention to those internal and external levels through the scope of retracement versus reversal.


Do you see it now? If not, don’t worry I’ll try to clear it up with an easy Rule of Thumb.

Retracement & Reversal Rule of Thumb

In an uptrend: When price violates an internal strong support consider the External Market Structure Trading Range to be retracing. If price violates the Market Structure Trading Range Low (ChoCh level and External Strong Support) consider the Market Structure Trading Range trend to have reversed.

In a downtrend: When price violates an internal strong resistance consider the External Market Structure Trading Range to be retracing. If price violates the Market Structure Trading Range High (ChoCh level and External Strong Resistance) consider the Market Structure Trading Range trend to have reversed.

You may recognize this pattern as a Change of Character on the internal Market Structure, and it is just that. The internal structure must have a Change of Character to facilitate the retracement, and the external Market Structure Trading Range must have a Change of Character to facilitate a reversal of the trend.


The retracement obviously starts before there is confirmation but you know that you have entered the retracement phase once internal strong support or internal strong resistance has been violated (aka internal ChoCh).

Great! So we have a definitive way to determine if price is retracing or potentially reversing, but how do we know when price has completed the retracement and is now resuming the impulsive phase (assuming that there was not a reversal)?

The answer is the inverse of the method for determining that we entered the retracement phase for the Market Structure Trading Range.

3 Likes

Resuming The Impulsive Wave Phase

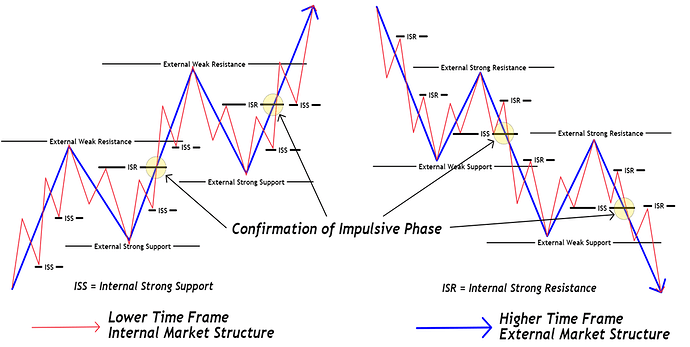
Impulsive Phase Resumption Rule of Thumb

In an uptrend, the impulsive phase can be considered to have resumed if the following conditions are met:

  • There is not a violation of the Market Structure Trading Range Low (ChoCh level and External Strong Support)
  • Price has violated internal Strong Resistance

In a downtrend, the impulsive phase can be considered to have resumed if the following conditions are met:

  • There is not a violation of the Market Structure Trading Range High (ChoCh level and External Strong Resistance)
  • Price has violated internal Strong Support.

As with the initiation of the retracement phase, this is a Change of Character on the internal Market Structure that facilitates the resumption of the Impulsive phase.

There still must be a Break of Structure on the external Market Structure Trading Range to confirm the continuation of the trend after the Impulsive phase resumes.

If you’re still here, Awesome!!! Don’t worry we’re getting close to the end. I hope it was worth it up to this point.

5 Likes

Stochastic for Identifying True Highs and Lows

This little hack is something I used much earlier in my journey for filtering out the noise on the charts. This is especially for those that struggle with validating highs and lows as meaningful Market Structure versus market noise. This method is not as good as validating a high or low and filtering out market noise based on the 6 Market Structure Rules presented earlier in this thread, but it can bridge the gap until you feel confident enough in your analysis to validate structure and filter out market noise yourself.

You’ll need Stochastic or Stochastic RSI for this, I use Stochastic RSI but either will work the same. The concept may also work with RSI or MACD but I haven’t tested the efficacy of those.

Identifying True Highs and Lows

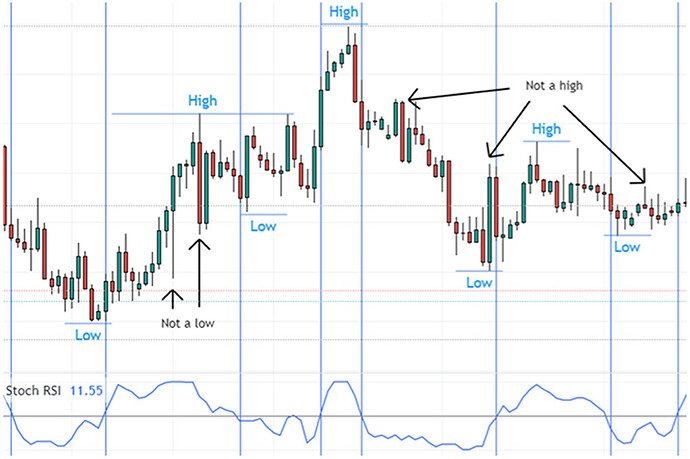
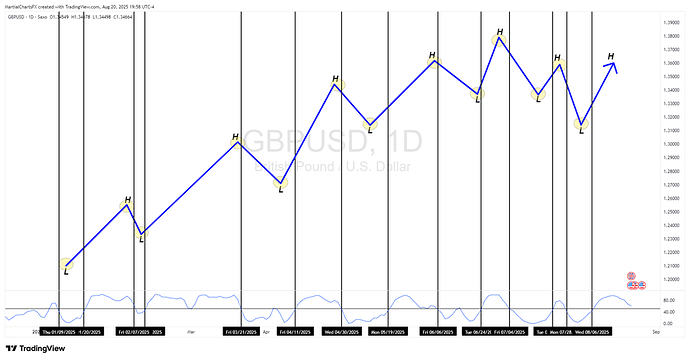
In order to map Market Structure and identify a Break of Structure, Shift of Market Structure, or a Change of Character, the true highs and lows must be properly identified. Using Stochastic can show which highs and lows are the true Market Structure points. This is not validation of a high or a low, this only identifies that a high is actually a high and that a low is actually a low (please do not confuse this point). We are only getting rid of the noise to make it easier to apply the Market Structure Rules.

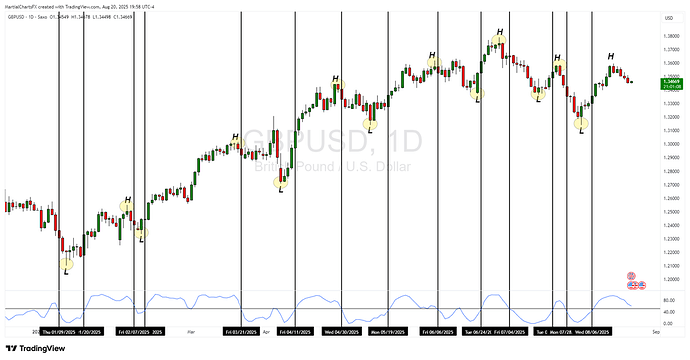
Use the default settings on Stochastic or Stochastic RSI with only the %K line showing and a horizontal line at 50 instead of the normal 80 and 20 lines. Vertical lines may be placed where the %K line crosses 50 to section Stochastic RSI into areas above and below 50. Each section will have either the true high or true low, not both. True highs and lows alternate so there should not be consecutive high sections without being separated by a low section or consecutive low sections without being separated by a high section.

Values above 50 are considered a true high and values below 50 are considered a true low. The highest price within a section of Stochastic RSI above 50 is the true high and any lows within this section should be ignored. Likewise the lowest price within a section of Stochastic RSI below 50 is a true low and any highs within this section should be ignored. Questionable highs and lows, particularly with values between 49 and 51, should be evaluated against the high or low status of the previous section since highs and lows alternate. Questionable highs and lows should also be evaluated against the dominant high or low within the same section.

The use of vertical lines isn’t required but can be helpful. I would usually hover my cursor over a high or low and see if the value on Stochastic was above or below 50 for that swing point.

Mapping Market Structure To Filter Market Noise

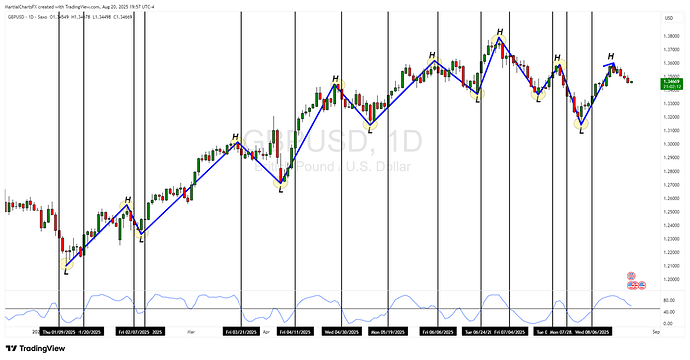
The path tool in TradingView can be used to map Market Structure using the true highs and lows found with Stochastic RSI. This aids in reading Market Structure correctly and can help bring clarity to choppy Market Structure better than using a line chart.

Mapping the true highs and lows using the Path tool

As we did in the case study, hiding the candles leaves you with textbook Market Structure.

Market Structure is King but it can’t assist us if we can’t see it clearly. You can use this technique whenever there is any confusion about the true story that Market Structure is trying to tell. Sometimes we must remove the noise in order to see the market’s true structure.

Next we have to discuss when the market doesn’t play by the rules of Market Structure.

4 Likes

Price Manipulation

By following Market Structure, you will have better chance of being on the right side of the market, but nothing is fool-proof or a guarantee.

Markets still have price manipulation that occasionally violates the rules of Market Structure.

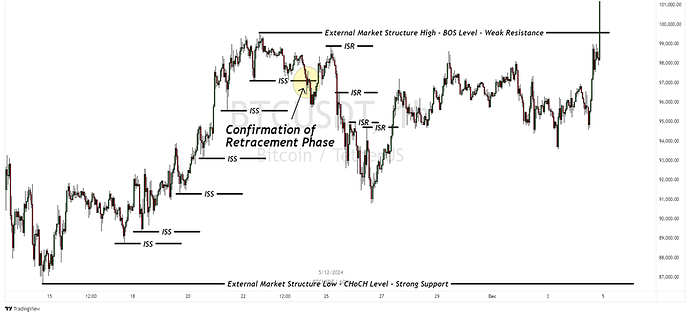
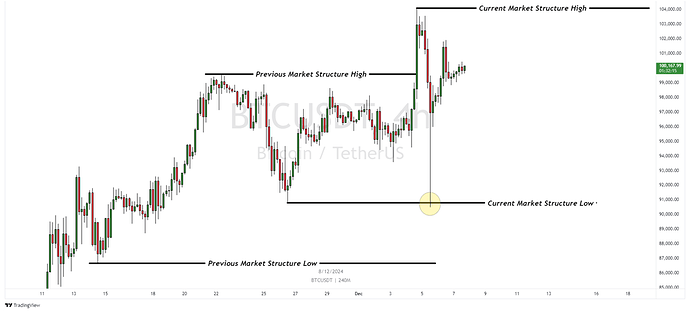
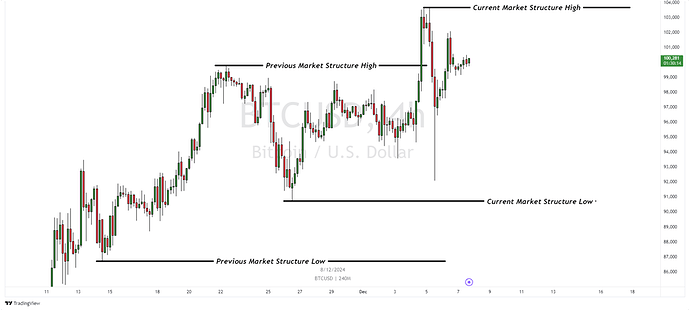
For example, on the next chart of BTCUSDT, there was a BOS above the previous Market Structure Trading Range High, so the current Market Structure Trading Range Low should be a Strong Support level and a Protected Low.

As you can see on the chart, the protected low was violated by a wick, which we can only assume was a run on liquidity beneath the strong low. This violates the nature of Market Structure and price manipulation could be suspected.

To no surprise, this price action did not occur on variants of BTCUSD from other brokers.

Price Manipulation in the markets is a real thing.

While strong support and strong resistance are usually protected levels, there will be occasions when they are violated.

Even with a protected level for your stop loss placement, you still need to give the protected level a little space for outlier events such as this price manipulation on BTCUSDT.

3 Likes

Summary

We’ve covered a lot but hopefully each concept built on the previous concept.

Most of this boils down to knowing the Market Structure Trading Range that you are operating in and using those boundaries to maintain your bearings in the market.

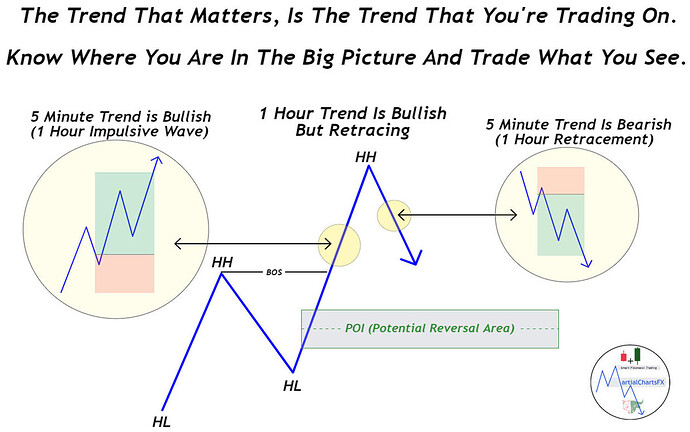
When you find yourself rapidly changing your directional bias, that is an indication that you need to back up and find were you are in the current Market Structure Trading Range and determine if price is in the impulsive phase or the retracement phase.

Let the image below be a constant reminder. Substitute “Market Structure Trading Range” in place of the word “Trend” and the concept is still relevant.

I hope that you all got some value out of this. I tried to make this beginner friendly but there still may be some parts that need additional clarification. If something was unclear to you, feel free to tag me with your questions here.

If I end up remembering something else that’s relevant to Market Structure, I’ll add it to this thread, but this should be all of it.

Thanks for spending your time reading all of this and thanks for allowing me to share my perspective on Market Structure with the Babypips Community.

cheers-true
Here’s to you for making it to the end! Cheers!!!

Martial Charts Out.

12 Likes

Thank you! You fulfilled it already, whether you promise it or not. :sunglasses:

8 Likes