The last time I analyzed this company (article can be found here), it was close to setting a low in wave ((2)) before moving higher in a wave ((3)). Before I get into the charts, lets check out the company profile:
“Matador Resources Company is an independent energy company engaged in the exploration, development, production and acquisition of oil and natural gas resources in the United States, with an emphasis on oil and natural gas shale and other unconventional plays. Our current operations are focused primarily on the oil and liquids-rich portion of the Wolfcamp and Bone Spring plays in the Delaware Basin in Southeast New Mexico and West Texas. We also operate in the Eagle Ford shale play in South Texas and the Haynesville shale and Cotton Valley plays in Northwest Louisiana.”
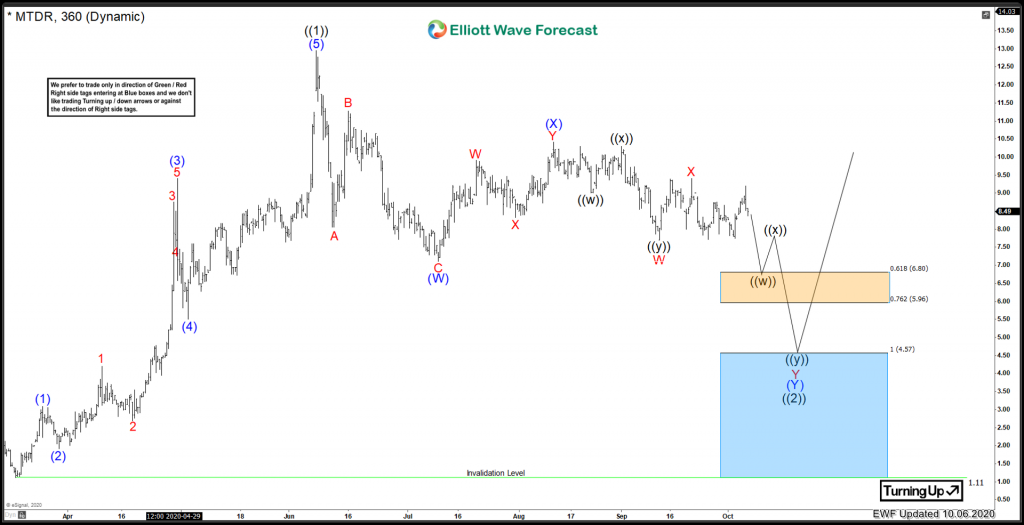
Technically speaking, I liked what I saw nearly a year ago, so how did things play out? Lets take a look at the previous Elliottwave view from 2020:
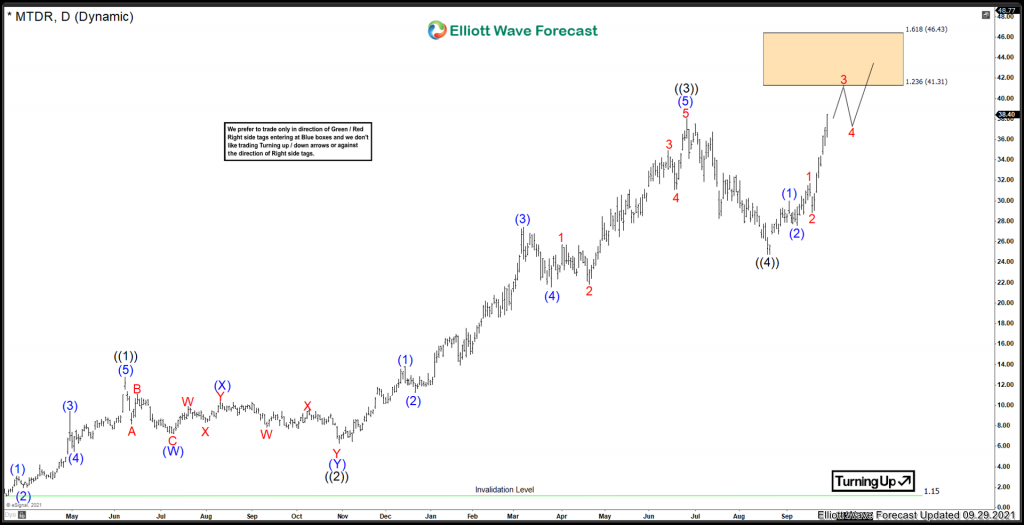
I had noted in the previous article, that the stock may bottom at the 0.618% extension area, instead of the blue box due to a variety of factors which you can read in my previous article. How did things turn out? Well lets take a look at the current view:
Matador Resources Elliottwave View:
Prices did indeed strike a low near the orange box area on the initial view. From there, prices have enjoyed a very nice wave ((3)) advance. From that low set in October 2020, the stock has shown a 5 waves impulse into ((3)). ((3)) peaked on June 25/2021 at 38.05. From there a pullback took place in ((4)) which bottomed at the August 19/2021 low. After that, it has rallied impulsively, and exceeded the ((3)) peak creating a new incomplete bullish sequence.
In conclusion. There are some 3s and 4s that need to be realized before this stock can peak. the 41.31 to 46.43 is the next area on the upside where another pullback can happen.

