Energy producers. It is a sector that has been in a strong bearish trend since the June peak. But there are some companies that have better structures than others. Matador Resources is one of those companies that have shown relative strength since the June Peak and continues to show promise. Today we are going to look at both the MTDR chart, and also the XLE ETF chart. There are a few scenarios that can take place for where MTDR can strike a low. Lets take a look at some charts.
Matador Resources Co Elliott wave View:
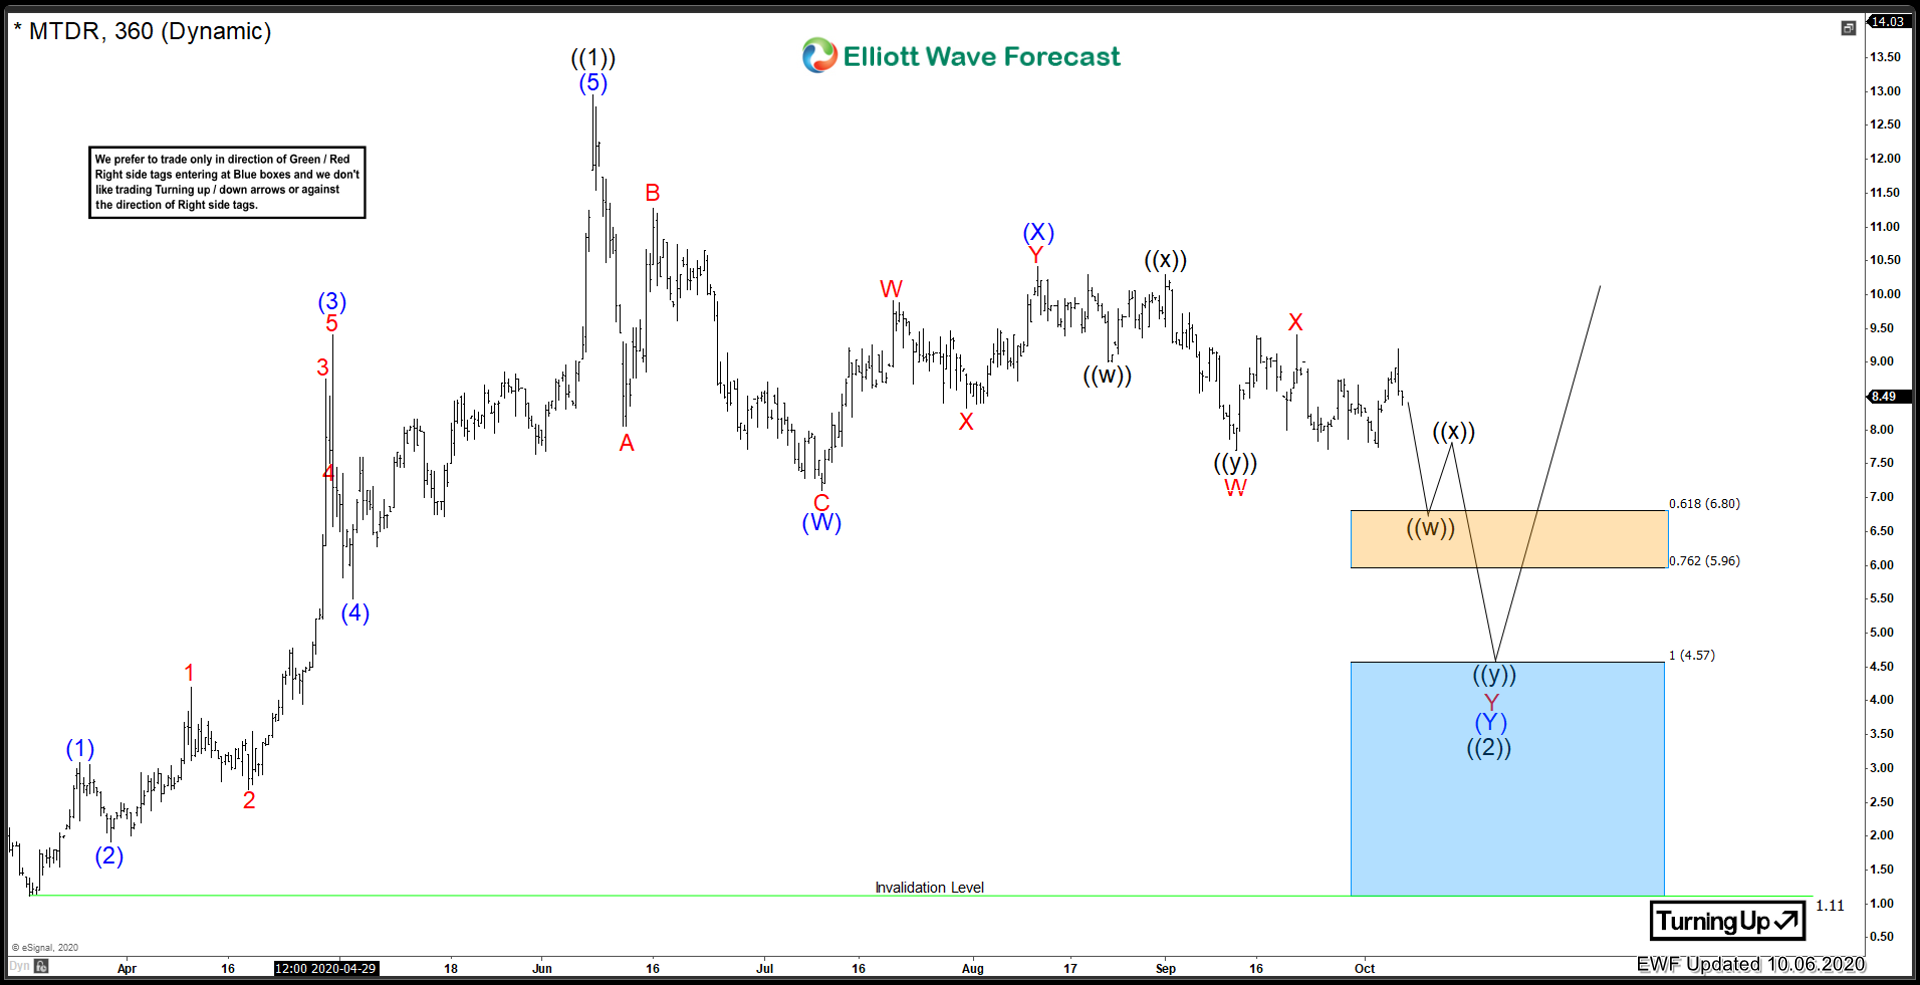
When comparing to the XLE chart below, we can see very clearly, that Matador has not yet broken the July Lows. XLE ETF has broken well below the lows and is on its way to reach the equal leg extreme blue box area. This shows relative strength with Matador vs the rest of the energy producer sector.
On the Matador chart, from the March 2020 low at 1.11, there is a 5 waves advance into black ((1)) which peaked at 12.95 on June 8/2020. That is a very impressive 1100% gain in the short span of a few months. From there, the swings are lining up well with the XLE Energy ETF shown below. Matador has an equal leg extreme blue box area of 4.57 to the invalidation level of 1.11. An area where buyers may show up for a bounce in 3 waves at least. But considering the relative strength of this name, it may strike a low when the XLE energy ETF hits its equal leg blue box. A lower low than the Blue (W) low of 7.10 is needed at minimum for Matador. But how deep MTDR can go will depend on when the broad energy sector produces a turn.
XLE Energy Producers ETF Elliott wave View:
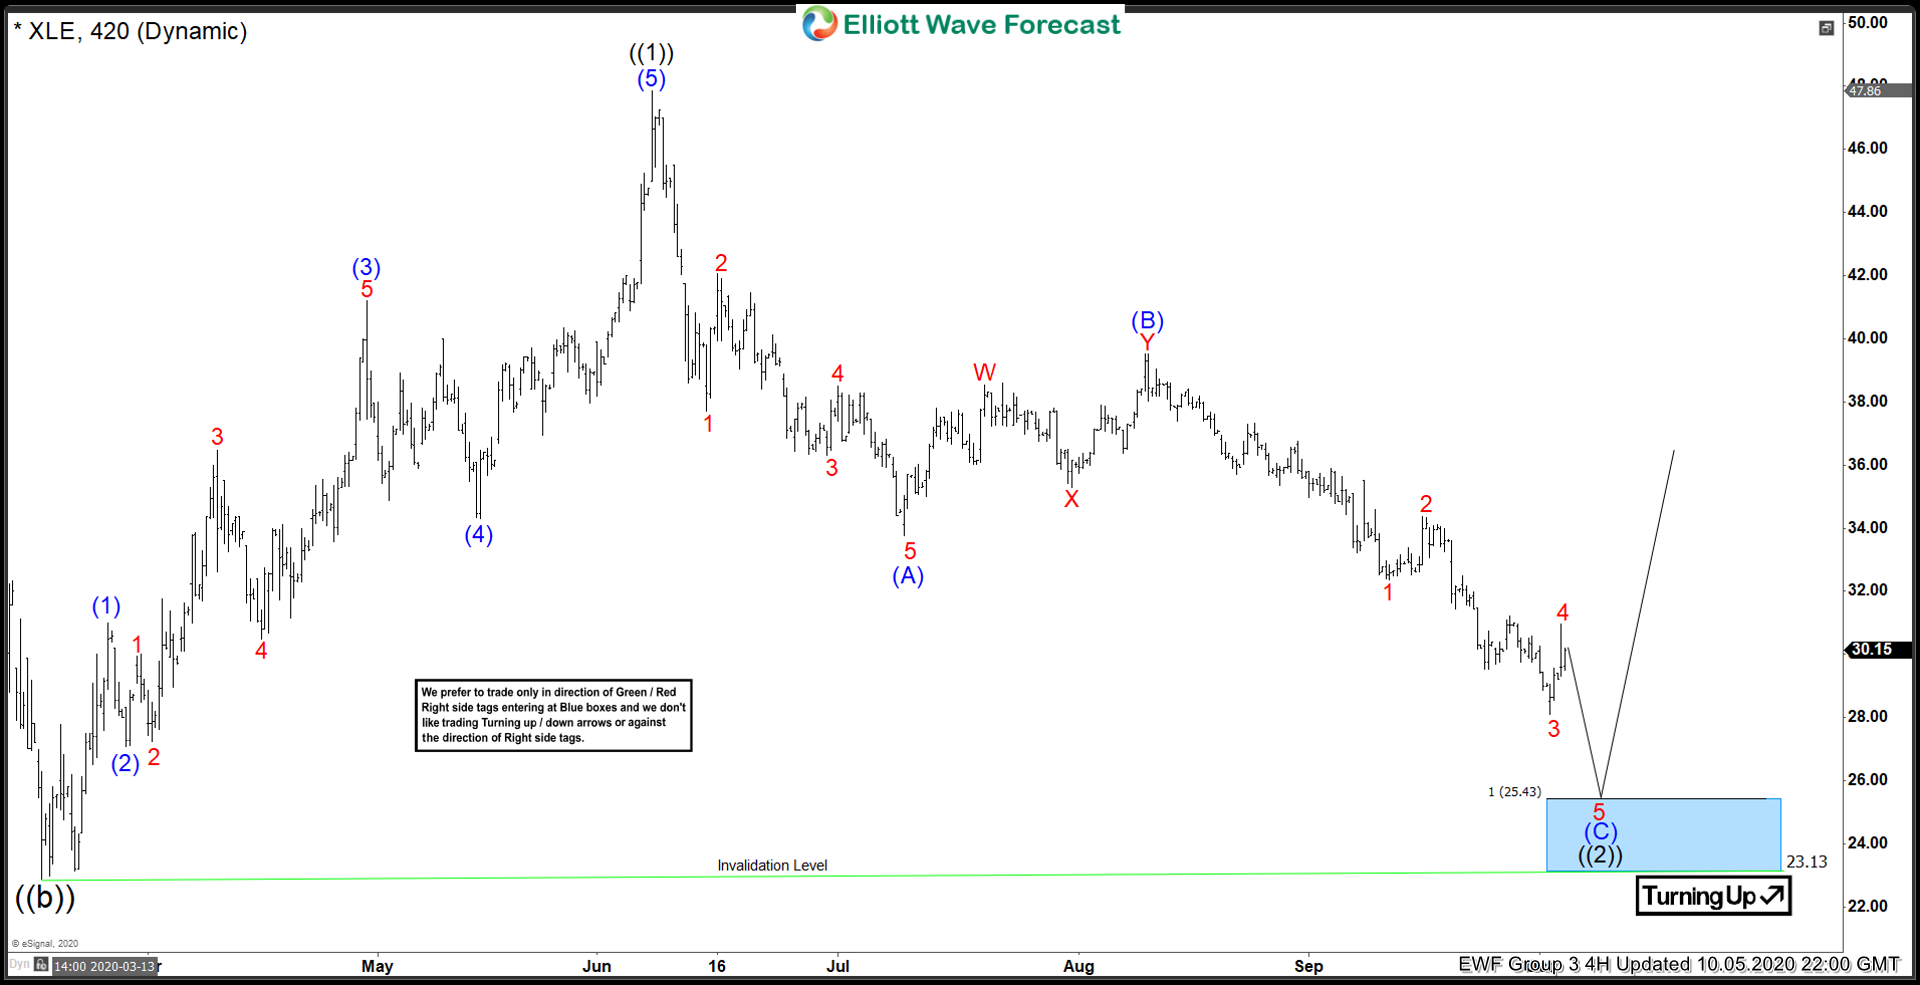
When looking at XLE ETF. We can see that an equal leg extreme 25.43 to invalidation level 23.13 is much closer than the blue box for MTDR. An area to watch for a broad turn in the Energy Producer complex is that blue box extreme on the XLE ETF. If XLE manages to get there, and MTDR gets to the orange box which is the 0.618 to 0.762 area, then MTDR may strike a low the same time as XLE. At this point, it all comes down to timing for when a turn may take place.
In Conclusion. Ideally, the MTDR price will get down to the blue box extreme the same time as the XLE hits the blue box. But watch for clues on how XLE reacts at that area, as for if MTDR can find a low at the 0.618 instead.