Gold 1D:
We finally made it through the 1760 area. Will we see 1840 this month?

These 2 have cooled off, we’re getting a little closer each week. There is a support zone I’ve marked out that needs to be broken, which might present a problem:
Gold 1D:
We finally made it through the 1760 area. Will we see 1840 this month?
These 2 have cooled off, we’re getting a little closer each week. There is a support zone I’ve marked out that needs to be broken, which might present a problem:
CHFJPY Monthly - I’m watching this pair for a long term drop. Price is a the top of this resistance level on the monthly chart and hasn’t closed above this level since Dec. 2015.
Zoom in to the 4H chart, my first target will be that demand zone (open position not shown):
Keep in mind, there’s always a good chance price will continue up, so I have my SL set above the high here.
USDCAD 4H:
Broke all sorts of zones last week, which ultimately stopped me out, then proceeded back toward my target. I’m staying out of this pair for now as price is too close to my demand zone, so will wait to see where it decides to go.
Oil 2H:
I was right on with this one. Went back in after confirmation of bounce off that demand area in between my 2 zones:
Not too much happening with Gold, but it’s steadily climbing to that 1840 mark:
Gotta love a sense of humour…I lost my confidence so I didn’t get back in this pair. This is a savage business…
“The Market” and “Mother Nature”.
There are so many factors that drive stock and currency (market) prices. Too many to comprehend. I like to look at “The Market” in a much broader sense, like “Mother Nature”.
Mother Nature, through many extreme factors creates its own balance.
The Market, through many extreme factors also creates it’s own balance.
I’m not going to start listing examples because the list could go on forever, but IMO these are both self driving entities beyond anyone’s control.
Let’s look at FX. I look at price as something that moves from point A to point B to point C, etc., typically moving up and down in a zig-zag pattern. Every zig-zag pattern on the monthly chart is made up of a zig-zag pattern on the weekly chart. This pattern continues right down to the 1 second chart.
The how or why is irrelevant to me. The important part is trying to find point A, B, C…
Let’s take a closer look at these patterns using AUDUSD as an example:
The blue SR lines on the monthly chart represent Point A, B, C…This is MY analysis and these lines are subjective and should be viewed as “zones”, but I only put them in the most visually obvious places to avoid over-crowding. I use these lines to predict where I think price is headed long term.
Since price moves in zig-zag patterns, it creates channels, which become more apparent on the weekly chart view:
Each SR line that outlines each channel is a clone of the other, the only thing I altered was the length of some of them. Creating these channels is impossible to do before they form, so you need to wait for partial formation using 2 or 3 swing lows/highs and go from there.
You can see how the current uptrend has formed; Price surges up then goes into a consolidation period before surging up again.
This chart is suggesting that this consolidation period is coming to an end and price is getting ready to surge again. The question is, will it surge up or down? Has it come close enough to hitting “Point B” (blue line) to bounce back down, or not?
That is for each of us to determine. Here’s a closer look at this channel on the daily chart:
Looking forward to another trading week. Keep your risk low and keep trading fun.
Matty
CADJPY - CAD has been on a tear, but this weekly chart is suggesting we might see some sideways action soon. This could also be a sign that JPY is strengthening:
Some books recommended to me by a financial advisor that plan to check out:
-The Year of Less, by Cait Flanders
-Freakonomics, by Steven D. Levitt and Stephen J. Dubner
-The Simple Path to Wealth, by JL Collins
-The Psychology of Money, by Morgan Housel
Together, these books will tell you everything you need to know about money, all in about a thousand pages.
Took advantage of the SPX500 dip this week with some nice entries using a textbook SD setup on the 4H chart:
I will close 2 units when price hits my supply zone, and hold on to the other 2.
I stayed out of Gold last week. Still hammering away at that 1840 supply zone. Price needs to break through here for some more upside. I’m looking at 1906 eventually:
EURAUD 4H - Might be good for a short this week:
But be careful with this pair because it’s showing signs of a reversal. Take a look at the Daily chart for example:
Price is forming higher lows, while hitting a ceiling just below 1.5700. Breaking through this ceiling might confirm the reversal.
Here’s a look at the Monthly chart, has this pair bottomed out?:
Will Copper be the new Oil?
“*Move over, oil. Copper will soon be the most important commodity in the world, says Nicholas Snowdon, commodities strategist in Goldman Sachs Research. *
*On an episode of the Exchanges at Goldman Sachs podcast, Snowdon argues that because it is “the most cost-effective conductive metal [for] capturing, storing [and] transporting electricity,” copper will be the key metal in the transition to a green economy. *
*He also estimates its price will soar from about $10,000 a ton today to about $15,000 by 2024. Why? Because the copper industry isn’t ready for the coming spike in demand. *
*“There’s no real investment in new mine projects and so, essentially, the copper market is sleepwalking into a really sizeable supply crunch akin to what we saw in the oil market back in the 2000s,” Snowdon says. *
*Ultimately, it will take “incredibly high” copper prices to encourage new investments. “Until there’s a really sharp increase in mine investment and capex goes back to the levels that we saw in the late 2000s—and we’re only about half of that currently—I think we’re a long way from declaring ‘mission accomplished.’ *
And so, I think that’s really the key message: Year one of a multiyear bull market really lies ahead of us.””
A nice read indeed! I have bookmarked this thread and will keep visiting it for more exciting information. It is nice that you tried to make use of indicators and I’m actually looking forward to seeing some progress here.
Looking at copper (see post above), I wish I had got on this months ago. Look at the weekly chart:
Back off to the 4H, I will be getting in long if this breaks up through that resistance, and with any luck, ride it up for many months.
However, it’s easy to ‘predict’ coppers’ rise AFTER it’s already happened. Had they posted that article a year ago it would be much more impressive.
Waiting for trends to resume, last week I found myself moving away from daily candles and down to 1 & 4H charts, looking at SR & SD zones.
AUDUSD 1H:
Also going to revisit this day trade/scalp strategy I was testing back in January here.
This pullback strategy takes advantage of the SW pairs that pull furthest away from that 20 MA (daily candles). The idea is to grab a few pips on the pullback.
I still have a lot of testing to do with this because I need to figure out how many pips to set my TP without getting greedy, and also where to put my SL. This is a once per day trade as once my TP is hit then there’s no going back in, so it needs to be a decent size position. Very risky strategy, but does have potential.
The pairs will mostly correspond with the typical SW pairs. Here’s Friday’s ranks:

According to these numbers I’ll be looking at going long NZDCHF and grabbing 10-15 pips:
I won’t be trading this strategy on Mondays because trades need to be made 1 hour after NY close, otherwise spreads will take me out immediately.
USDCAD:
Daily view…I know I’m not the only one looking at this:
But I highly doubt it will be that easy, USD has been strong this week.
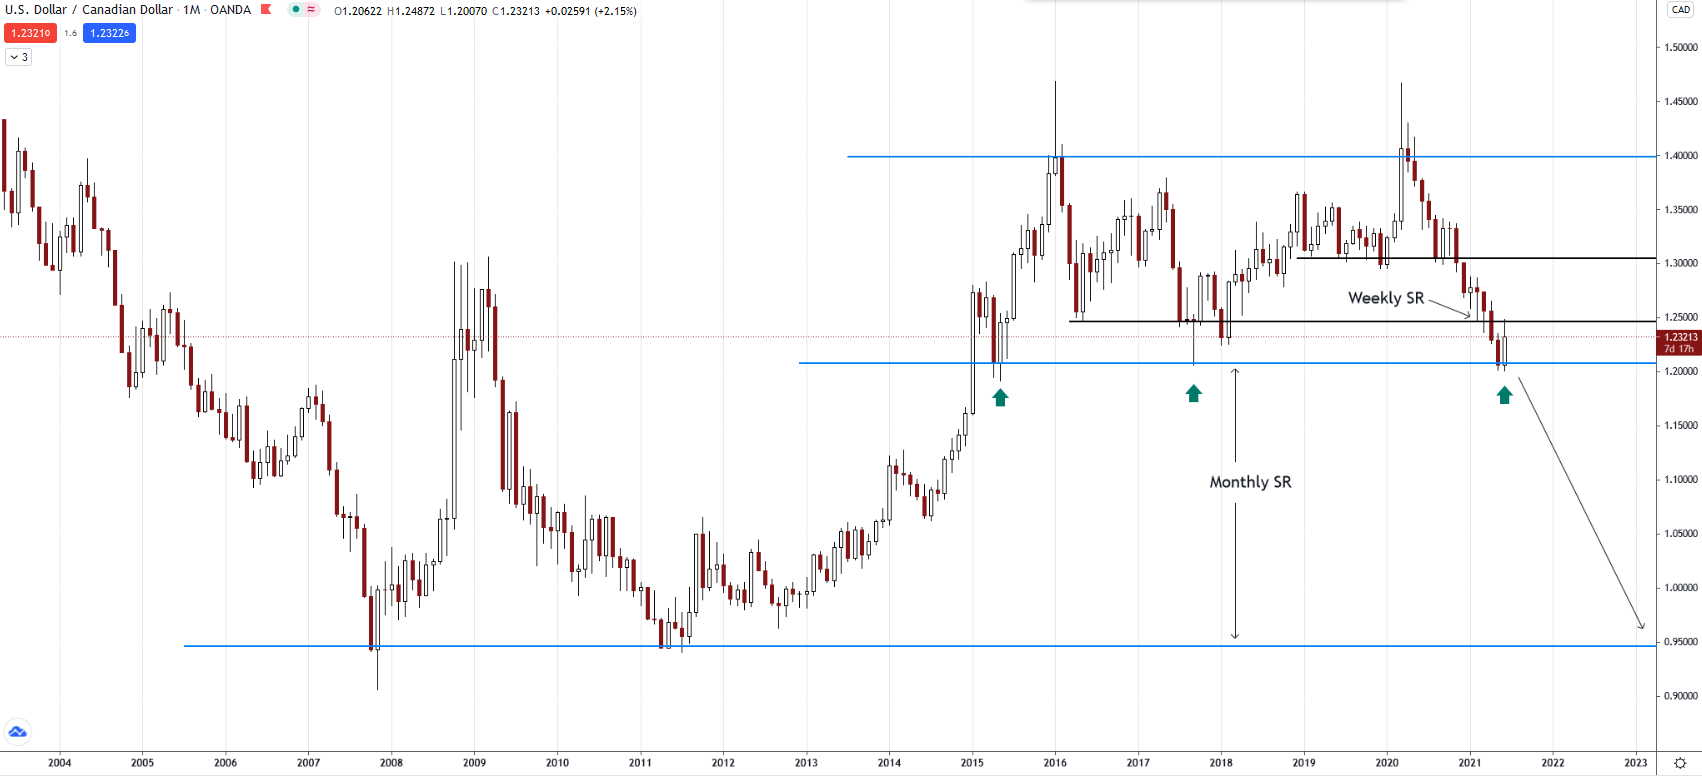
USDCAD Weekly - Things are getting interesting. Price hit a strong, monthly support area for the 3rd time in 6 years, and has now bounced off a weekly S turned R. Let’s see if that R holds:
This could be a good sign that price is headed down. Quite possible down to the next S area at 0.95. Here’s the monthly chart: