Price is currently sitting at a strong SR area so it could go either way. My hunch is that there is more downside first because the recent downtrend looks to be headed to the Daily/Monthly SR Area I have marked out along the bottom, if it didn’t already hit that area with the recent swing low, but I don’t think so.
Either way, my long finger is ready just in case!
CADJPY 1Month - I’m going out on a limb here to say that this pair bottomed out in May, based on my monthly SR analysis.
History vaguely shows that when price hits these monthly levels it tends to move away from them again. When price moves through them, it’s moving towards the next level. But not always, of course, as you can see with some of the big swings that reverse again. These levels are subjective, but this is what I see.
Here is my prediction on this pair over the next 18 months:
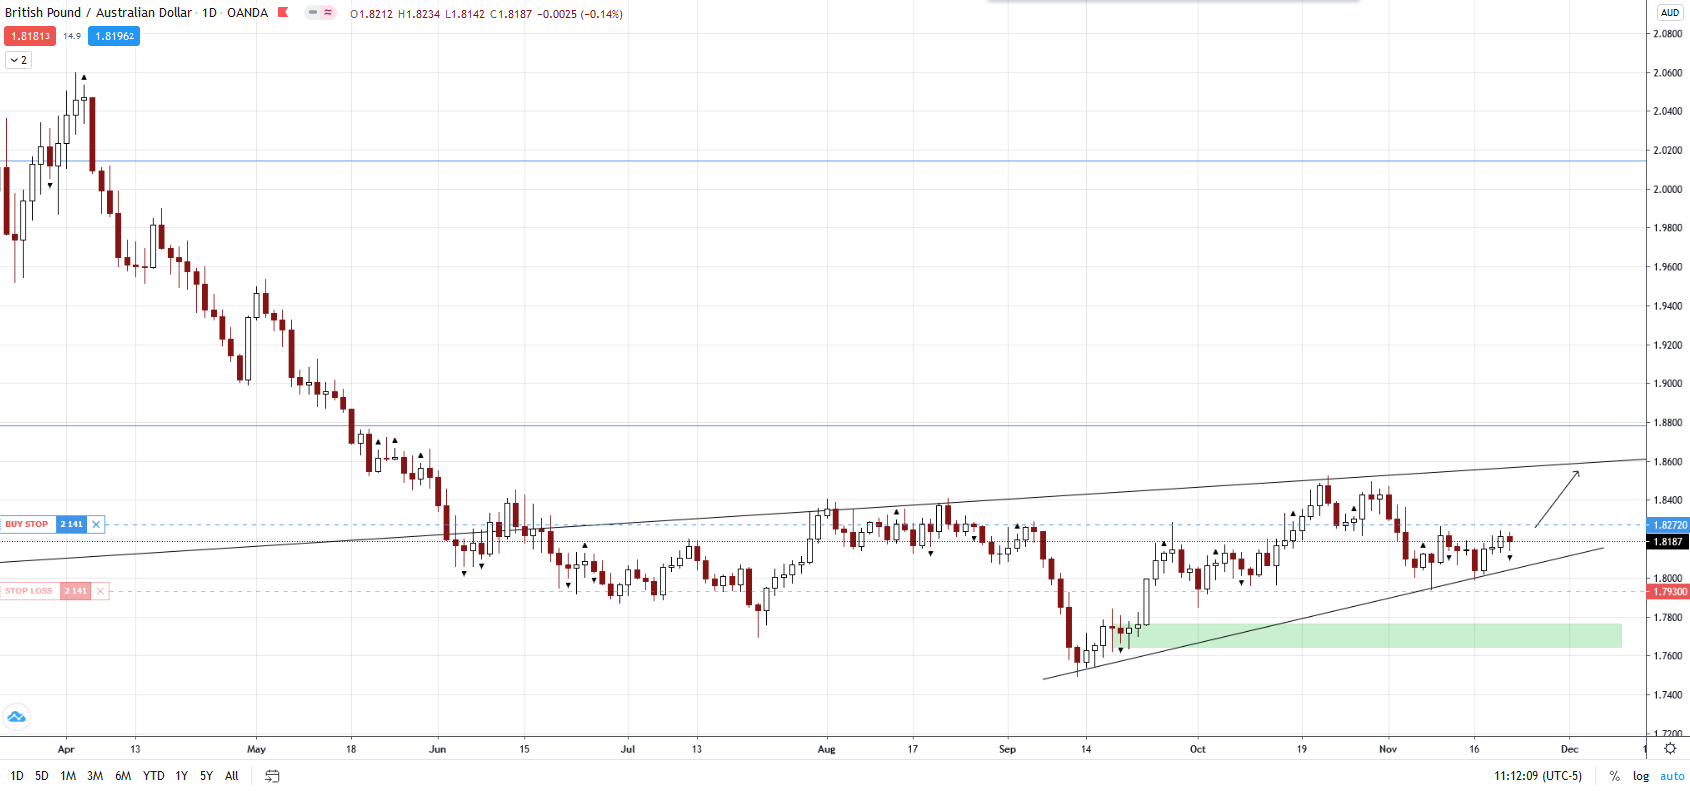
CADCHF 1D - We have been seeing a pattern of lower highs and higher lows for some time now. This pair should be getting ready to break out. Question is, up or down?
Breakout to the downside, which shouldn’t have surprised me as price still respected the low of Sept. 20th. I saw a good opportunity to go long here and my order was picked up:
Two mistakes here: 1) SL was too tight, I still believe these trades will work. 2) Went long based on someone else’s tip, despite my analysis, which I will take full responsibility for.
Stopped out. That’s the chance you take with the USD right now.
GBPCHF Daily - I’ve pretty much been sticking with an inside bar strategy the last couple of weeks, which is why I have been quiet, but I came across this setup and couldn’t resist:
Don’t go shorting yet though, NZD has been strong this week, and plenty of momentum today.
The weekly chart shows price broke resistance on this looooooong term channel. Could be a fake break though, so wait for confirmation over the next couple of days.
EURCAD 4H - This one got away from me. Price reached down just enough to grab my short order, then changed direction quickly.
However, I replaced my SL with a buy order (hedge position) and now have the position locked in at -$71.00, which was my risk. So, this ain’t over yet!
I have set a SL at break even on my hedge position, so I have some options now:
Hold and wait for price to come back down, triggering the SL closing my hedge position, then continue down (in a perfect world) to my OP (Original Position). This is the safest option.
Wait for price to reach my projected target, wait for confirmation of price retracement or reversal, then close my hedge with some profit and hope that price comes back down to my OP. This is risky because I am left with an open position potentially sitting at -$200.
Wait for price to reach my projected target, wait for confirmation of price retracement or reversal, close my hedge then scale a 2nd position in and hope that it comes back down. This is even riskier because then I’ve increased my risk significantly and also added to a losing position that at my target reversal point would already be about -$200.00. However, price would only need to come half way back to the OP to break even.
Tesla really hasn’t had much upside for a few weeks now, I bought 5 shares right at the last dip and have just held them.
I don’t trade stocks like forex, I like to hold them longer. The current PE ratio is inflated but doesn’t necessarily mean it’s overvalued. I believe now we’re going to see a big push towards climate change, which should be good for Tesla, and I think investors are expecting the same, which is reflected in their PE ratio.
I will hold until/if it hits my SL at break even, but I’m hoping it breaks out again and doesn’t decide to drop down to that support level around 345.
Could be some downside first though. I know that sounds like a typical, cover-your-ass approach, but there’s a method to my madness, and it’s important to consider all possibilities.
4H - Price has been in between 2 SR levels, and is currently at the top of this range. I’m waiting for price to break out of this range. I think the chart is pretty self explanatory: