McDonald’s (MCD) is the world’s largest fast food restaurant chain, serving over 69 million customers daily in over 100 countries in more than 40,000 outlets as of 2021. It is best known for its hamburgers, cheeseburgers and french fries, although their menu also includes other items like chicken, fish, fruit, and salads.
McDonald’s MCD Weekly Chart April 2023
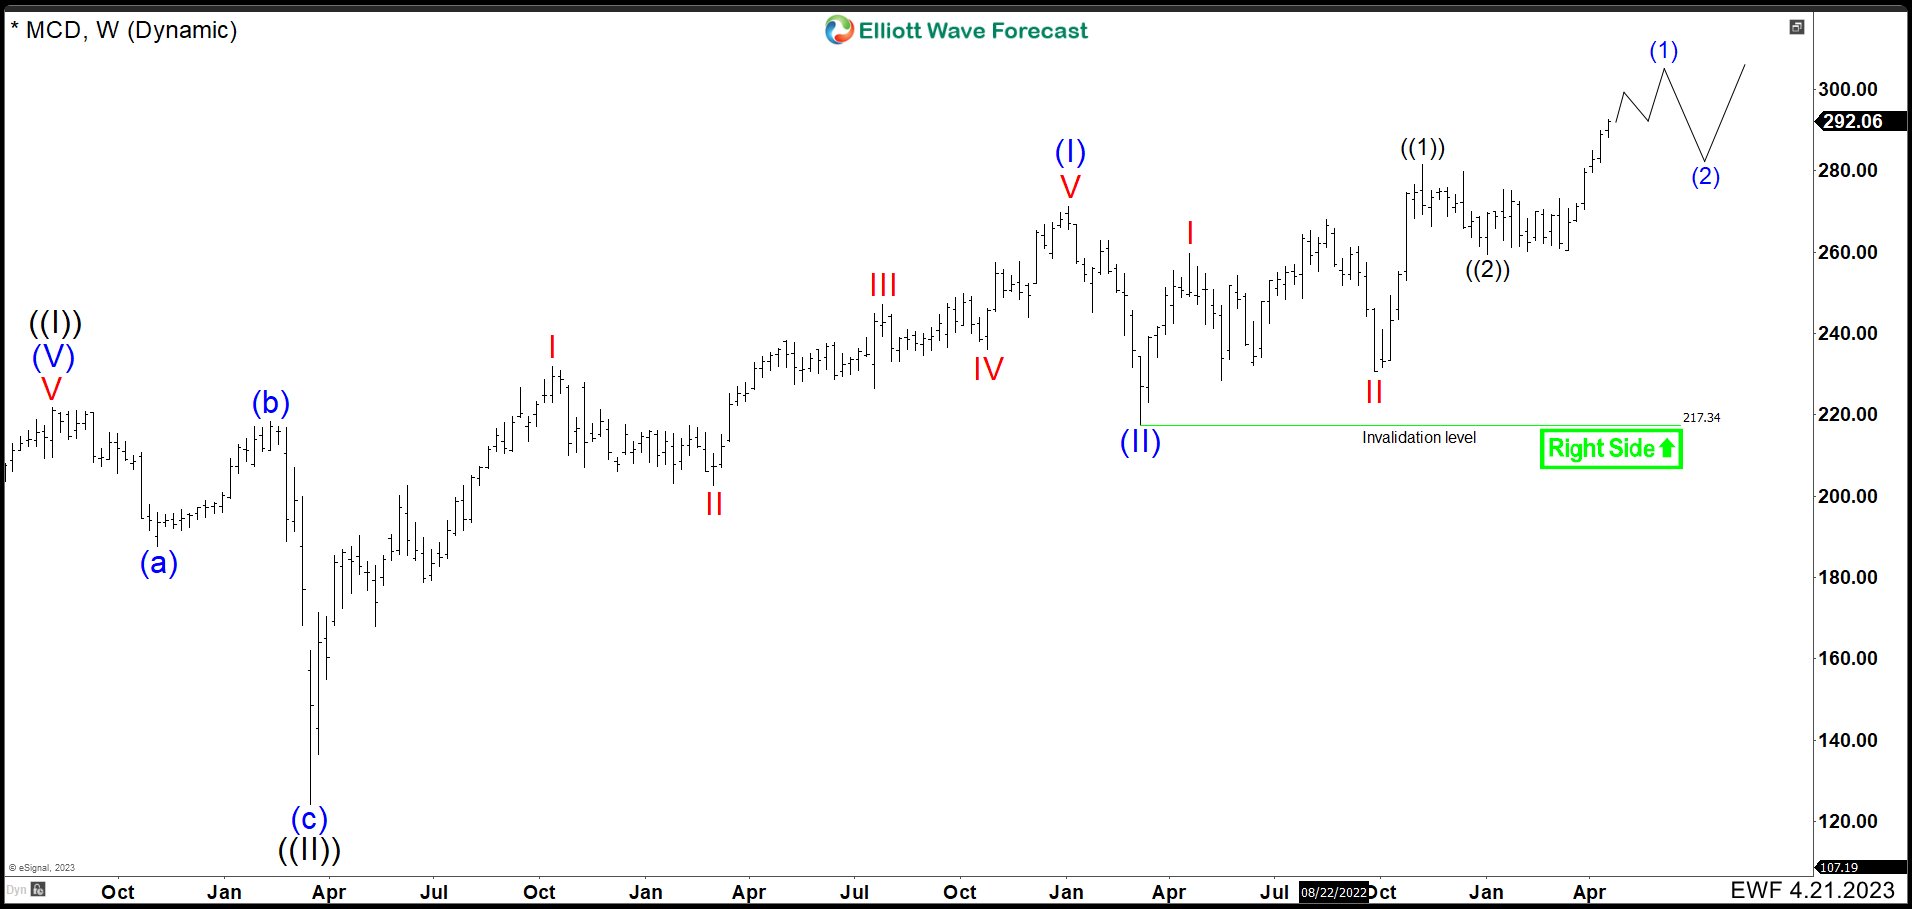
In the weekly chart we can clearly see the retracement of the entire wave ((I)). The correction took on a flat Elliott Wave structure. Wave (a) ended at $187.55, the corrective bounce reached $218.38 completing wave (b). The drop in form of an impulse occurred at the beginning of the COVID19 pandemic. Wave (c) ended at $124.23 and so did wave ((II)) in a fast pullback with losses above 43% in March 2020. Since that date, MCD held a bullish price action reaching almost at $300 dollars per share. Last April, we were expecting to continue with a nest higher to finish a wave (1) before entered in a wave (2) correction.
McDonald’s MCD Weekly Chart September 2023
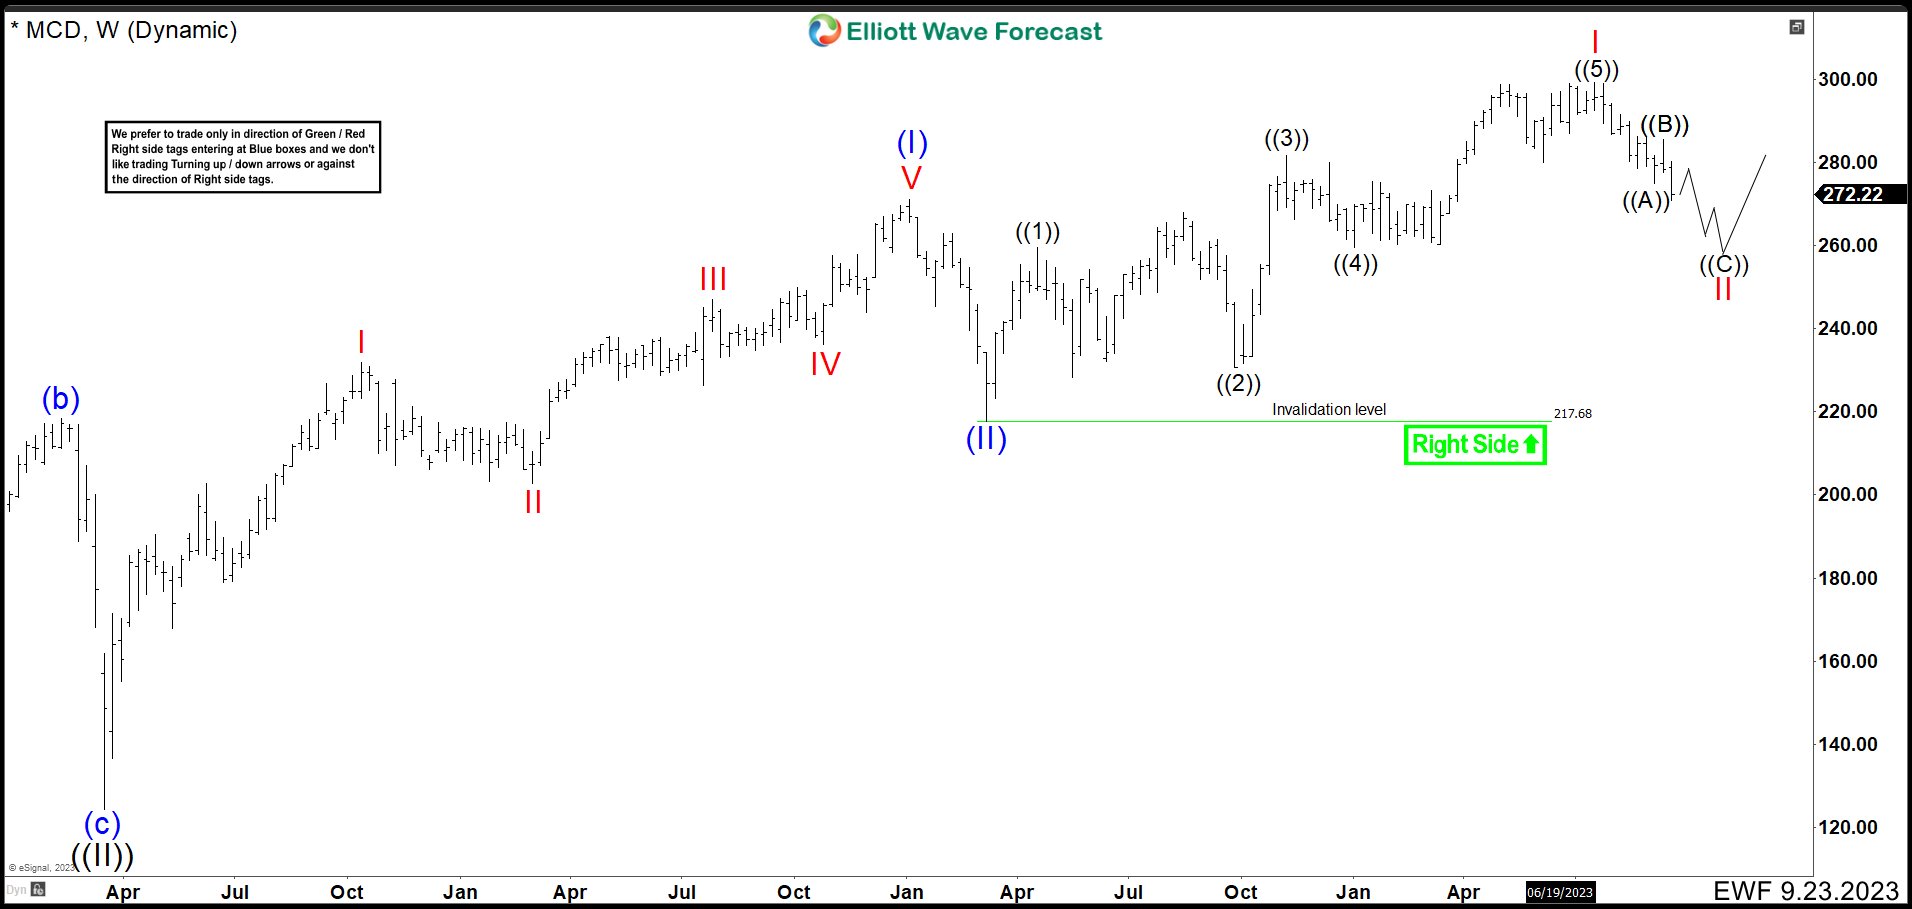
Currently, given that correction looks like a little more deep than expected, we adjusted the count and erased the triple nest for one leading diagonal. Up from wave (II) at $217.68, MCD ended wave ((1)) at $259.61 high. Wave ((2)) pullback made a running flat correction ending at $230.58. Then the market rally in wave ((3)) completing in $281.67 and retracement as wave ((4)) at $259.51. Last leg higher wave ((5)) to finish the leading diagonal as wave I ended at $299.35.
Down from wave I, wave II correction started showing a possible zig zag structure. Wave ((A)) ended at $275.00 and bounce as Wave ((B)) was rejected lower at $285.60 in wave ((C)). This wave should continue lower building an impulse structure that could end in $260.99 - $245.82 zone. Once price action reaches this area, we should expect a reaction higher to think that wave ((C)) of II has ended and resume the rally toward above $300.00. The view is valid as market remains above $217.68 low.
McDonald’s MCD Alternative Weekly Chart September 2023
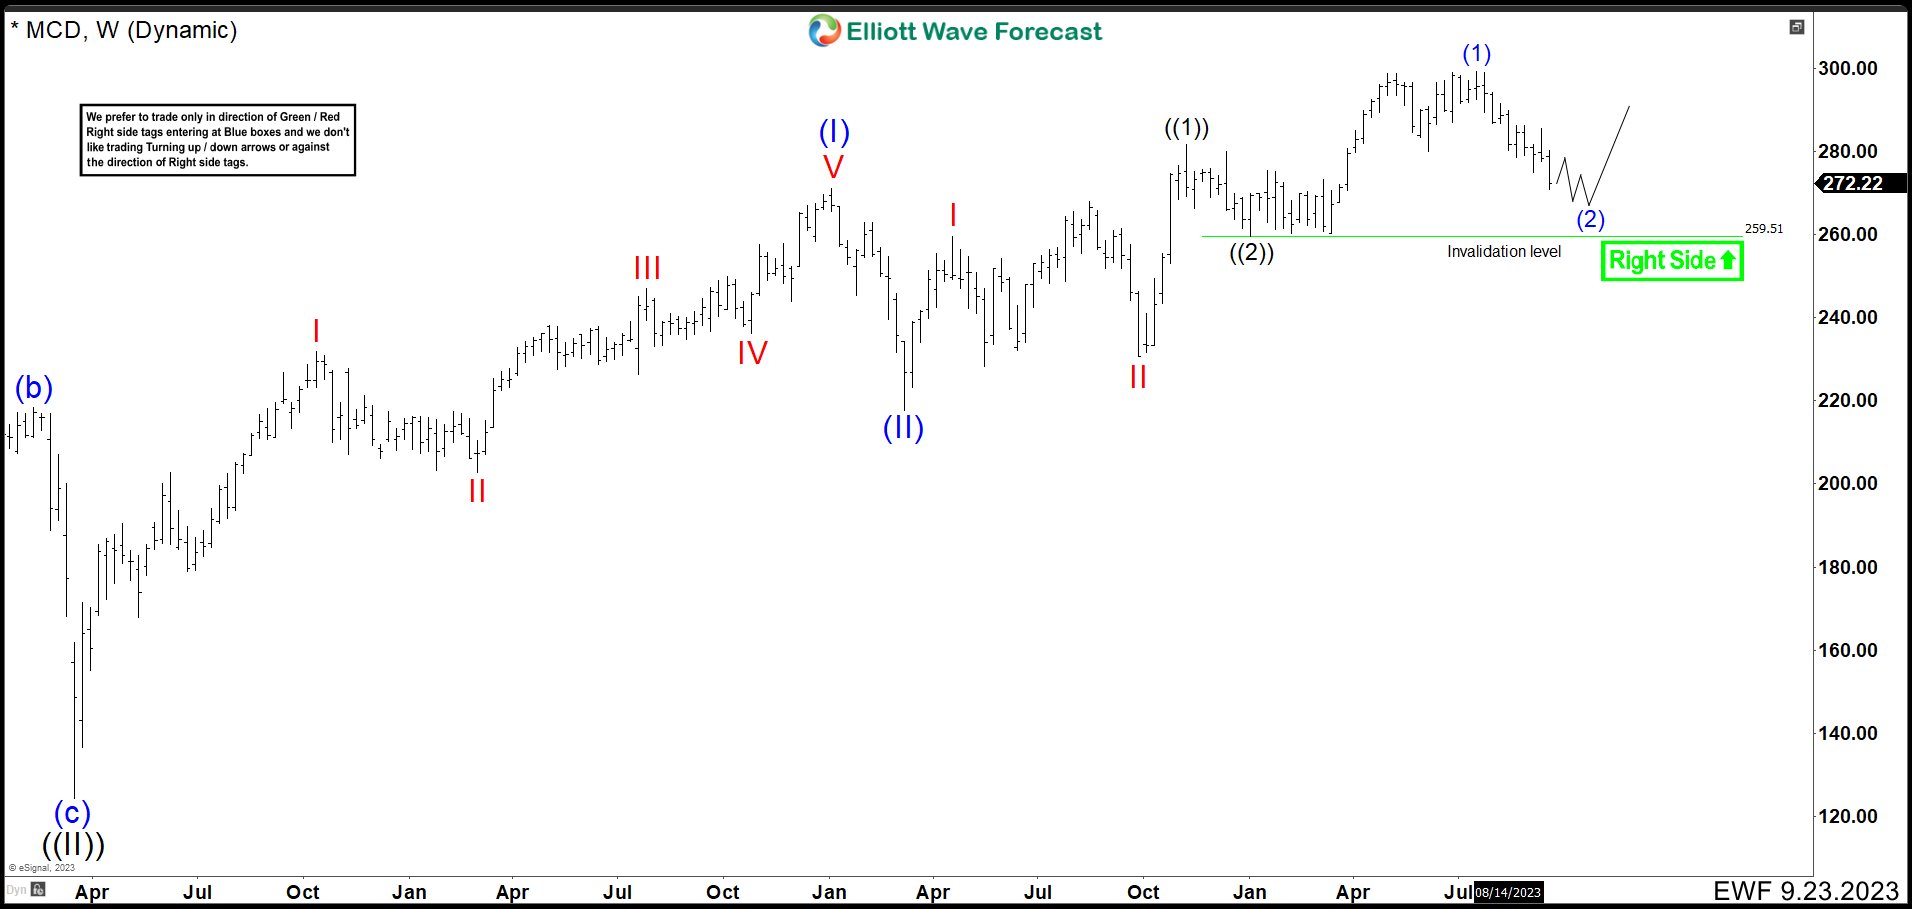
We cannot rule out the first idea as alternative view and keep the triple nest structure. As price action stays above $259.51, the view is valid and it should resume the rally. If market breaks below $259.51, then MCD is following the idea of the first chart and it is developing wave II lower.