@ tradeforex077
Greetings thank you for the reply. I think I have found something that can be a starting point for a signal generator. It is a modified version of your setup and you would need to apply some of the filters you normally use to model and refine it to your needs.
It is a mean reversion trade for false breakouts.
it consists of:
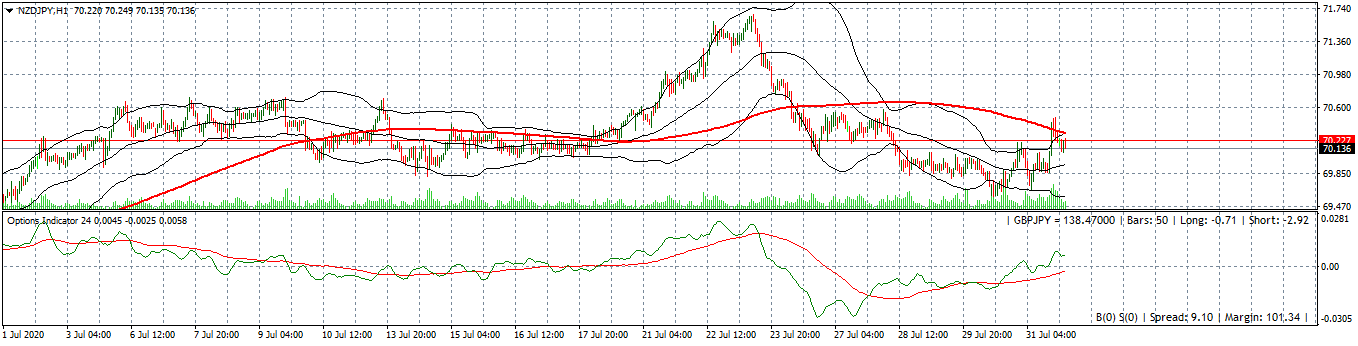
- change in 50 SMA H1: SMA50(0) - SMA50(1) (this measures the steepness of the change in the moving average t the end of the last bar): Current Change (CChng)
The Indicator Looks like this (Green line)
-
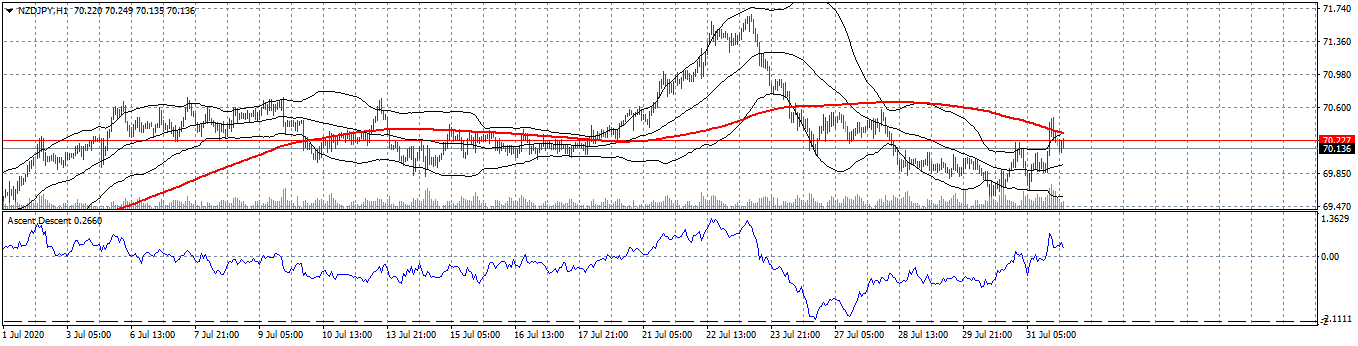
Z-value using above change compared to previous 1,000 changes in SMA50
Taking the last 1,000 changes in H1 SMA50, find the mean change and Standard Deviation (StDev) of the changes.
The Z value is: (CChng - Mean )/ StDev - This measures how many standard deviations the current change is from the average
The Indicator Looks like this:
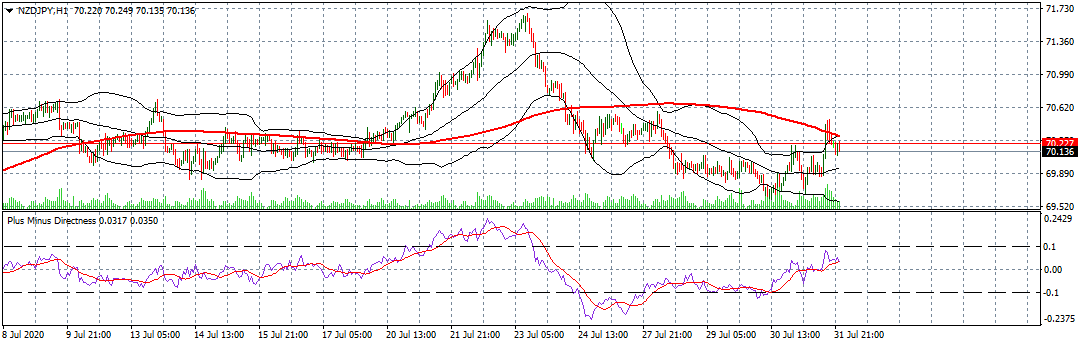
- PlusMinus Directness: ((Close[0] - Close[50]) / 50) / ATR(50)
The Indicator looks like this (Purple- Red line is moving average (12) of first indicator)
- Bollinger Band at Sigma 2 (in the main chart, there is a bollinger band at sigma 2 in black)
The Entry for Buy is:
(PlusMinusDirectnes >= AveragePlusMinusDirectness && Zscore >= -1 && Zscor <= 0.5 && Close[0] <= LowerBollingerBand)
These are situations where the price has dropped (broken out) below the lower Bollinger Band at sigma 2, but the corresponding rate of change in the moving average is low and still within -1 sigma compared to its last 1,000 values.
The price is outside its circa 97% probable range (sigma 2) but there is not a corresponding change the direction of the trend.
Take Profit: Mid point between SMA50 and current price
Stop Loss: Double the distance above
Note: the main feature that affects the win rate is the sigma value of the Bollinger Band. The higher the sigma value the higher the win rate.
You can also apply your own filters to improve the results but this seems to be a good starting template.
Note: For sell trades, use the opposite logic to the Buy entry.
Sample backtest:
AUDUSD BUY H1 2009 - 2019
Zscore >= -1 and Close[0] <= LowerBollingerBand(Sigma 2)
Win Rate = 75.29%
Break Even Win Rate = 66.67%
GBPUSD BUY H1 2009 - 2019
Zscore >= -1 and Close[0] <= LowerBollingerBand(Sigma 2)
Win Rate = circa.68%
Break Even Win Rate = 66.67%
USDCAD BUY H1 2009 - 2019
Zscore >= -1 and Close[0] <= LowerBollingerBand(Sigma 2)
Win Rate = 70.27%
Break Even Win Rate = 66.67%
USDCHF BUY H1 2009 - 2019
Zscore >= -1 and Close[0] <= LowerBollingerBand(Sigma 2)
Win Rate = 71.59%
Break Even Win Rate = 66.67%
NZDUSD BUY H1 2009 - 2019
Zscore >= -1 and Close[0] <= LowerBollingerBand(Sigma 2)
Win Rate = 73.25%
Break Even Win Rate = 66.67%
I think there is something in the above reversion trade. But it will need some work to get it right.