Introduction
This is a thread about Median Lines (ML). Also called Andrews Pitchfork it is an effective tool that can be used effectively in trading. Here I’ll discuss the proper use of median lines and it’s theoretical underpinnings.
Common Mistakes
Included in most trading platforms the ML tool is usually misused by most as a channel where the lines of the ML are viewed as diagonal support and resistance. Although one will quickly note that the lines often do seem to act as support and resistance this is not the intention of the ML and using them as diagonal support and resistance will quickly lead to frustration.
Price Moves in Swings or Waves
Crucial to using and understanding median lines is the basic fact that price moves in swings or waves. As we’ll see as this thread progresses the median line frames swings in ways that will help the trader see the rhythm of price as it swings.
Projecting Price
A core principle of price and probably the most important reason why one would want to use median lines is their ability to project price. We’ll see this in action.
I can go on and on talking but let’s get into some charts.
The Basic Purpose of Median Lines
This is a typical median line with pivots A, B and C.
Now with price bars. As previously stated median lines project price. This example displays the following tendency: the distance from pivot A to B often projects price moving from pivot C to the median line.
To make things more clear we can draw an arrow from pivot A to pivot B, copy it and paste it as shown. We can label the projection C to D. D is where we might expect price to reach. Notice in this case price reached the median line before the expected projection of D. Price can reach D before or after since we are dealing with time.
Now one will quickly realize that pivot C is a very important pivot and knowing for sure when pivot C is going to hold can be a challenge. For now we’ll not address this challenge. First we’ll continue with some more basics.
How do I know where to place my median line?
It’s All in the Swings
This is a loaded question and deserves a thorough answer and to do so we must understand exactly what a swing or wave is.
In the chart below we have a swing sequence consisting of a corrective leg and an impulse leg. The impulse leg occurred only after price exceeded the previous high shown here by price exceeding the blue horizontal line and going on to make a higher high. We can also say that the low was not created until the higher high was made. Another way to view this is that a new high creates a low.
I’ve placed a median line that outlines this swing sequence.
Getting rid of all the extra stuff I’ve labeled the pivots with A, B, C showing the three necessary pivots to create a median line. Remember MLs are meant to project price and in this ML we know that A to B projects C to D. Notice that I copied and pasted the red arrow to show this. If price would have reached D the it would have reached the median line (the center line of the ML) perfectly. In this case it came just shy of the center line of this ML and before the projection.
This is the same ML shown as a modified Schiff. The ML in the above chart was a standard ML. Notice in modified Schiff the projections do not change. Notice how the modified Schiff ML “channelizes” the price action although channel trading is not its intent. We’ll not go over the different MLs at this time but rather reserve that discussion as needed. For now it’s helpful to view each one as you draw MLs.
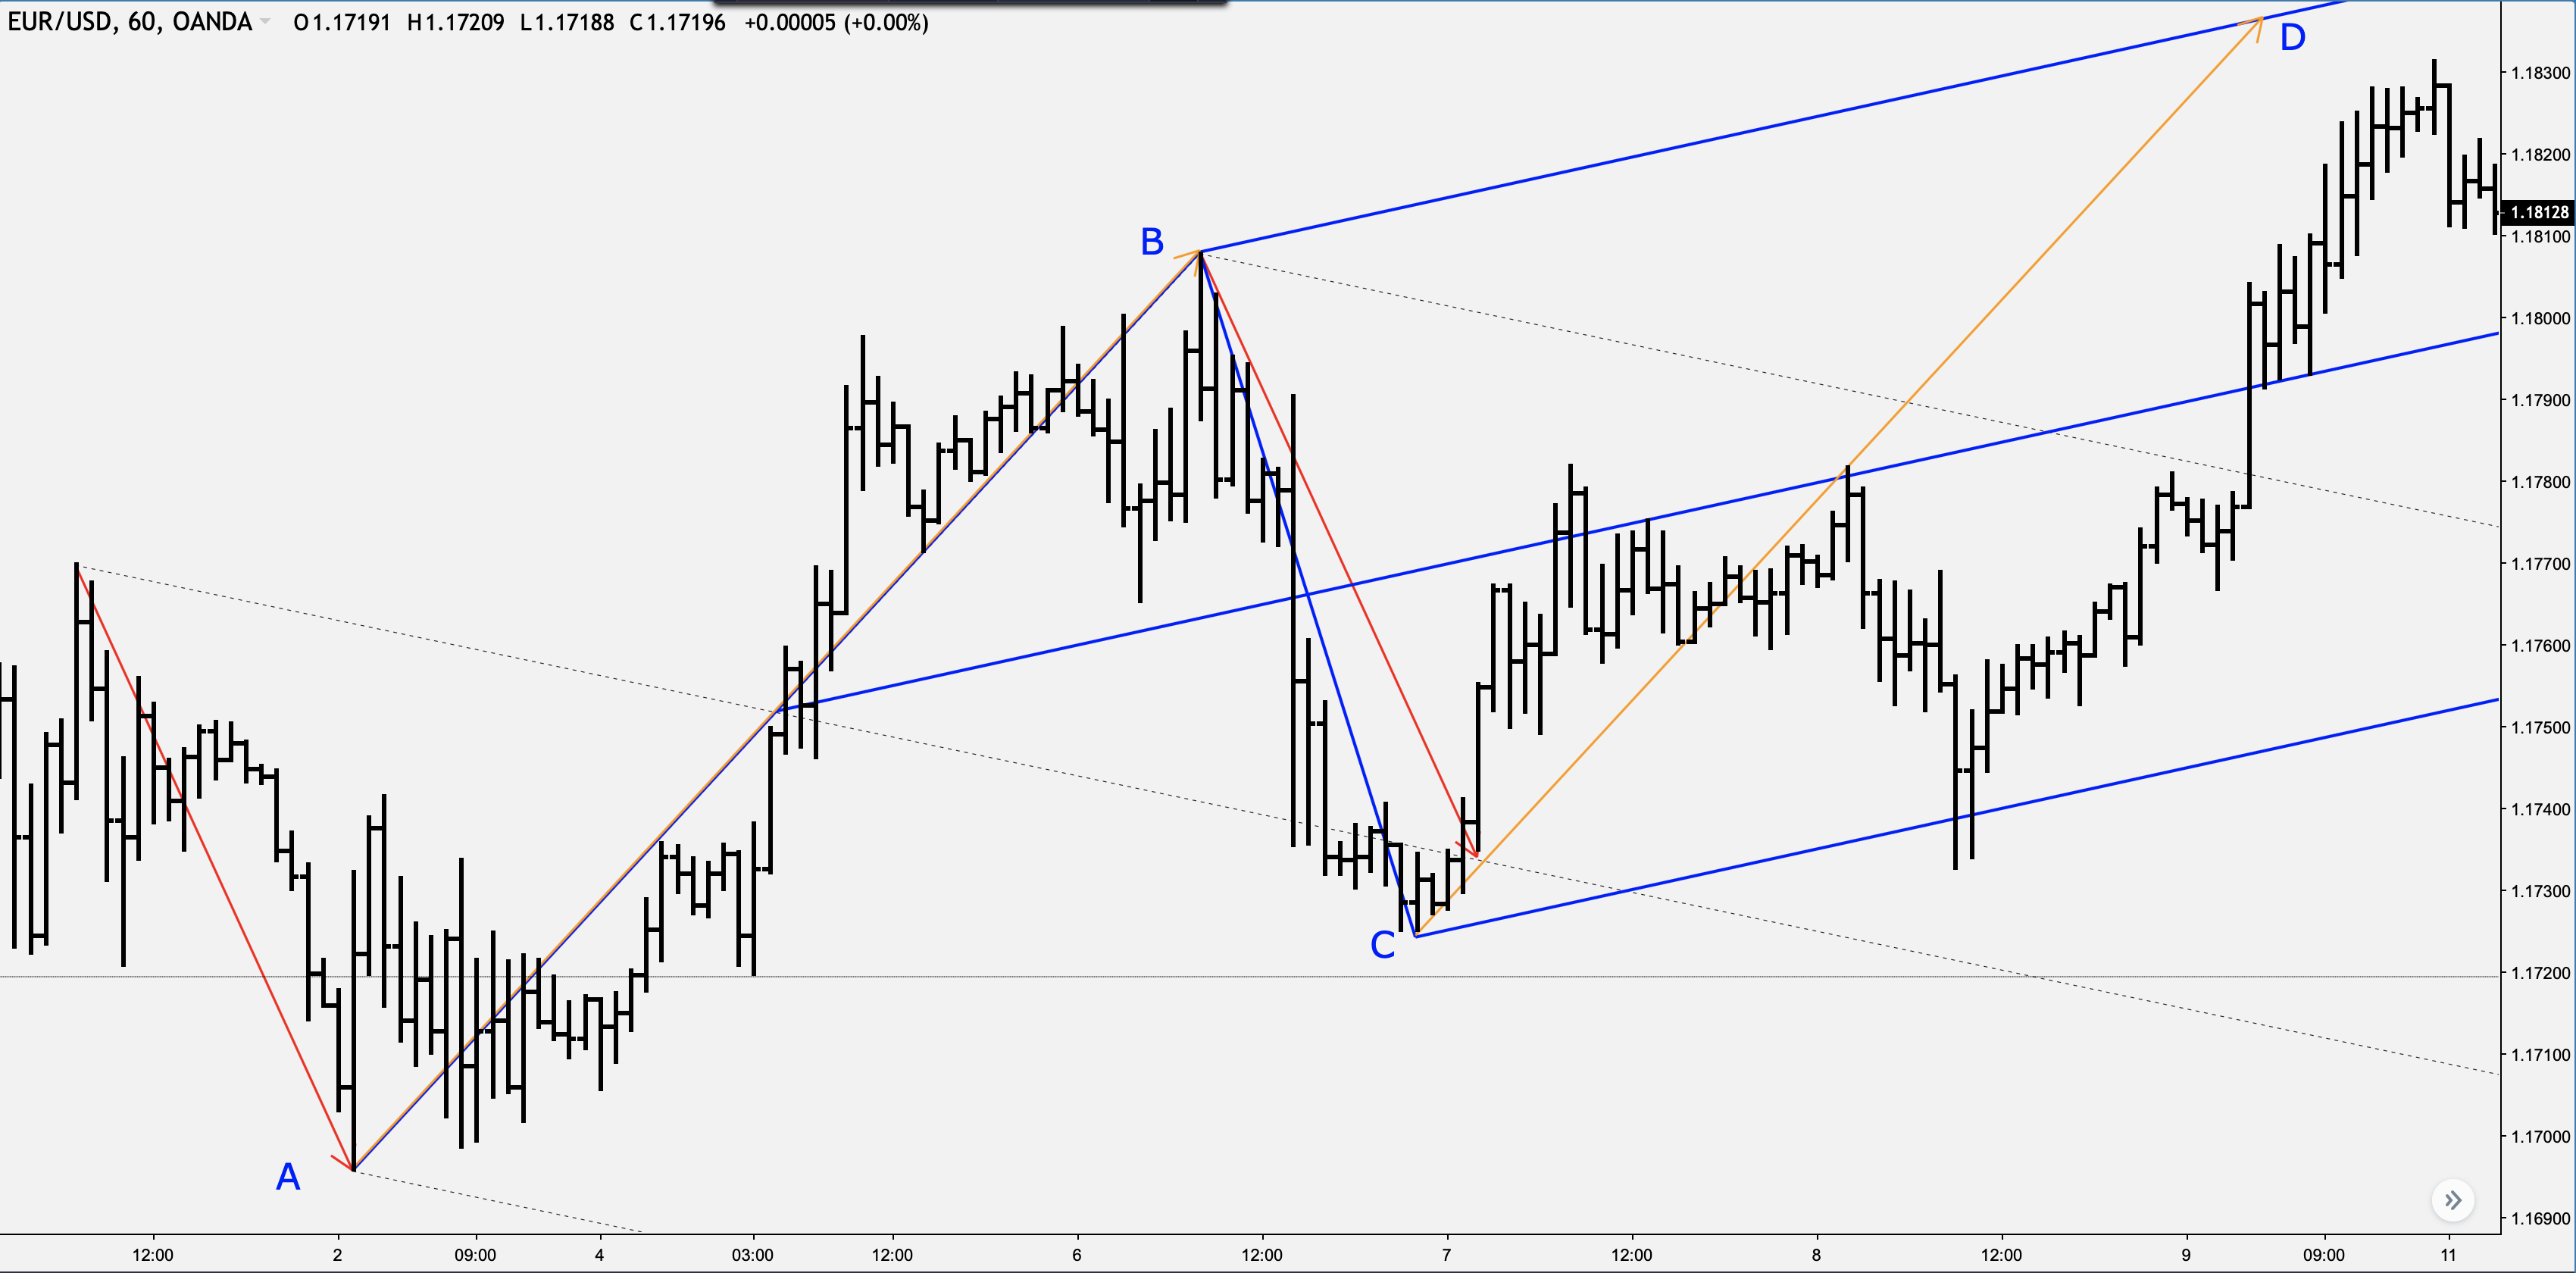
The chart below shows a completed ML. The projection A to B was fulfilled when C to D was satisfied. Notice that price is making higher highs and thus is in an uptrend. A to B is the corrective leg and B to C is the impulse leg. C to D is a potential corrective wave but only if price goes on to make a new high. Given that price is up trending one would benefit from entries that go with the trend. Therefore even though we know that pivot C held, a trade from pivot C to D would have been risky. Instead one might consider the fact that this ML is complete and thus entertain trading long from D for new highs.
I’ve drawn in a new blue ML. Notice that pivot C of the blue ML is where pivot D was on the black ML in the previous chart. The orange arrows show the projections.
This is the same chart with the blue ML now shown as a modified Schiff. Notice how in this particular case the modified Schiff softens the angle. The projection does not change.
This is a 15 minute EURUSD. I have the frame zoomed out as far as it can go. From a 15 minute standpoint it seems unreasonable to begin analyzing all the data on this chart when what I really need to know is on the right. So let’s go to the right.
Moving to the right quite a bit we can see a clear down trend in this frame. For a 15 minute chart this is a very reasonable amount of data to use and one can trade with only this.
I’ve marked the swings with the red arrows showing the impulses and the blue arrows showing the corrective legs. The orange arrow shows a swing inside the last impulse and at this point we don’t know if it will make a new low or not. Time will tell.
I’ve chosen the largest corrective swing to draw a ML. Notice that C to D satisfied the projection that A to B suggests but also notice that price did not touch the center line of the ML. Even so price has begun a downward turn. Without getting into exactly how one might have entered in the area of D how might one proceed with such a trade?
I’ve put in another ML (blue) as shown. Using the D pivot of the black ML for the C pivot of the blue ML it can be seen how blue A to B projects blue C to D. Isn’t it possible that C to D is a reasonable trade?
You have posted amazing charts. They are full of information for any new trader.