In the recent 2 years, M icron Technology (NASDAQ: MU) Investors were in the sky as the stock gained +500% in value since 2016 lows. The global corporation is one of largest semiconductor producer in USA behind giants like Intel & NVDIA.
In the recent 6 months, the prices of dynamic random-access memory DRAM and NAND flash memory decreased significantly which was reflected on MU Technology’s stock which suffered a 45% decline. However, despite the recent decline MU is still up 260% since 2016 low and the technical picture is suggesting a recovery to take place.
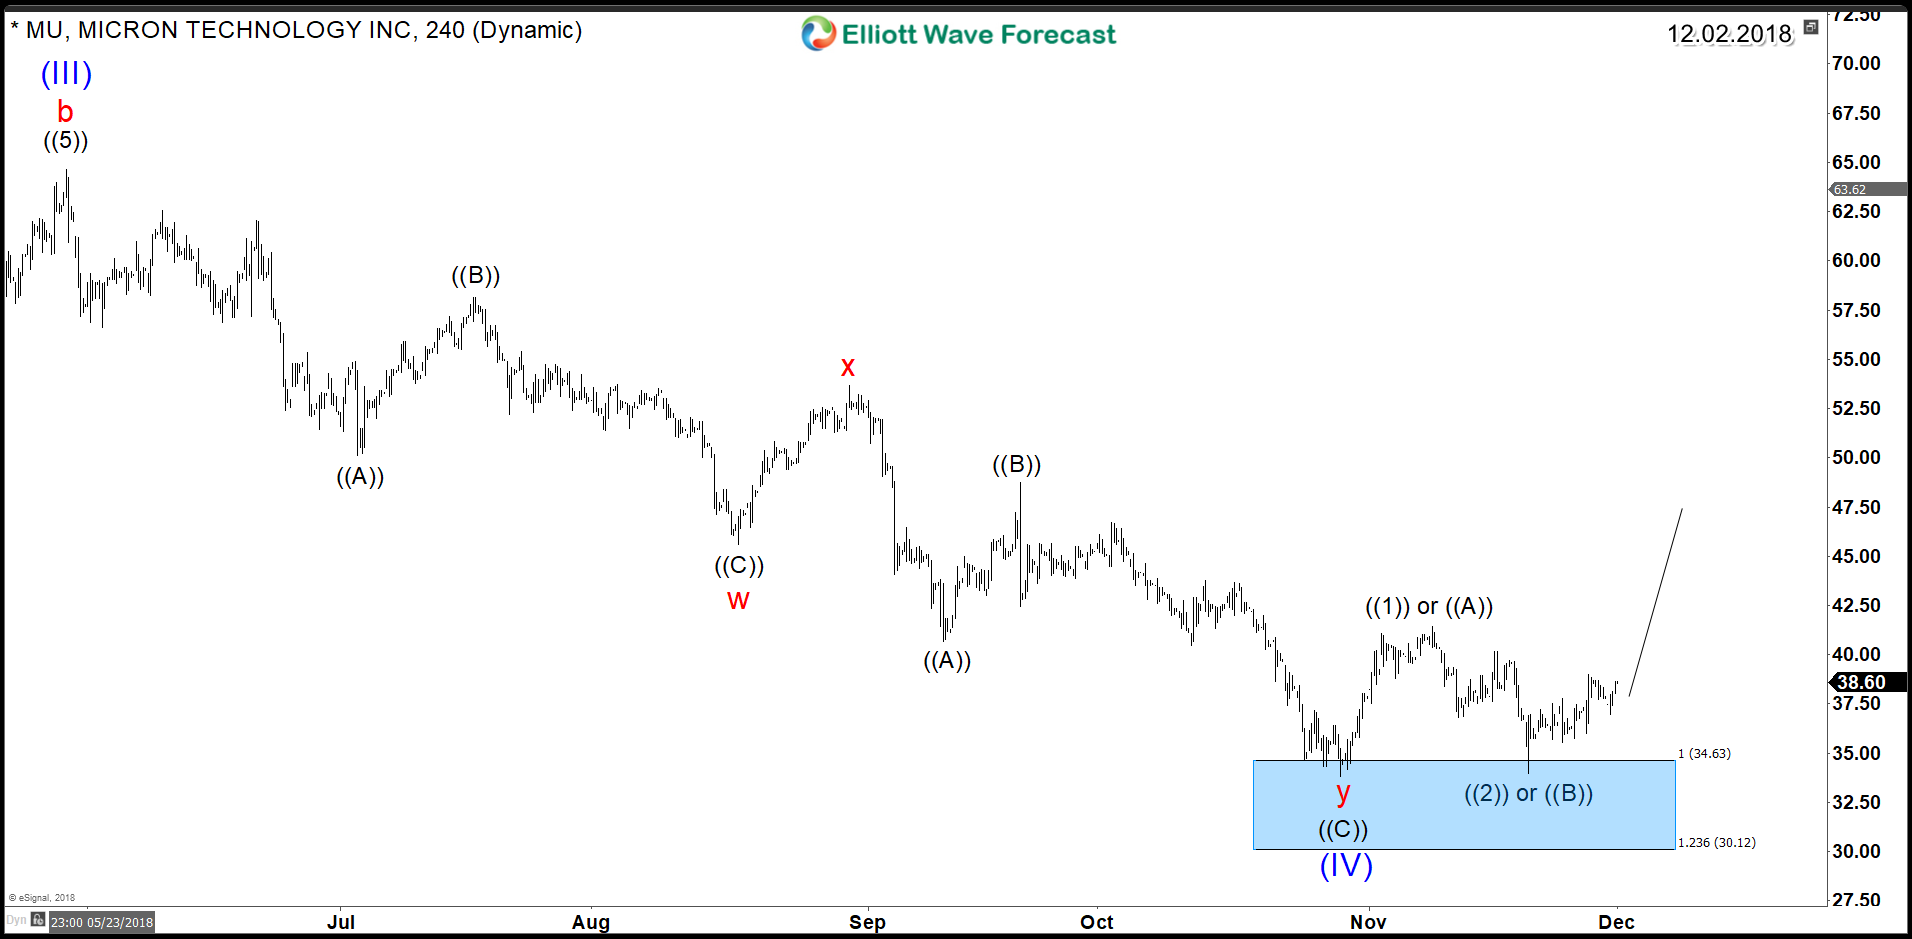
One of the most commune corrective structure is the double three 7 swings WXY. The Market does 3 waves move, then it corrects in 3 waves followed with another 3 waves move to the same direction of the previous 3 waves. In total, it has 7 swings which can be seen in the 4H Chart of MU as the stock has been declining since May 2018 in corrective structures. In addition, MU reached the 100% Fibonacci extension $34.63 represented by the blue box area which is a High-frequency areas where markets are likely to end cycles and make a turn.
MU Technology 4H Chart 12.02.2018

Consequently, MU is looking at least for 3 waves bounce to correct the cycle from May 2018 peak as a first step of recovery, then based on the rest of the stock market it has the possibility of rallying further targeting new all time highs.
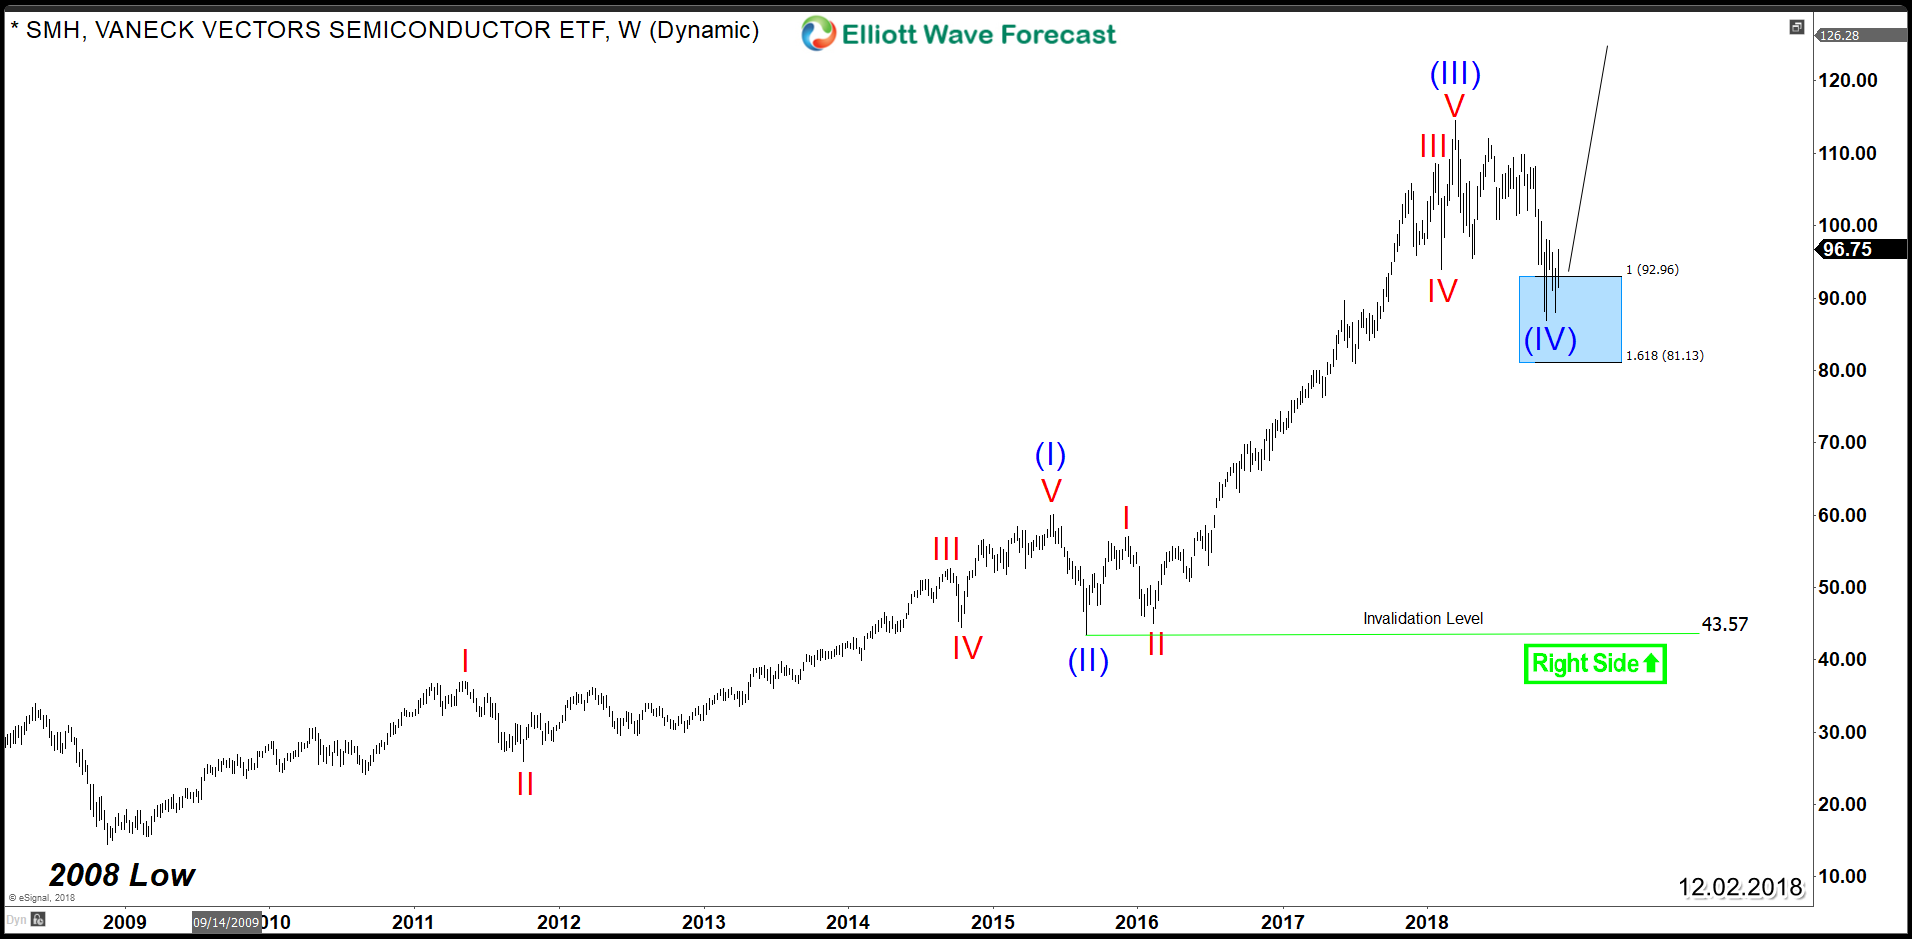
The move higher can take place based on the weekly bullish trend since 2008 in the Semiconductor sector which is still intact. We can see in the next chart of ETF SMH that an impulsive structure is still in progress and a final wave to the upside is needed before ending an impulsive 5 waves move advance based on Elliott Wave Theory. Therefore a direct correlation between SMH and MU is suggestion that both instrument will remain supported as long as 2015 /2016 lows are intact.
SMH Weekly Chart 12.02.2018
