In this technical blog, we will look at the past performance of 4 hour Elliott Wave Charts of Microsoft stock ticker symbol: $MSFT, which we presented to members at the elliottwave-forecast. In which, the rally from 06 January 2021 low unfolded as an impulse structure. And showed a higher high sequence favored more upside extension to take place. Therefore, we advised members not to sell the stock & buy the dips in 3, 7, or 11 swings at the blue box areas. We will explain the structure & forecast below:
Microsoft 4 Hour Elliott Wave Chart
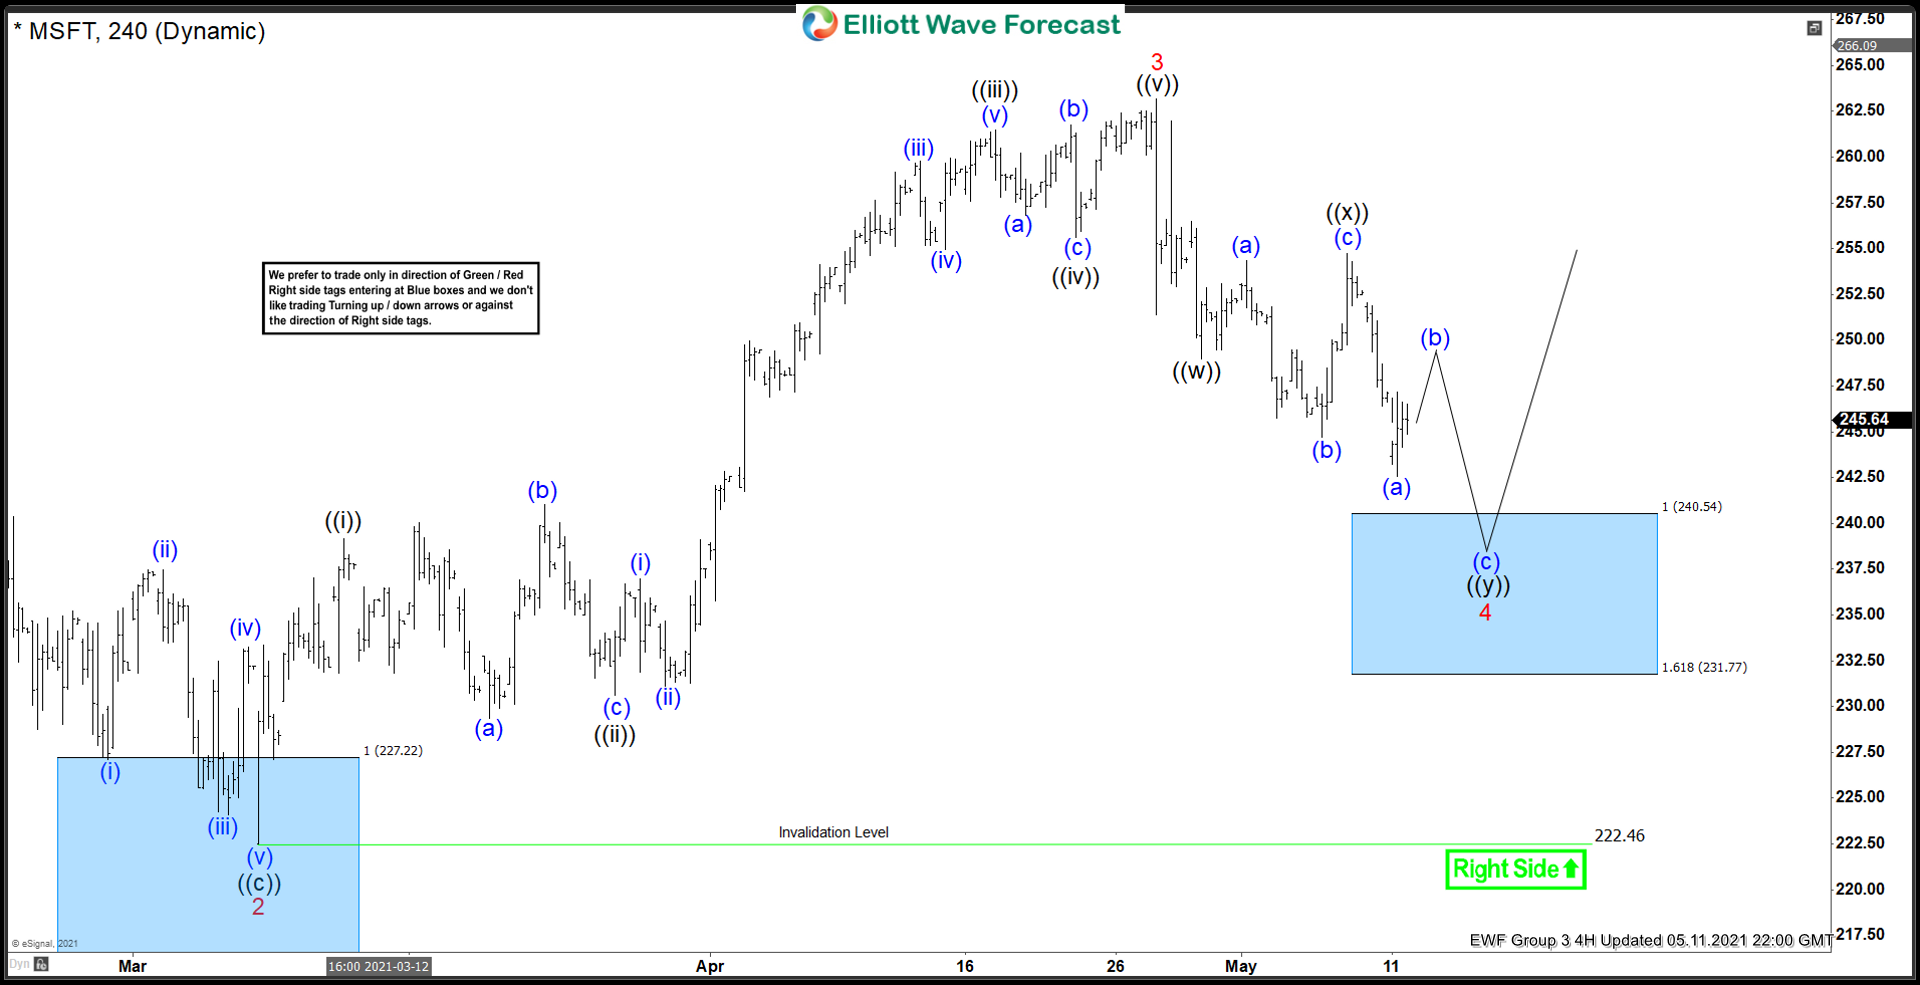
Above is the 4 Hour Elliott wave chart from the 5/11/2021 update. In which, the stock is showing an impulse rally higher where wave 1 ended at $247.70 high. Wave 2 pullback ended at $222.46 low and wave 3 ended at $263.19 high. Down from there, the stock entered into a wave 4 pullback to correct the cycle from a $222.46 low. The internals of that pullback unfolded as Elliott wave double three structure where wave ((w)) ended at $249 low. Wave ((x)) bounce ended at $254.75 high and wave ((y)) was expected to reach $240.54- $231.77 blue box area. From where buyers were expected to appear looking for more upside or for a 3 wave bounce at least.
Microsoft 4 Hour Elliott Wave Chart

Here’s the 4hr Elliott wave Chart of Microsoft from the 6/17/2021 update. In which the stock is showing a strong reaction higher taking place from the blue box area. Right after ending the double three corrections within the blue box area. Allowed members to create a risk-free position shortly after taking the long positions at the blue box area.