Good Day Traders and Investors. In today’s article, we will look at the past performance of the 1 Hour Elliott Wave chart of Microsoft Corp. ($MSFT) The rally from 5.24.2023 low unfolded as a 5 wave impulse with an incomplete bullish sequence from 4.25.2023 low. We will explain the structure & forecast below:
$MSFT 1H Elliott Wave Chart 6.01.2023:
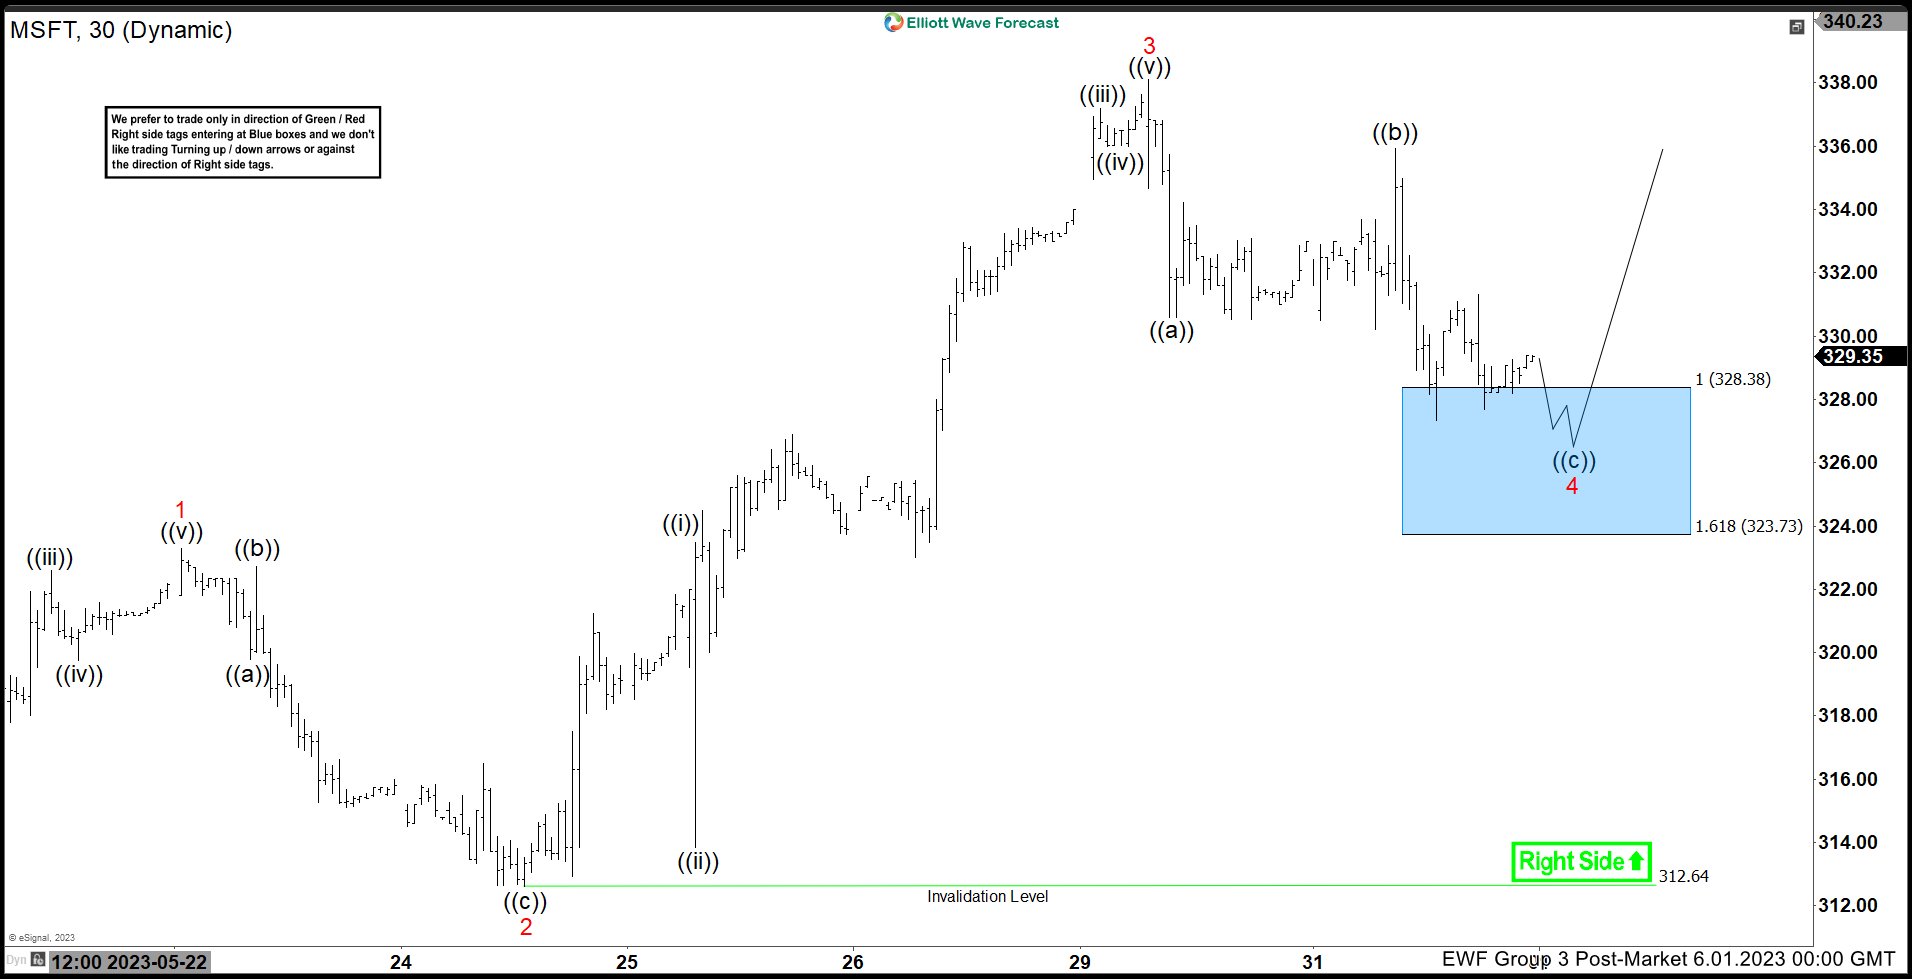 Here is the 1H Elliott Wave count from 6.01.2023. The rally from 5.24.2023 unfolded in a 5 wave impulse which signaled a bullish trend. We expected the pullback to find buyers in 3 swings at $328.38 – 323.73.
$MSFT 1H Elliott Wave Chart Latest View:
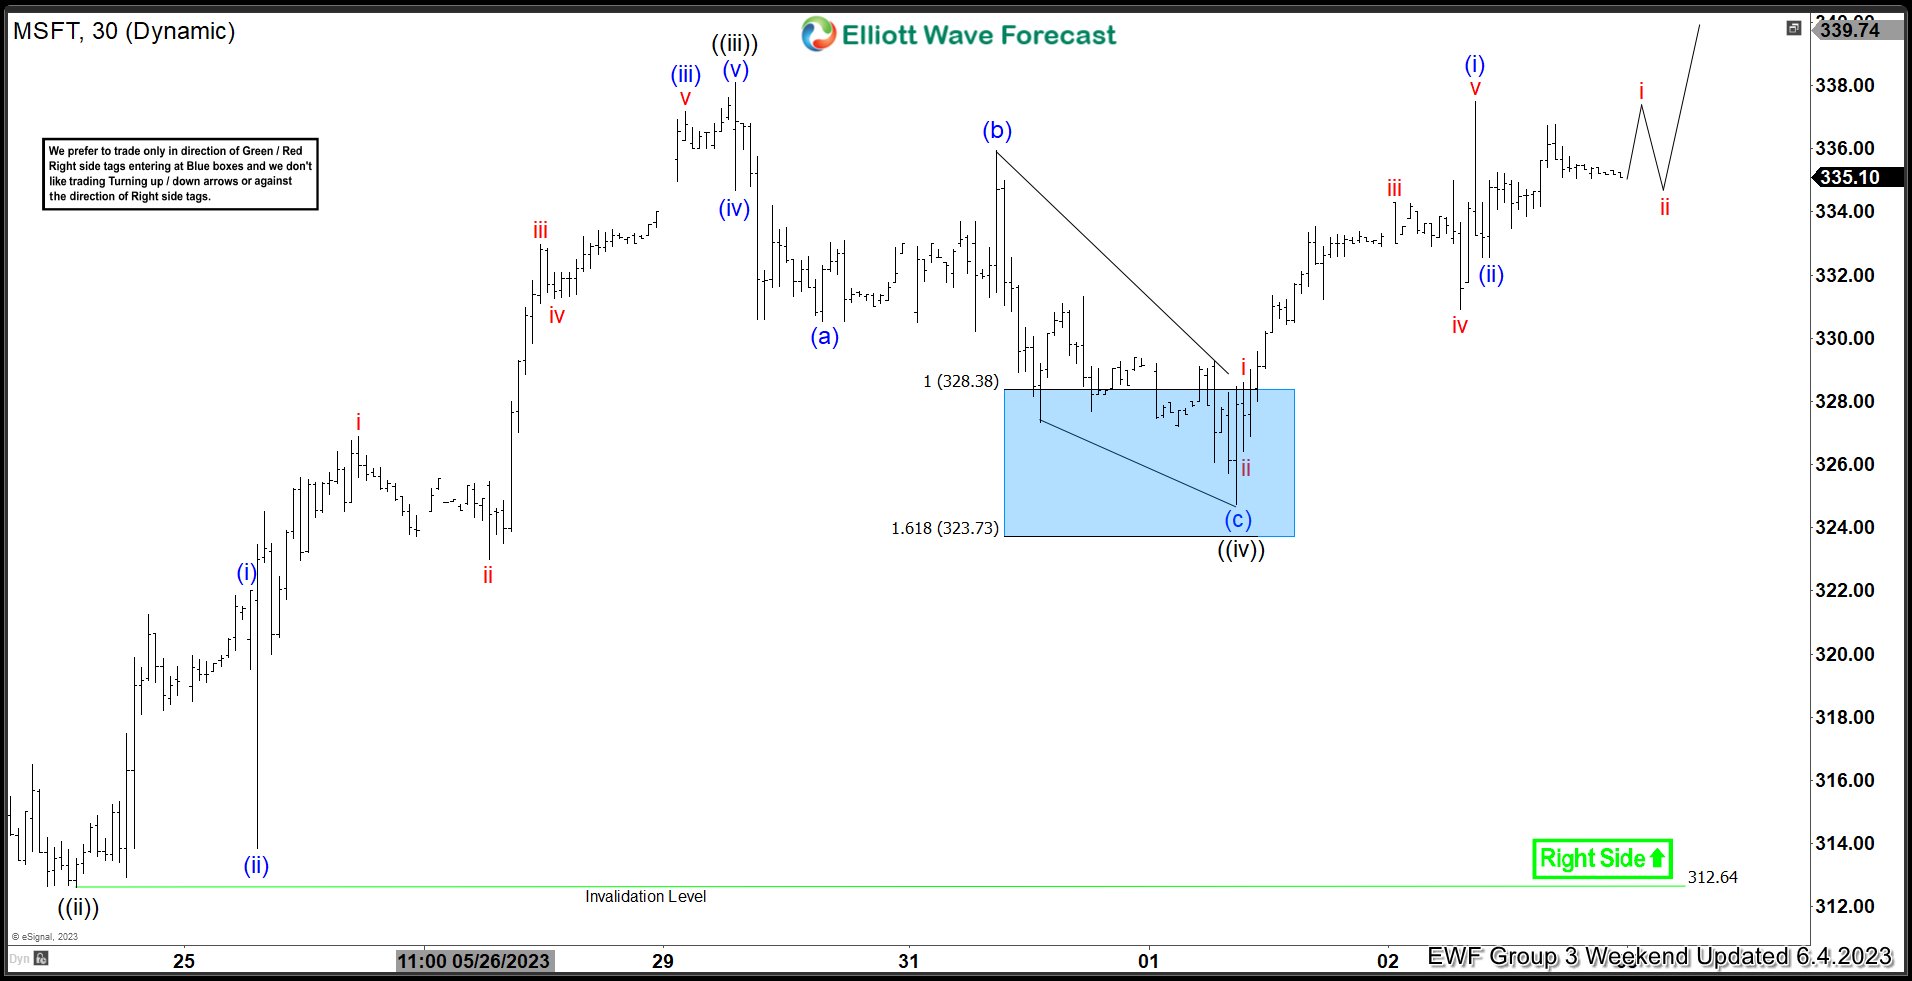 Here is the latest 1H update showing the move taking place as expected. The stock has reacted higher ending the cycle from 5.30.2023 peak and eventually breaking above it which confirms more upside is to be seen.