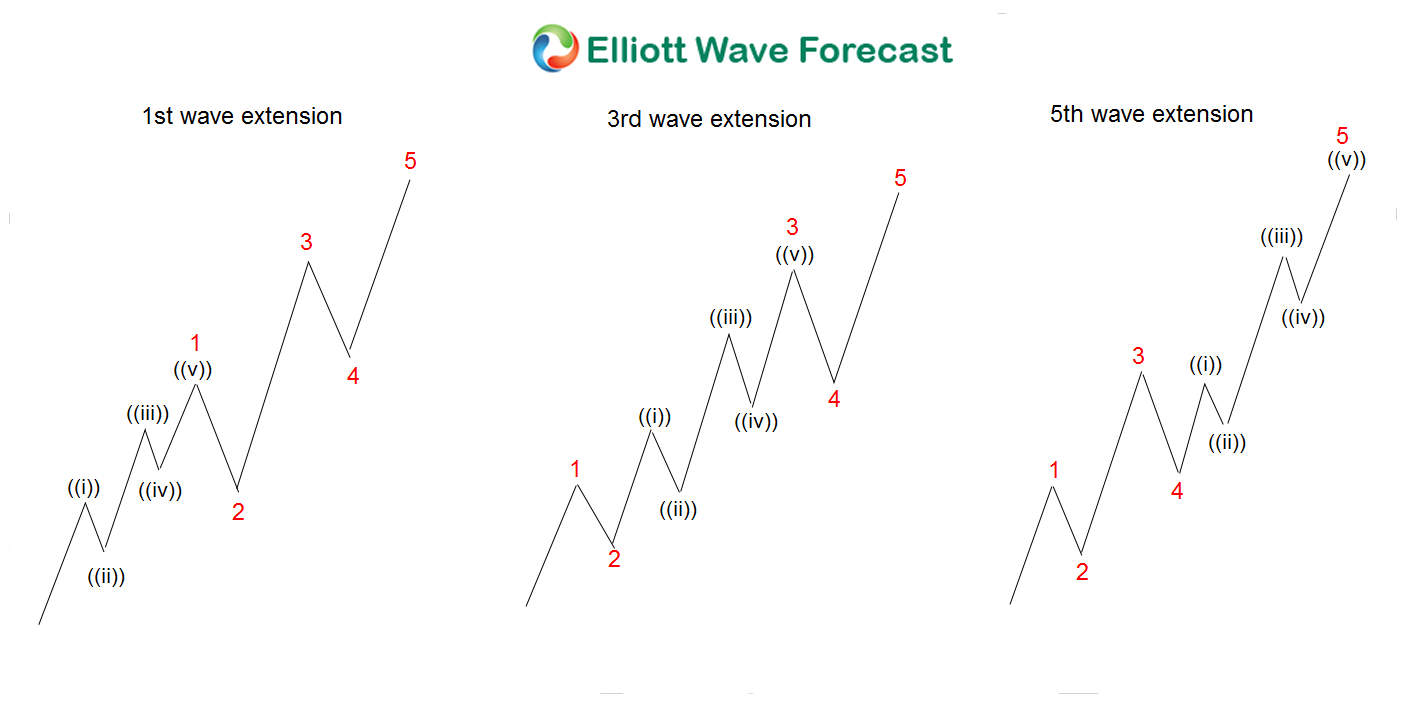
A few months ago, we were expecting Microsoft to trade into the $157.00-$172.00 area. We observed a very technical impulse from all-time lows where wave (III) is ending. We explained the whole idea in the following blog Microsoft Elliott Wave View: Why It Will Be Supported Into $157.78-$172.77 Area. The area has now been reached, but the wave structure from 12.04.2018 low is very constructive to the buyers. The Elliott Wave Theory impulse structure consists of five waves. Three of the 5 waves are with the trend and two of the 5 waves are against the trend. The following chart illustrates the idea:

Each impulse needs to have five waves in a sequence of 5-9-13-17-21-25. This is very important to call extensions because most of the time one of the three sub impulses will extend in what is called nesting. The Nest is sequences of 1-2-1-2, and that is when the number jumps from 5 to 9 or even higher depending on the number of the nest. The Following chart shows a nest extension in different part of the 5 waves impulse.

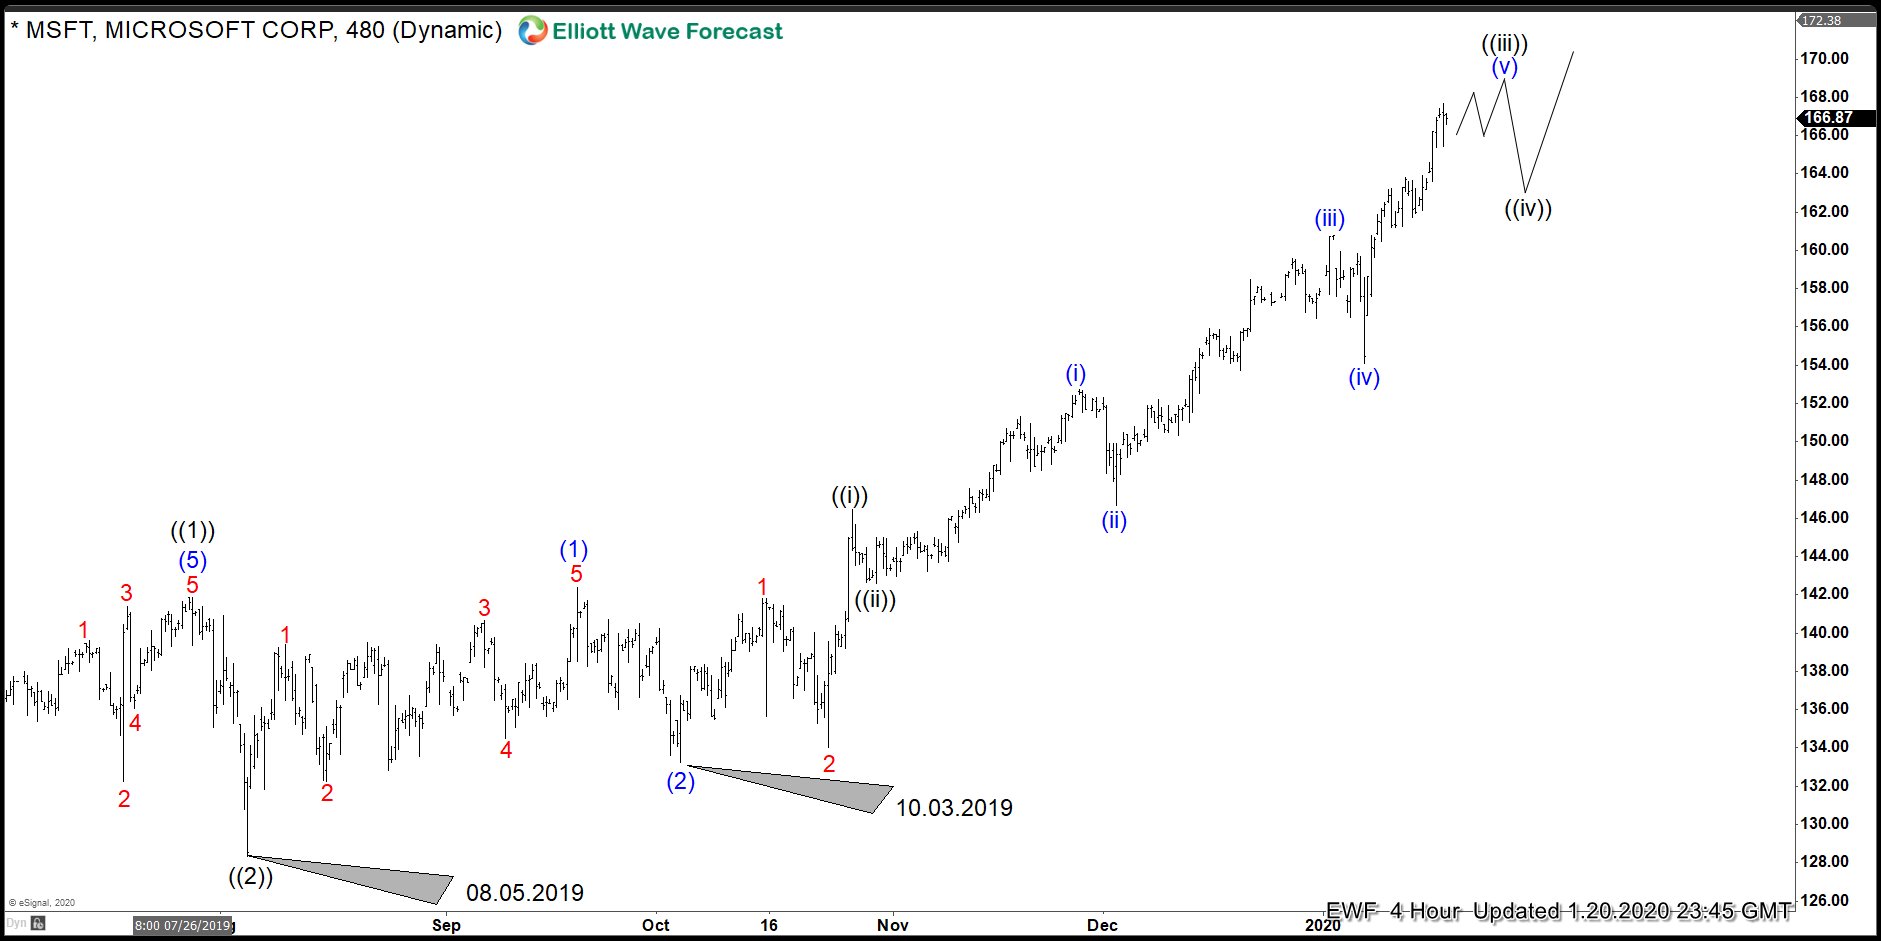
Looking at Microsoft from 12.04.2018 low, the stock shows an incomplete sequence. We are afraid that a nest within wave ((3)) is taking place. At this moment, we believe the stock is ending wave ((iii)) of 3, which should be the strong wave within the whole cycle. The following chart shows where we are
Microsoft 4 hour Elliott Wave Chart

The above chart suggests Microsoft is within wave ((3)) rally. If we count the number of swings since 08.05.2019 low, the stock has done eleven swings. This is not an impulse sequence, thus more upside is likely to come. At this moment, a series of four-fives will happen before ending the cycle from 08.5.2019 low, then a big wave ((4)) will happen. Many wavers tend to overlook the nesting and swing counts, but it is very important to trade the right side.
Another indication that this is the right count is the correction in World Indices which show the same low like Microsoft. Many of World Indices remain incomplete and call for more upside, which should also drive Microsoft into new all-time highs. As we have explained, there is no reason to sell the stock, either picking a top or into pullback. On the other hand, the wave structure suggests the stock to remain supported and it should extend higher and peak sometimes in 2020.