MPA is just the maximum amount that the trade goes in your favor before you exit. It might retrace after that, but we just want to record the maximum pips it went in your favor anytime you were in the trade. It doesn’t matter where you take profit for this stat, except that after you exit you quit taking data on that trade.
Hello Graviton!
I´ve been following all the advice you are giving to us, and one of the problemes i have is that i let a good trade become a loser. I make good entries, but the problem seems that my targets are too far away. I see the price go in my favor for a while and then go against. How do you deal with this? When is the correct time to take part of the profits?
Thanks! 
Ok duly noted!
Hi graviton, i have a qns regarding your SL.
say for example you enter a trade with SL 30pips, which is possible the high of a extreme candle. (You’re going short by the way)
And if PA retraces against you say 20 pips, would you exit the trade or will you let it continue running till it hits your SL, or wait out and see if it goes into your direction again?
Cus there are times whereby you could save yourself few pips and exit before hitting your SL, and also there are times whereby if you didnt do anything the trade goes back into your direction.
Your thoughts? Thank you!
Taking profits along with setting stop losses are two subjects I have just lightly touched on. Since you’ve asked about taking profits, I’ll explain how I do that first, and then I’ll go into setting stop losses in another post. I intend to present a simple method to decide when to take profits and more importantly a method to evaluate its effectiveness. You’ll be happy to hear that deciding when and where to take profits turns out to be easy. Evaluating those decisions in an objective manor is only a bit more complicated, but if you don’t evaluate your performance, you can’t improve it. I’m not claiming my system is the best possible for every trader, but if you have an objective method to measure effectiveness you can test other systems against mine and find the one that works best for you.
The question of when do I take profits is a very hard one to answer because there are so many different situations possible. If the question is reframed as how do I know the the trend that has generated my profit has ended, the question is much easier to answer. First we go back to the definition of a trend being a series of higher lows for an uptrend or a series of lower highs for a down trend. So in general, when price makes a new higher high in a down trend, the down trend is broken. In an uptrend, when price makes a new lower low, the uptrend is broken. The only trick to this is that the price must make a couple retracements for this system to work. If price goes straight against you, there is no profit to take. If it goes straight in your favor with no retracements, I suggest always taking ½ of your profit. So if it goes 20 directly in your favor with no retracements and reverses 10, just exit with your 10. The exit with ½ your profit rule will always get you out with a profit if price goes say more than 20 pips in your favor. Much more than that a couple minor retracements should form and the following system can be used.
I’ll talk about an uptrend here and you can just reverse everything for a down trend so I don’t have to say everything twice. Since I’m a trend trader, when I’m in a trade that’s winning, the first thing I want to do is understand the trend of the trade. It will take at least two retracements forming two higher lows to draw the trend line. So in theory, after a couple retracements form little dips in price, I can draw my trend line under the higher lows and stay in the trade no matter what until price breaks below that trend line.
In practice, there are lots of things to consider. Often price will spike down but the candle closes above the trend line and the trend continues, so you want to see something close below the trend line before taking profits. If you are trading the 4H chart, price may fall for several hours before the 4H candle closes, so I will move down to the 1H to get a better look and if I still can’t see things clearly I’ll move down to the 15M chart. Occasionally I’ll move all the way down to the 5M chart, but I want to see a candle on some chart close below the trend line before exiting. So now we are getting back into multi-time frame trading, again.
Another aspect of this is if you are trading the 4H chart, you would have to wait all day or even a few days to see a couple retracements and draw a trend line. So I will often drop down to a lower TF where higher lows are formed more quickly, say the 1H TF, and draw my trendline there where I can draw it faster. Sometimes it’s easier and faster to draw on the 30M or even 15M chart. Sometimes I’ll draw it on the 1H, but my old eyes can’t see if I have the end touches right on the right spot, so I’ll drop down to the 15M chart and adjust it a little bit. The more you practice drawing trendlines, the easier it gets.
But price doesn’t move in nice smooth straight trendlines, does it? You know the price must stay above the trendline to still be in an uptrend, but it can make all sorts of head fakes and minor retracements. Each retracement is like a is like a roller coaster ride where you hold your breath and hope as it goes against you and only dare breathe again when it turns back in your direction. If you just entered on a 4H chart two hours ago and are 60 pips ahead on the same entry candle, how do you decide if you should exit if price moves against you? I’ll drop down to lower timeframes where I can see the series of higher lows that have formed over the last couple hours, say the 15M or even the 5M chart. I’ll look for the higher low that hasn’t been breached since I entered, and that if it is breached it will be about ½ my profit, because anytime I have a good profit of about 60 pips, I want to walk away with at least half that profit. It’s not quite as arbitrary as just setting the stop loss at 30 pips, since it depends on price action.
There’s a point to notice here. It should always be price action that puts you in a trade, like a CBL or the breaking of a retracement trend line, and it should always be price action that takes you out, like price fails to make a new higher low and turns down to make a lower low, breaking your trade trend line. As you are in the trade longer, longer time frame charts will form trend lines and their own series of higher lows. So after a several hours, you can look at the series of higher lows on the 15M chart, then after several hours more you will see the trend forming on the 30M chart, and after several hours more, if it’s a rare and really good trade, you’ll see the series of higher lows forming on the 1 hr chart. The point is to skip the stop loss up as price moves up, always staying under a higher low that if breached will at least get you out with half your profit. In the beginning of the trade, you might just want to be under the nearest higher low on a 5M or 15M chart for a tight stop of 20 pips more or less, since you don’t want to risk much. But as the trade develops and you have more profit, you might want to move up to the nearest higher low on the 15M or 30 M charts to protect half of a 60 pip profit. If the trade goes really well, and you are up well over 100 pips, you might move up to the 1H chart to pick out the higher low that would protect say 60 pips of your profit.
In general, that’s the way I take profits. Price may soar way up and crash way back down, but if it doesn’t breach that higher low I’ve chosen to set my stop under, I consider price to still be in the trend and I stay in the trade. Now this won’t work 100% of the time. Nothing else will either. But you get a second chance with this. If price falls below the higher low you’ve picked out and you are stopped out, one of two things have happened. Either you were right and the trend of your trade is really broken and price will continue to fall breaking more and more of the old higher lows as it goes down, or, you were wrong and set your stop too tight, just below one of the minor ripples on the ocean rather than a big wave. If you are taken out early, no worries. Price will turn before breaching the big wave you should have been under (you’ll have to look for it to see it), and you can get back into the trade with your stop properly set under the big higher low rather than one of the many small ripples.
Of course, this is subjective. A big higher low at the beginning of a trade is a small ripple after many hours and the trade is way ahead in pips. But the point is, if you clearly see you were wrong and were not seeing the big picture, you can re-enter as price starts going back up. If this is done with a bit of skill, about half the time you can re-enter where you exited or maybe a few pips better to even pay for the mistaken exit. Even if the re-entry is not so good and you lose a few pips and a few pips spread, that’s still way ahead of losing all 60 pips profit and a big fat stop loss as well. But you have to cut these losses short somewhere. After one attempt at re-entry and you are stopped out again, give it up and trade another pair. Fighting the market will just cause losses to pile up and waste time you could be using to make a profit somewhere else.
So that’s my simple method. Just take profit when the trend that made the profit is broken. I’m also watching all sorts of other things while trading, so if price bounces off a major resistance, I may just take profit there. I can always re-enter later. But generally, you want to let your profits ride as long as the trend that made those profits is intact and get out fast with your profits when that trend is broken.
So how do you determine if this system works better than say a fixed ½ ATR trailing stop or using PSAR to take profits? To evaluate that you’ll need to collect another stat as you trade, MPA or maximum profit available, as well as the usual things in the trade log that most trading systems keep. In the dream world best case, you would always take your profit right at the maximum profit available, which is the peak highest possible profit point during the course of the trade. In reality though that will rarely happen and the actual profit (AP) will be something less than the maximum possible. By dividing the actual profit by the maximum profit available you can calculate your profit efficiency (PE), so PE = AP/MPA. So if you actually take 70% of the available profit, your PE will be 0.70 and of course, the higher the PE, the better you are doing at maximizing the profit you are taking. To look at PE for several trades, just use the ones that had a profit, add the MPA’s and AP’s and divide as usual to get a PE average for a group of trades. Note that spread is not considered or included in any of these calculations since it can vary from one pair to the next and it will throw off your calculations.
Next we’ll look at setting and trailing stops and evaluating the efficiency of your stop setting.
I don’t have a hard rule on this. I try to ask, knowing what you know now, would you enter the trade here. If the answer is yes, I stay in the trade and if the answer is no, I exit. I probably exit about half of these situations because the trade just isn’t moving as I expected, and I stay in about half because I believe the basis of the trade is strong and it’s probably just a bounce off an s/r line and will continue.
Something to note, you could probably get a good entry about half the time by just fliping a coin. Since you can make two entry attempts with 20 pip stops for one with a 40 pip stop, it just doesn’t make sense to pick very large stop loss amounts and stay with with it to the last pip and it stops out. So from that point of view, the bias should be to exit early if price doesn’t move as you believed it would and try for a good entry on another pair.
A very interesting statistic!! 
Soon, I intend to write up a whole method to analyze and optimize stops for any trading system or method. This will be one of those rare big original Graviton things that come around only once every few months. I just need to find the time to write it all down. This will be the best thing I’ve ever written down by far :eek:
…
When you do this, [B]Merchantprince, DodgeV83[/B] or [B]IronHeart [/B]may be willing to convert it to PDF format for you. 
hmm …
it sounds like
tymen is just dying to read Graviton’s whole method to analyze and optimize stops for any trading system or method
Hi Graviton 
I have question
When I can consider that PA returns to its downtrend - once it breakout retracement trend line or when PA made new lower low??
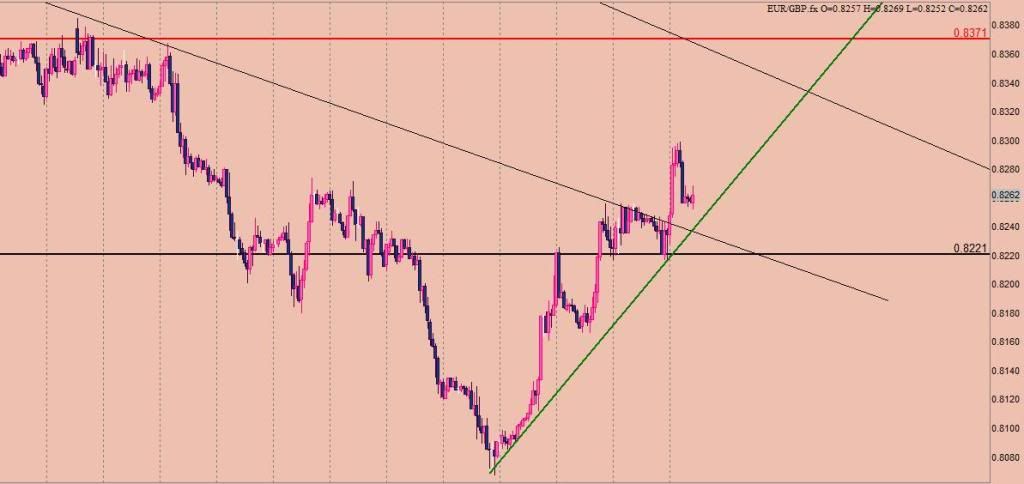
Below is 1H eur-gbp chart
please explain when to make short (long) entry once a candle break out green retracement line or when a candle break out the level 0.8221 which is the level of last higher low. Also whould be good to know short entry should be made right at the new candle open or just wait when PA returns back to retracement trend line again and then made an entry.
In case price bounces off the green line when to enter at the new candle open? How to return to the up trend and when if PA won’t touch green retracement line and will continue to rise ???
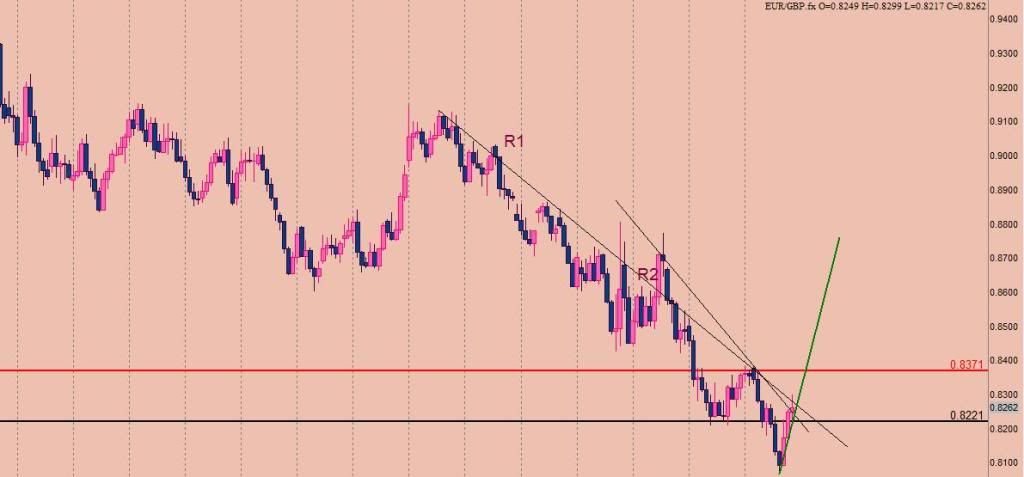
I have one more chart. Its daily eur-gbp
there are two downtrend lines (short and long)
when you can say that trend line is broken - when PA break out short downtrend line or the long one?
Can you say that PA bounced off the long downtrend line already and its time to enter short or is it breaked out short downtrend line and its time to enter long??
thanks
Thanks for the insight. I use a 2% mm SL, as it irks me to see my SL being hit and after which watching the trade go in my direction again.
Like you said, we can always re enter again, and that’s what im going to do.
If it fails me again, ileave that pair out.
Right now im cutting my position size in half as i blew 10% of my account last week. Nothing to be ashame of, but tons of lessons to learn from.
RenaLa, good questions. Looking at the daily chart first, you are in a solid down trend. You have marked the current retracement against that down trend correctly.
You should look at these trendlines as visual aids to your trading, like an indicator. It’s price action that counts. If you were trading both ways, you’d want to exit the retracement up-trade quickly as soon as you you think your profit is maxed out and price moves below the trendline. Of course you’d like to exit the up trade right on the highest peak, but you can’t know where that highest peak is in advance, so you exit after a good peak and a solid turn down. It’s OK if you exit with profit a little early, just as long as you are making profit.
Entries need to be made more carefully. Half the entries I intend to make never work out and I don’t wind up entering the trade at all. To enter back down on a break of the retracement trend line, you need a couple more good reasons to enter. It’s always best to have three good reasons to enter any trade. Technically, the up trend retracement is still in effect until price breaks down far enough to make a new lower low. That would be quite a bit below the break of the retracement trend line. So below the 0.8220 line you marked is a technical break of the retracement uptrend and if lower timeframes are going down, it’s a good short entry. Note that the average down move is large, like 200 pips, so waiting until you have a strong entry signal still allows you to make good pips on the next down move.
Now if I have a couple other really good reasons to enter earlier after the retracement trend line is broken, like strong fundamental reasons the price should go down and something else like a valid CBL signal, I may enter early knowing I’m taking some additional risk. If I think the additional risk is large, I’ll often mitigate that risk by entering 1/2 lot with a tight stop and put the other 1/2 on when the candle closes forming the new lower low, which is the real price action signal. But many times I should have waited until I knew I was right and I take a loss for being too impatient. In this business we are paid to be patient.
So the point is, different people will draw trend lines at a little different point and there is no way for the market to know where you drew yours. Unfortunately, price does not move in nice straight lines and you constantly have to adapt and adjust to that fact. So the trendlines are something we make up to help keep up with moves on many pairs, but price making a new lower low is a solid price action signal. Since everyone trading will see it the same, it is a much more reliable entry signal.
Did I answer your question?
I think you did
I just keep thinking about second and third reson to enter.
First reson is trend line (its classic and I like it), second which could be CBL dont work for me well.
Fundamentals are good for long investments. I dont do it yet.
Do you think stochastic could be a reson? :rolleyes:
Graviton, tell me please how oil spill in the Gulf of Mexico along with tornado is affecting the TX beaches and all the coast? Is it really worst?
interesting which state in usa is safest from tornados and twisters?
well, thanks for every answered question
enjoy fireworks and happy 4th of July to you and to everyone who celebrates
I will now begin to present the much promised stop loss analysis tool. The purpose of this tool is to let you know if your stop loss is too large or too small for your trading method. If your stop loss is too large or small for your method, you have two choices, change your stop loss, or change your trading method. I’ll begin with an introduction and then proceed to calculations charts and graphs. You can do all these calculations and graphing with pencil and paper, but it’s much easier with a spread sheet program like Excel. I won’t be able to answer Excel questions here, but there is lots of free help and tutorials on line. So let’s get started.
The first step will be a very rough look at stop loss performance. We will then drill down on this and get more precise as we go along. If you’ve been keeping trading logs for a long time, you should have lots of data sets for this. If you haven’t collected the data, now is the time to start. For this first step, you will only need log data on stop loss settings and pips won or lost for each trade which should be available in just about any trading platform’s trading logs. Before we get into the heavy lifting of charts and graphs and calculations, let’s take a moment to look at what a stop loss is for, and more importantly what it isn’t for.
A stop loss should be used to protect your trading capital, and once you have a good profit in a trade, to protect your profits. That should be its only use. In most cases you don’t want to use a stop to take profits because the stop trips when profits are at a minimum. You want to take profits when they are at a maximum, or as close to a maximum as you can get. In most cases a stop is useless for that purpose. So in most cases, if you don’t have a profit in a trade yet, the stop loss prevents price from moving sharply against you and making your loss even worse. If you have a good profit, the stop prevents a sharp move from taking all your profits away. A stop loss should be an emergency measure to protect your account balance. In the best trading, you will almost NEVER hit a stop. In the best trading, the only time you hit a stop is when price suddenly and unexpectedly moves sharply against your position. If that happens more than once a week in day trading, you aren’t trading right. Let me explain this more, because it’s important.
If a trade is moving against you on entry, you should recognize it as a bad entry and early exit to prevent more loss. You can always re-enter later if you think you have a better entry point and the basis for the trade was solid. The cost of that is only a few pips in spread and you save yourself from the much larger possible loss of waiting until the stop is hit. If you have a small profit in a trade, and price turns against you, you should early exit with a few pips profit or as near to break even as you can. Letting a small win turn into a large stop out loss is not good trading. If you have a large win, you should let your profits run as long as possible and exit to take profits as near a profit maximum as possible. You should never sit by and watch that good profit waste away until it hits your stop loss. That is not good trading.
If you have read Tymen’s good example of comparing the movements of the ocean to price movements, you can see what I mean. There is a large tide movement that relates to a long term price movement up or down, seen on the monthly and weekly charts. That long term movement can be used for position or swing trading. There are big waves that roll in and out that can be used for day trading, as seen on the daily, 4H and 1H charts, and there are little wavelets that we ignore except for optimizing entry and exit points. Totally ignoring the little wavelets doesn’t make that much difference, but I always use them, as seen on the 1M, 5M and 15M charts, to optimize my entries and exits to squeeze that extra few pips out of every trade. Every pip counts.
If you are day trading, you’ll do better over the long haul if you trade in the direction of the longer term trend, or the tide. Say you are trading up, you want to enter a trade when long term direction is up, or tide is rising, and you want to enter, or put on more lots, when the big wave is at a minimum or in a valley between waves, and to optimize entry enter when the little wavelets are also at a minimum or in a little valley or trough. For day trading, it’s the big waves that count the most. The tide doesn’t have that much effect, but it’s slightly better to trade with it than against it. The little wavelets are the scalpers’ specialty and they can’t make a nice big fat profit for day traders over the long haul, though they can be used for optimization as stated above.
So you’ll want to take profits when the big wave is at its maximum, or as close to its maximum as possible. You also want to take profit when the little wavelet on top of the big wave is also at or near its maximum to optimize. Since a stop loss almost always executes when the big wave is nearer its minimum, it’s worse than useless for that purpose. You’ll need to use other methods to maximize taking profits and we can discuss those separately.
There are lots of things that can be done to reduce stop out losses. Avoiding trading big known news events, obtaining better entries, exiting earlier before the stop loss is hit and other things work well. We can discuss those separately, but for the moment take this challenge. Practice trading one full week without ever hitting a stop loss by making better entries, early exiting and avoiding major news events, NOT by making the stop loss larger. Of course, moving your stop against the direction of your trade to stay in a losing trade is strictly forbidden in my trading system. Making your stop loss larger when you are losing will just cause you to lose more. Trading a full week without hitting a single stop loss AND without making your stop loss larger than you normally do is a huge exercise in trading discipline. If you haven’t developed that discipline yet, now is the time to start. So even if you early exit a bad trade 1 pip before it hits your normal stop loss point, you have been successful in avoiding a stop out loss. As you practice this, you can reduce losses to near zero and what’s left is Break Evens that pay the spread, small wins and huge wins. We like those.
So to conclude this introduction, stop out losses are caused by three things, bad entries, trading big news events where price moves sharply and moving the stop loss to quickly toward the price trying to lock in profits too early, which is really just greed. You can’t always avoid unexpected news, but you can avoid the big expected news events, and most of the time, even on unexpected news, you can still exit before your stop loss is hit, if you are nimble. You’ll make some bad entries, everyone does, but if you learn to simply recognize a bad entry as one that goes against you right after entry, and admit to yourself you have made a bad entry, you can exit those early and almost never hit a bad entry stop loss. Moving the stop loss too soon and too close to the price action is something we will look at in more detail. That’s where the math, charting and graphing will help. We’ll get in to that next, but really, if you think about, understand, and practice the principals discussed above, you’ll achieve 80% of what I have to present without a single calculation or graph.
Any questions?
If you combine a CBL with the break of a retracement trend line, your winable trades should go way up, to like 80 or 90%. But note, a winnable trade isn’t necessarily one that you won. It could go 85 pips up and 20 pips down and you exit at a loss of 20 pips, so we need to first assess if you are getting your share of good entries. So let’s work on that this week.
Yes, a third reason could be indicators indicate entry. I’d prefer to use at least three indicators for that though because any one is so unreliable. Say, Stoch, RSI and MACD all agree it’s a good time to enter. If they disagree, it can’t count.
For us to turbo charge your entries, you need to start tracking your number of “good entries” and “bad entries” to optimize your entry method. I’ll discuss that more in my next post, but it’s very simple. A good entry goes more than 10 pips in your direction before it goes more than 10 pips against you. A bad entry, of course, goes more than 10 pips against you before it goes more than 10 pips in your direction. Mark every entry in your trading log as good entry or bad entry. Let me know your count, say 10 trades, 6 good and 4 bad entries. You will also need to write down the three good reasons to enter every trade, both for those won and those lost. Then I can help you sort this out and optimize your entries to get the highest winning percent possible.
No effect of the oil spill on Texas beaches. They are clean and beautiful. Most of the oil is going North and East of here.
The Hurricane went into Mexico. We had a few rainy days, but it’s gone now and a beautiful day. I’m not sure which state has the least bad weather, but I probably wouldn’t want to live there.
Yes, I enjoy 4th of July, Beer, Bar-B-Que and explosives. A great holiday
Gasanvill, I’m still working hard to answer your question. It’s not a simple question, but I wont quit until it is answered fully and completely. So hang in there, I want to make all this absolutely crystal clear.
Graviton, that was excellent post! I usually let my SL gets hit rather than exiting earlier.
Now i get what you mean by exiting earlier, and re-entering again at a better price, or even at the same price isn’t a bad idea.
Example we get a cbl entry at 100 and SL is at 90. Instead of letting it hit 90 i exit at 95.
If the trade goes my way to 100 again without forming another extreme candle, i will enter and see if it goes my way this time round. Meaning i re enter at 100 again.
If the trade goes against me, i stay away from this pair and find another pair, right?
Thank you, i enjoy little lessons of yours truly.
Let’s review and summarize for a moment. We have seen that stops are only good for one thing, protecting capital from sudden and unexpected spikes against the direction of the trade. But as we drill down we will see that most stop out losses come from other events. There are four main reasons we can suffer a stop out loss. Let’s take them one by one and analyze each. The four reasons are, quick spikes that stop us out of a trade, bad entries that go against us until they hit a stop, good entries that later turn bad and hit a stop, and moving a stop too fast causing it to be hit by normal price action volatility.
Quick spikes come in two types, unexpected and expected. Unexpected spikes come from news events that are not expected, order imbalances, central bank interventions and other events like a large company ham-handedly repatriating large profits from say Euros to Dollars. These unexpected spikes can’t totally be avoided, but we can greatly reduce their effect on our trades.
Totally unexpected news is rare. It shouldn’t hit your trades very often. If we can reduce the stop loss we normally need to stay in good trades, we can reduce the impact of this event. If it’s both rare and has little effect when it does happen, it will have minimal effect on trading. Note also that when these events are news events, often they are some sort of bad news that causes a quick flight to safety, or to the USD. Therefore any trade that is short with the USD on top or long with the USD on bottom is more likely to suffer from these unexpected news events. Knowing that, we are less likely to get hit with these news events if we are careful when shorting the dollar.
We can’t stay out of all those trades since they are half the good trades, but we must be aware of the additional risk they carry. So bottom line, we can’t avoid this problem altogether, but we can seek to minimize its impact by learning how to trade with tighter stops so we suffer less risk when these unexpected events occur. Using wider stops only causes greater loses to occur a little less frequently and is the worst approach to take. After we finish doing everything we can to minimize this risk, then the few remaining rare quick spike stop out losses are just what we will want to happen to keep from exposing out trading capital to possible larger losses.
The other type of quick spike is the expected event. This could be a scheduled central bank announcement, a major release of economic news or some other expected news event. These events are easy to avoid. By going to the Forex Factory calendar and avoiding trading during red flagged events, we can avoid the spikes that regularly occur after scheduled news events. Following economic and political news on TV, Radio and the Internet alerts us to any scheduled economic statements or political statements that could affect our trades. We simply exit before those events and re-enter after the events. The cost is small at just a few pips of spread. Often we don’t even have to pay that cost as we can just delay entering a new trade until after the news has passed.
A final but very important point about sudden spikes is that most of them really aren’t that sudden. In most cases, price starts moving rapidly against you for a known or unknown reason, but it’s not too rapid to exit and protect your capital, you just don’t. You sit there frozen hoping that price will turn around before it hits your stop. The further price goes against you, the more frozen you become. It’s human nature. You need to learn to exit quickly when you see a price spike moving against you. Look at it this way, the cost of exiting quickly is only a few pips spread if price quits moving against you, but the cost of a stop out loss could be 30 pips or more. So you could be wrong about exiting early 4 out of 5 times and right only one of 5 times and still be way ahead. About 90% of price spikes against you are not so sudden you can’t exit early and avoid a big loss. You must practice this over and over to be good at it. Look for reasons to exit early a trade that’s going against you and take every one you can find. In the end, the only time you should ever hit your stop loss is when the price spike is so sudden you couldn’t possibly have reacted in time.
A stop loss is a very stupid but very quick tool. In that very rare case of a spike against you so sudden you can’t react, maybe occurring once or twice every month or so, you must depend on your stupid but quick stop loss to take you out of the trade. In every other case you must learn the discipline to exit manually when a trade is going against you. A stop loss is no substitute for trading discipline. It can actually cost you lots more capital than it saves you if you depend on it to take you out of bad trades because you don’t have the discipline to exit manually. Practice exiting trades before they hit your stop loss. Start exiting 1 pip before a bad trade hits your stop loss, and then move to early exiting 2 pips before your stop loss is hit. Keep increasing your early exit margin and analyze what happens after you early exit until you start to approach a breakeven point. Break out and log your reasons for early exits and analyze which reasons produce the best results and which produce the worst. Become an expert at exiting a trade early to protect your capital. Then you are depending on trading with your brain and not with a very stupid but very fast stop loss.
The second type of stop out losses are caused by bad entries. Let’s define a bad entry as one that goes 10 pips against you before it goes 10 pips in your favor. If it goes 10 pips in your favor and then turns against you, we’ll define as a good entry gone bad, and deal with it next. These bad entries are the most common reason for stop out losses and are easily avoided. I’ll be very direct and even brutally frank about dealing with these losses. It’s easy to identify a bad entry. It goes against you right away after entry. It screams, “BAD ENTRY, GET OUT!” But we don’t want to hear that, do we? We sit and wait and hope against hope that price will turn around and not make us feel so foolish while price continues to go further against us until it finally hits our stop and we resign ourselves to a big stop out loss. Why? Because we don’t want to admit we were wrong.
It’s human nature. Sometimes, price will turn around and we will win even though it was a bad entry. That feels good, to get a win when we thought it was a sure loss. It feels so good; we’ll take many large losses just to feel that good a few times. Exiting early with 2 pips won or lost doesn’t feel that good at all. In fact, it feels just about as bad as taking a large loss. So we plod merrily along, taking many large losses and hoping to feel good about a win eventually. The simple fact is, winning at trading isn’t about feeling good. Winning at trading has nothing to do with how it makes us feel. If it makes us feel sick to the point of heaving up lunch, winning is still winning. If losing makes us feel great and we can have a huge pity party for ourselves afterward, and our friends and relatives join in with lots of pity and we feel loved and cared for, losing is still losing.
To deal with bad entry stop out losses we should first try to avoid the cause, bad entries. Of course, everyone wants to avoid bad entries, but very few will want to carefully analyze their entries to see if there is a pattern to them. Those few traders who analyze and perfect their entries can become professionals. The others will never improve. It’s easy to analyze your entries. I’ll give you an example and you can adjust it to suit your method. For every trade, classify the entry as a bad entry if price moves 10 pips against you before it moves 10 pips in your favor, and the opposite for a good entry. Write the reason(s) for entering every trade in your trading journal. Also write any concerns you have about the trade at entry. Then each weekend, analyze your good and bad entries. As you perfect this for your trading method, you’ll find patterns in good and bad entries. Bad entries will share the same concerns and are made off similar unreliable trade signals. Good entries will share the same reasons for taking the trade and will lack certain concerns. By adjusting your trading plan you can work week after week to increase your good entry percent and reduce your bad entry percent. Reaching a good entry percent of 80 to 90 % is quite achievable and we can discuss this further in later posts if you like.
In the end though, hardly anyone will reach 100% good entries. But after many weeks of study and improvement you will become an expert in recognizing a bad entry. So what do you do about it when you find yourself in one? The best way to deal with a bad entry is to early exit. Never wait until price creeps up to your stop loss point and stops you out. That’s not what your stop loss is for. Your stop loss is stupid. It’s only function is to take you out of a trade in case of a sudden and unexpected spike against you. Once you’ve learned to recognize bad entries, and you have developed the trading discipline to early exit from them, you need never hit a stop loss again from a bad entry. You should set a goal for yourself to never hit a stop loss because of a bad entry. It can be achieved if you practice.
I need to take a break now to run some errands. When I return, I’ll analyze the last two reasons for stop out losses, good trades gone bad and moving the stop too close to price action. We’ll then summarize everything we’ve covered and set up very specific measuring tools to measure our progress at improving in every category of reducing stop out losses to a goal of zero. Of course we will never quite get to zero, but that’s the goal and that’s how we will measure our progress.
Any questions?
I’m glad you are enjoying this lesson on optimizing stop losses. This is a complex subject, but we will end up running this all the way to the ground. We’ll optimize our stop loss settings and reduce stop out losses to the bare minimum for any trading style or method. We’ll accept nothing less than total victory over this four headed beast.
To paraphrase JFK, we don’t choose to do this because it’s easy, we choose to do it because it’s hard. Great challanges produce great outcomes. So let’s soldier on.
Thank you Graviton for the answer! I see more thing clear now!
One of the worst things that can happen is to let a winner trade become a loser! i find your method really useful, because sometimes the trendline is never broken for days! and you can end up with a risk reward ratio of 1:4 or even better!