This is my way of trading and to help me stick with sticking to my rules and strategy, I’ve decided to start this up to stop me from thinking “I’ll just give this trade a go and see where it goes.” I trade off the 4 hour charts which are at 10, 2 and 6 am & pm (GMT), looking for long wicked candles (LWC) that bounces off either a psych level (00’s & 50’s), S/R line or flip zone.
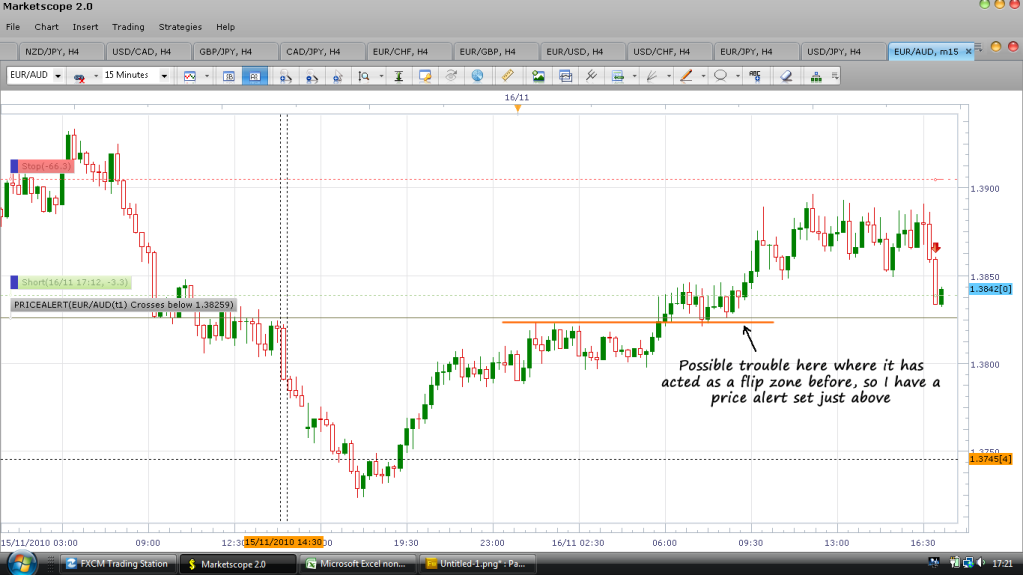
Once I’ve seen a potential set up, I then have a quick look at the 15 min chart to see if there’s going to be anything stopping my trade in the first 10/15 pips or if there’s any other reason why it might not work.
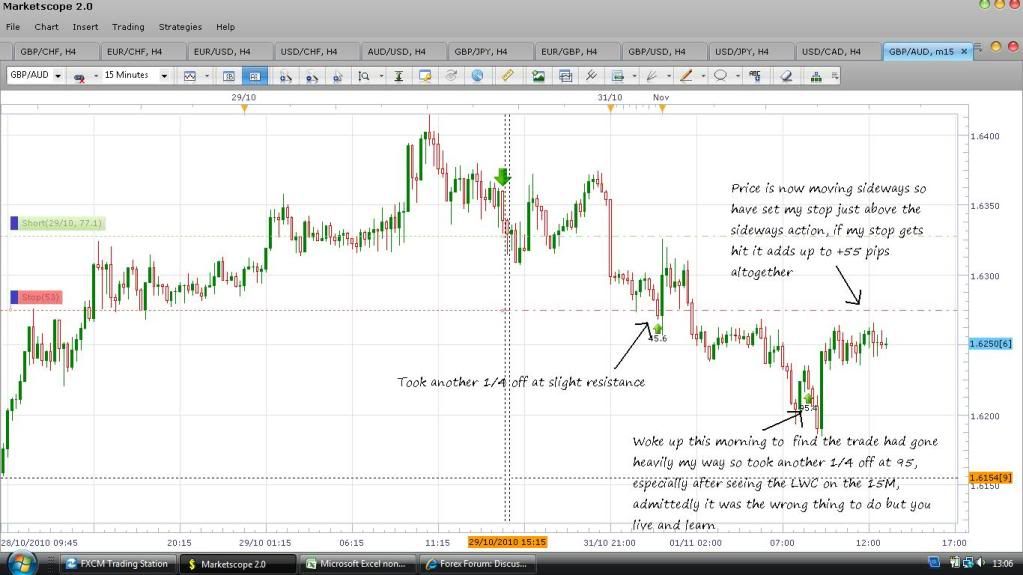
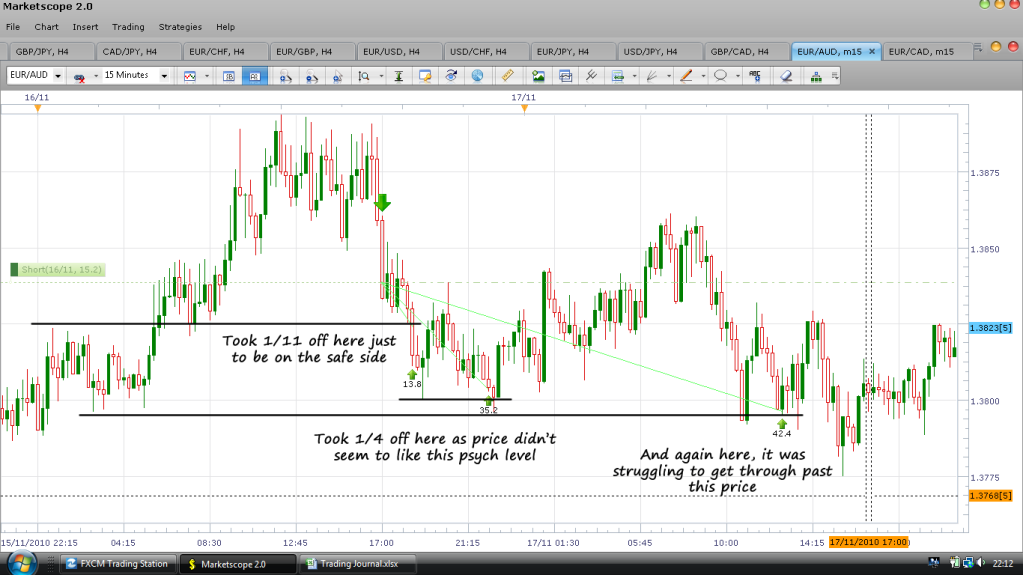
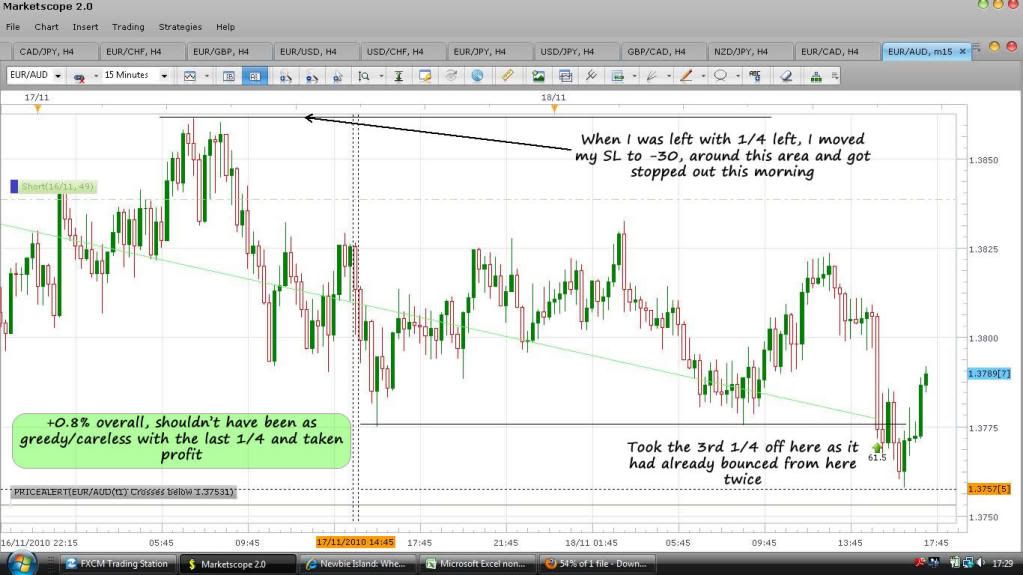
I usually end up splitting the trade up into quarters as I can’t stand seeing a trade go from +20 and turning against me so taking money off the trade at important levels is quite important from me. My stop will be at the other end of the LWC, possibly higher/lower if the S/R or whatever is a few pips higher/lower. I tend to think about if the trade went against me, what would be stopping it from hitting my SL so the more factors there are, (S/R, flip etc) the better. I see those factors as my last form of my defence and have had a few trades move to within 10 pips or so of my SL before moving my way and becoming a decent trade.
I’ve print screened my most recent trade on USD/CAD last week, had a SL of 53 pips and ended up with +55 pips altogether
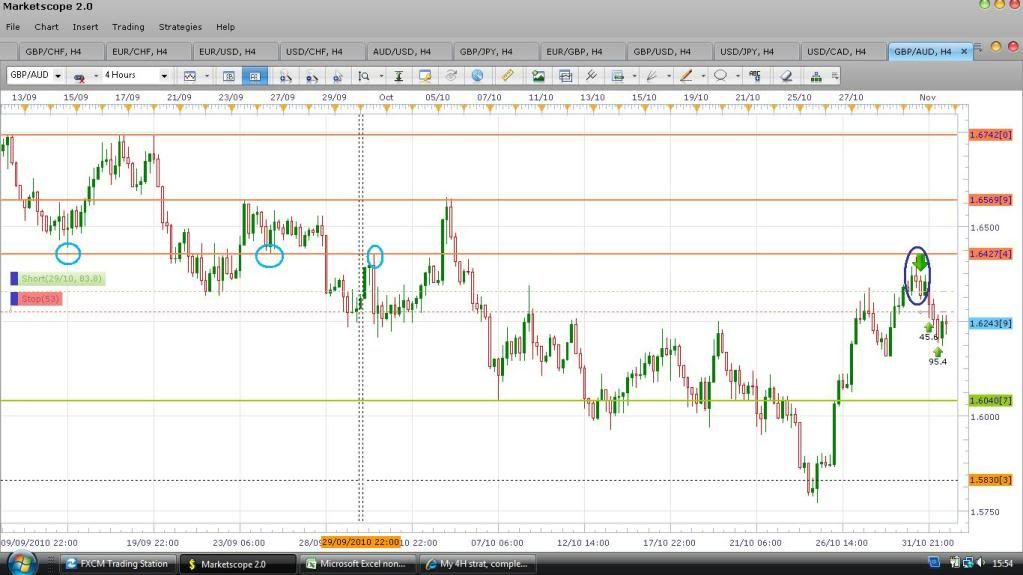
And just to add to this, I’ve just gone short on GBP/AUD looking for 1.6318 as the first port of call
I’ll be posting my trades but chances are, it won’t be a daily thing, I only took one trade last week (The one I’m still in) but I’ll still try and keep things up to date
Yeah, sorry I got mixed up and thought I posted a 4H chart in the first post.
It might look different on your chart as the candles might close at different times but on mine, you can see where I’ve circled all the times price has rejected the 1.6427 line before my LWC bounced straight off the line
Edit: Got stopped out last night, unfortunately, just before another huge 200 pip move but it did get held up at the 1.6040 line you can see on my charts.
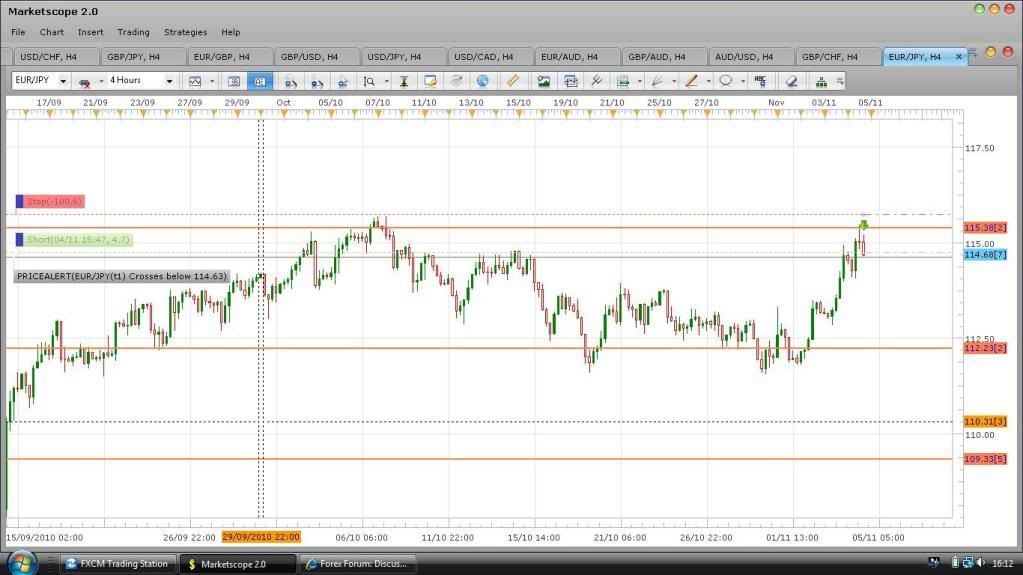
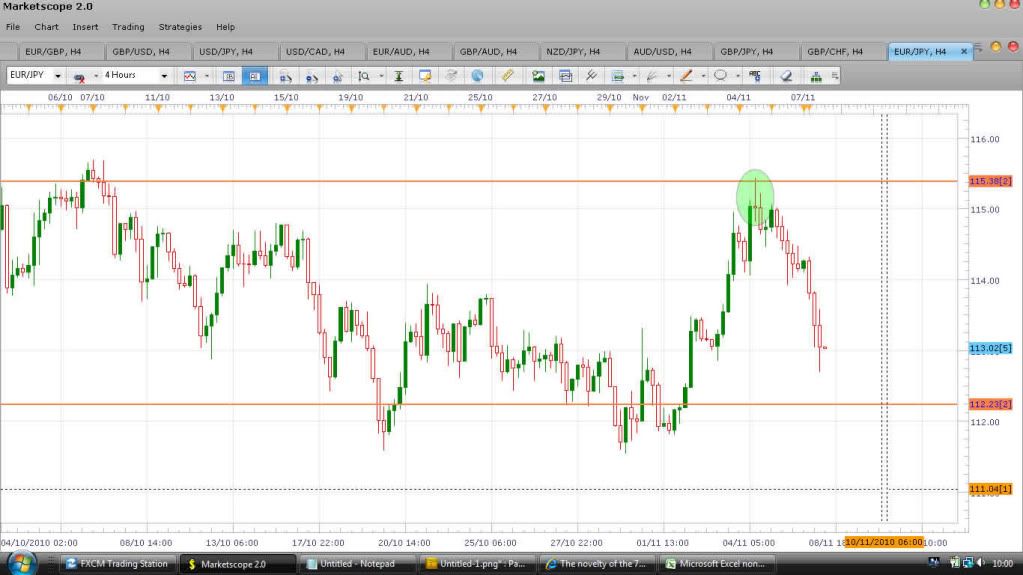
Just gone short on the EUR/JPY after a LWC off of resistance, looking at the 114.63 level at first and will hopefully get 1/4 off at +10 or so before changing things around
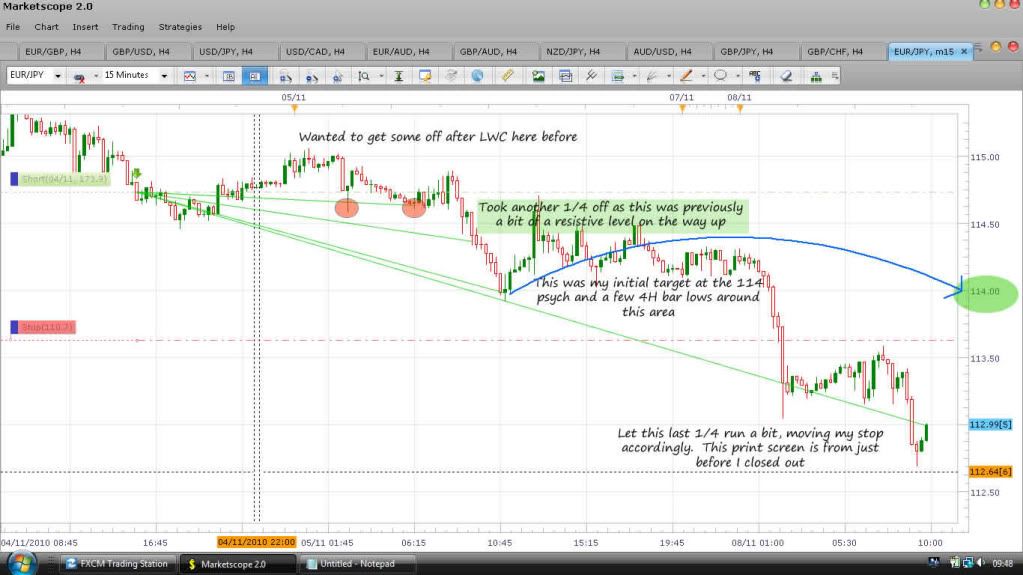
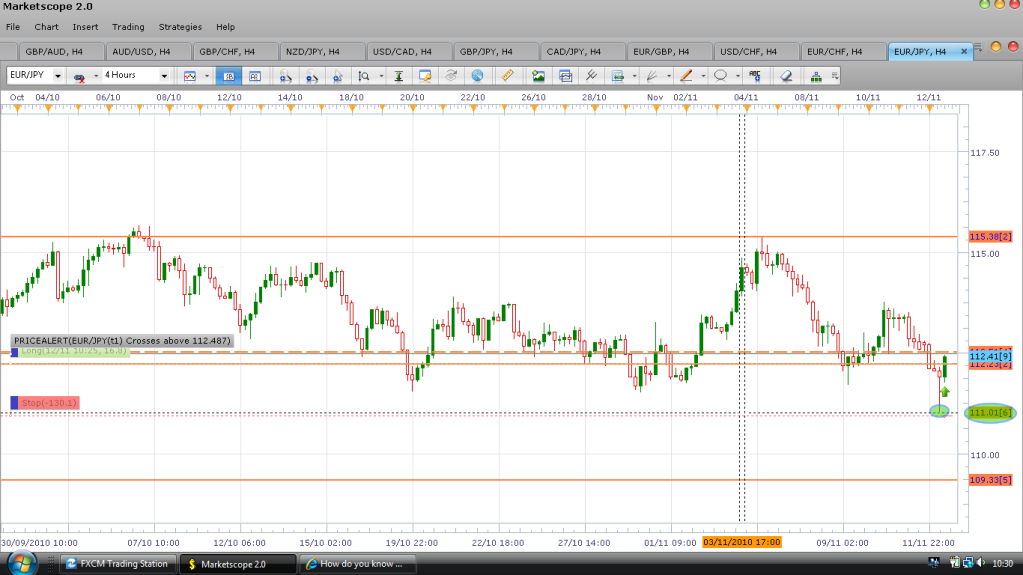
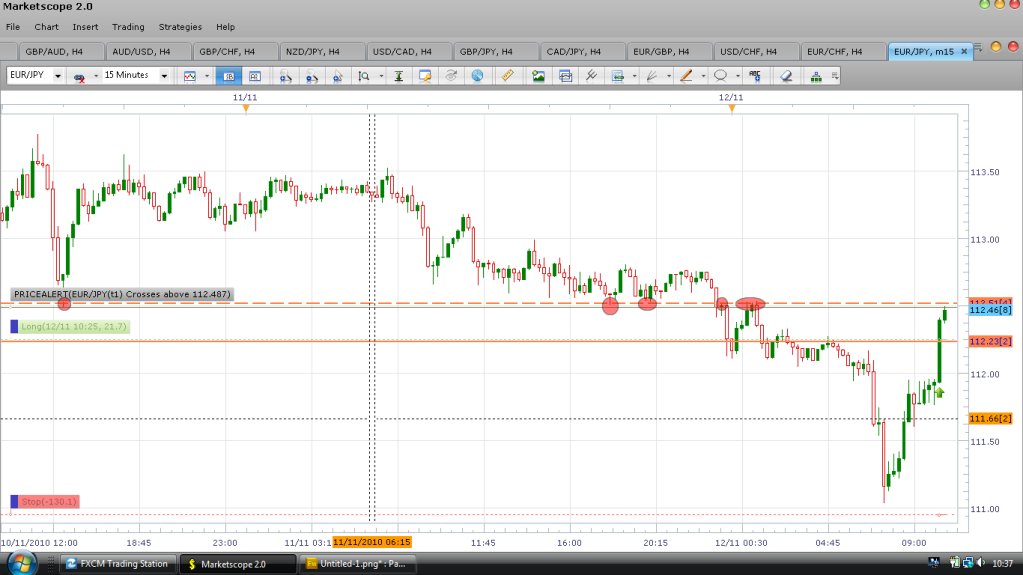
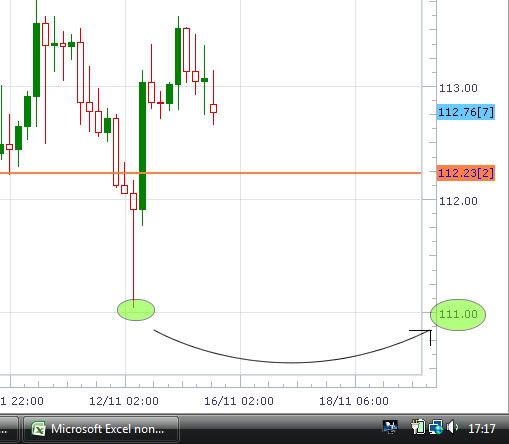
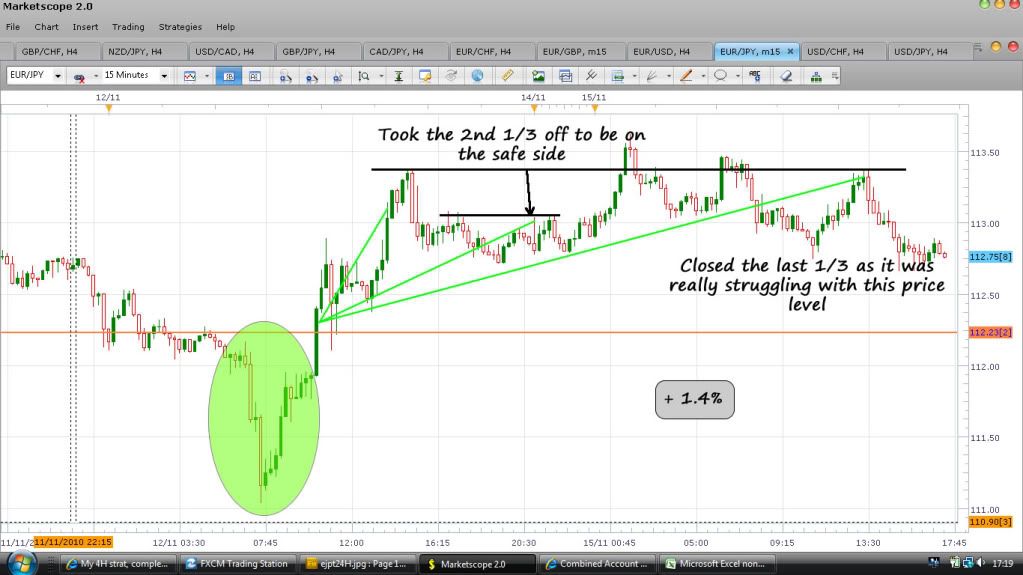
Went long on the EUR/JPY after a LWC bouncing off 111.00 psych level and it shot up faster than I expected which is why the print screens are mid-trade, anyway, here they are:
My initial target area was the .50 level where my price alert is but with the amount of momentum it had, I’ve just let it run a bit more and currently +45 pips up with all lots still in trade. Next potential problem area would be 113.00 as its another 00 psych level and a couple of 4H bars have bounced from that area
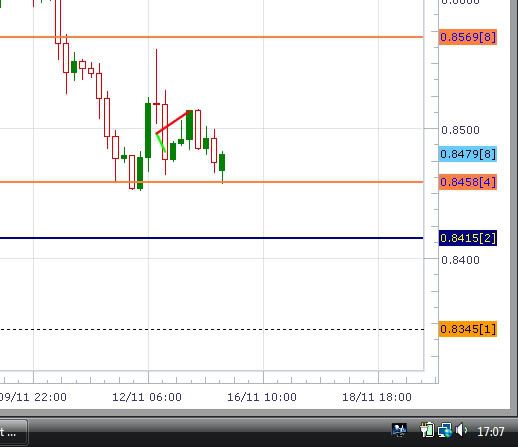
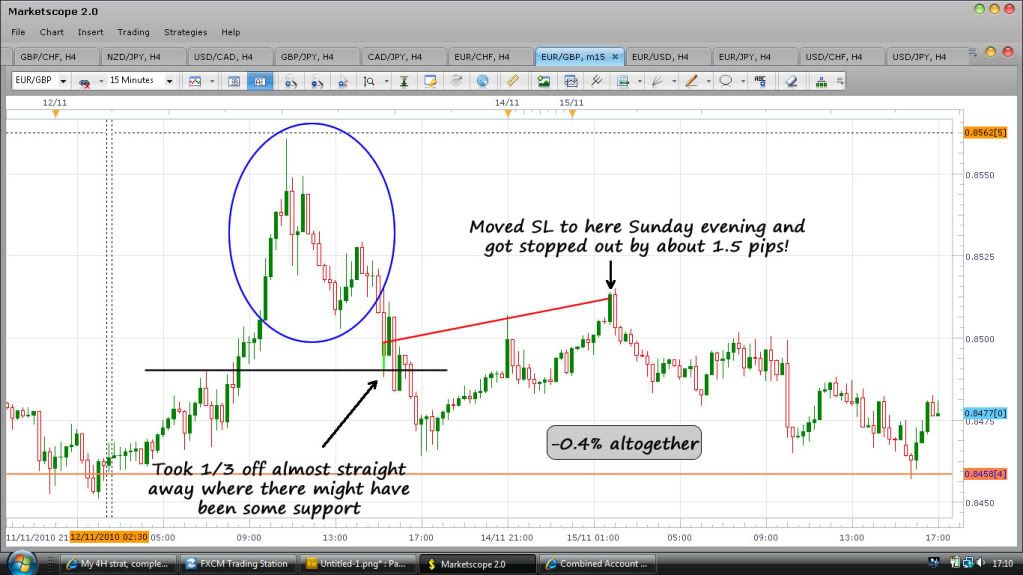
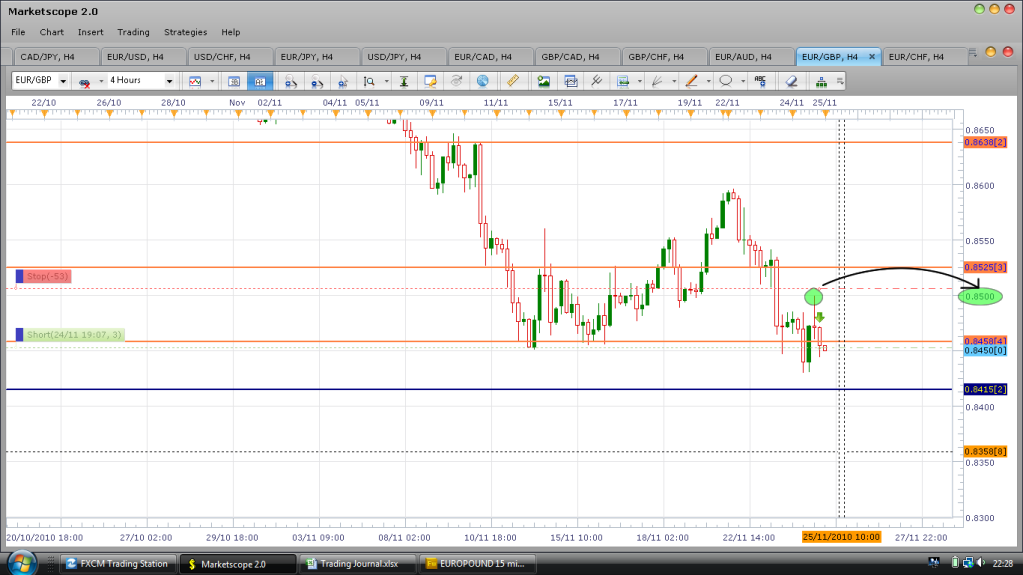
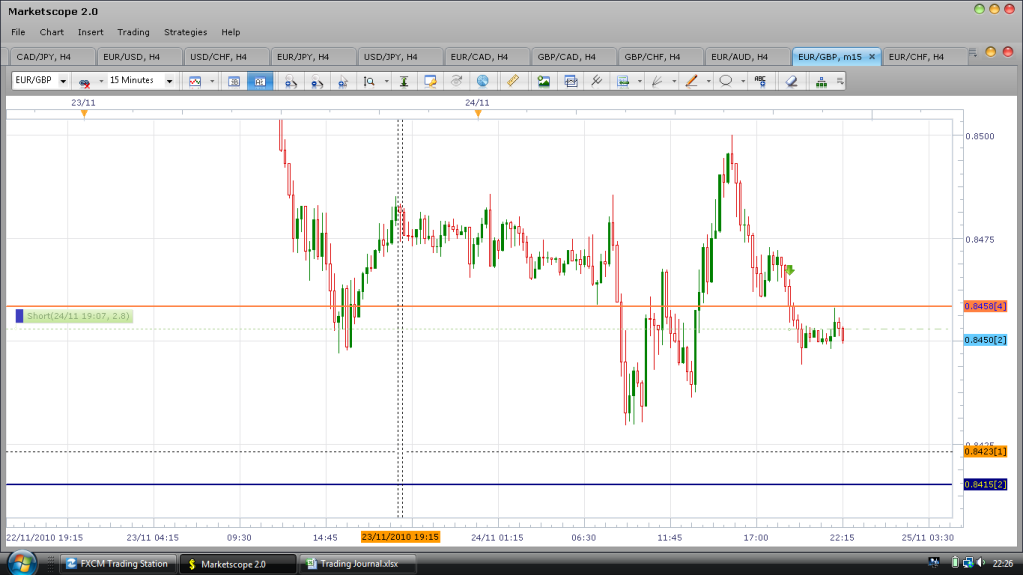
Edit: Also short on EUR/GBP now, looking at 0.8487 and beyond!
Hi MikeTye,
Interesting thread. I am a trying to learn/apply Price Action so I will follow your thread. Can you please give more details about the “bouncing lines”?
What pairs do you trade?
Thank you!
Windsurfer, all I mean by bouncing is when it hits a level and bounces, and you can see a clear reason why it bounced, ie S/R level or psychological level. But to be sure its a decent set up, I’ll take a look at areas that the trade could struggle at which is quite often where the 15 min charts come in handy, so if it looks as though it might start struggling almost straight away, I won’t bother with the trade and wait for a better set up.
I trade whatever pair has a good setup, but mainly keep an eye on 17 that have are used by FXCM and have reasonable spreads
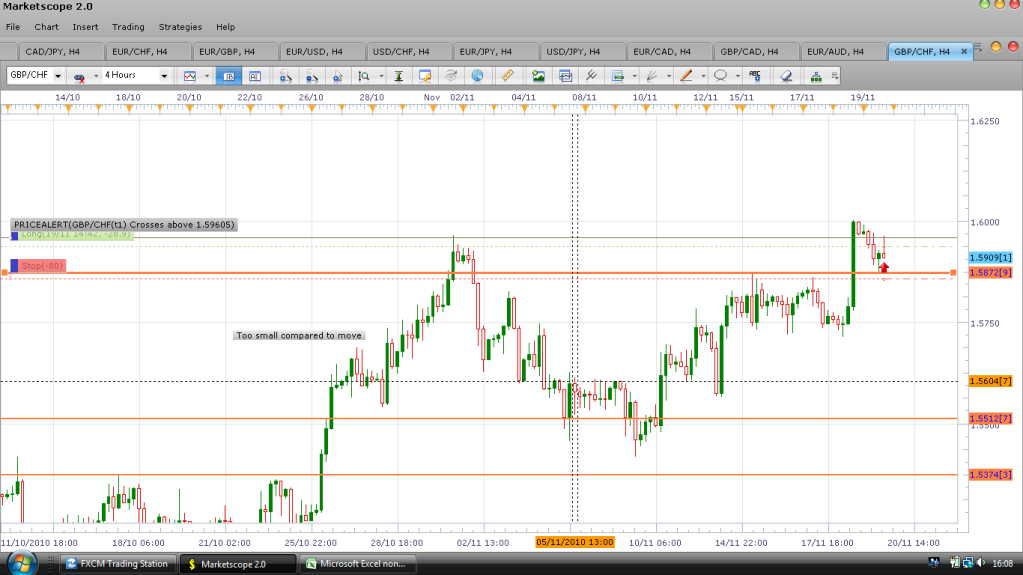
I’m long on GBP/CHF, bit of a PITA that I chose this afternoon to do other stuff so missed it hitting my first target but still expecting it to come back in my favour
Got stopped out on that last trade for -2% which is a bit of a blow but I can at least say that it did what I expected it to do, just a bit of bad fortune!
:mad: Did the thing I was trying to stop myself from doing with this thread! Took a trade that I knew what would happen but hoped that it wouldn’t. Ended up with -1.4% on the EUR/GBP trade