Hope all is well. I’ll try my best to explain everything and how I view a trade set up. Feel free to ask questions and bounce ideas off one another. Look forward to some opinions and different views.
First thing is…
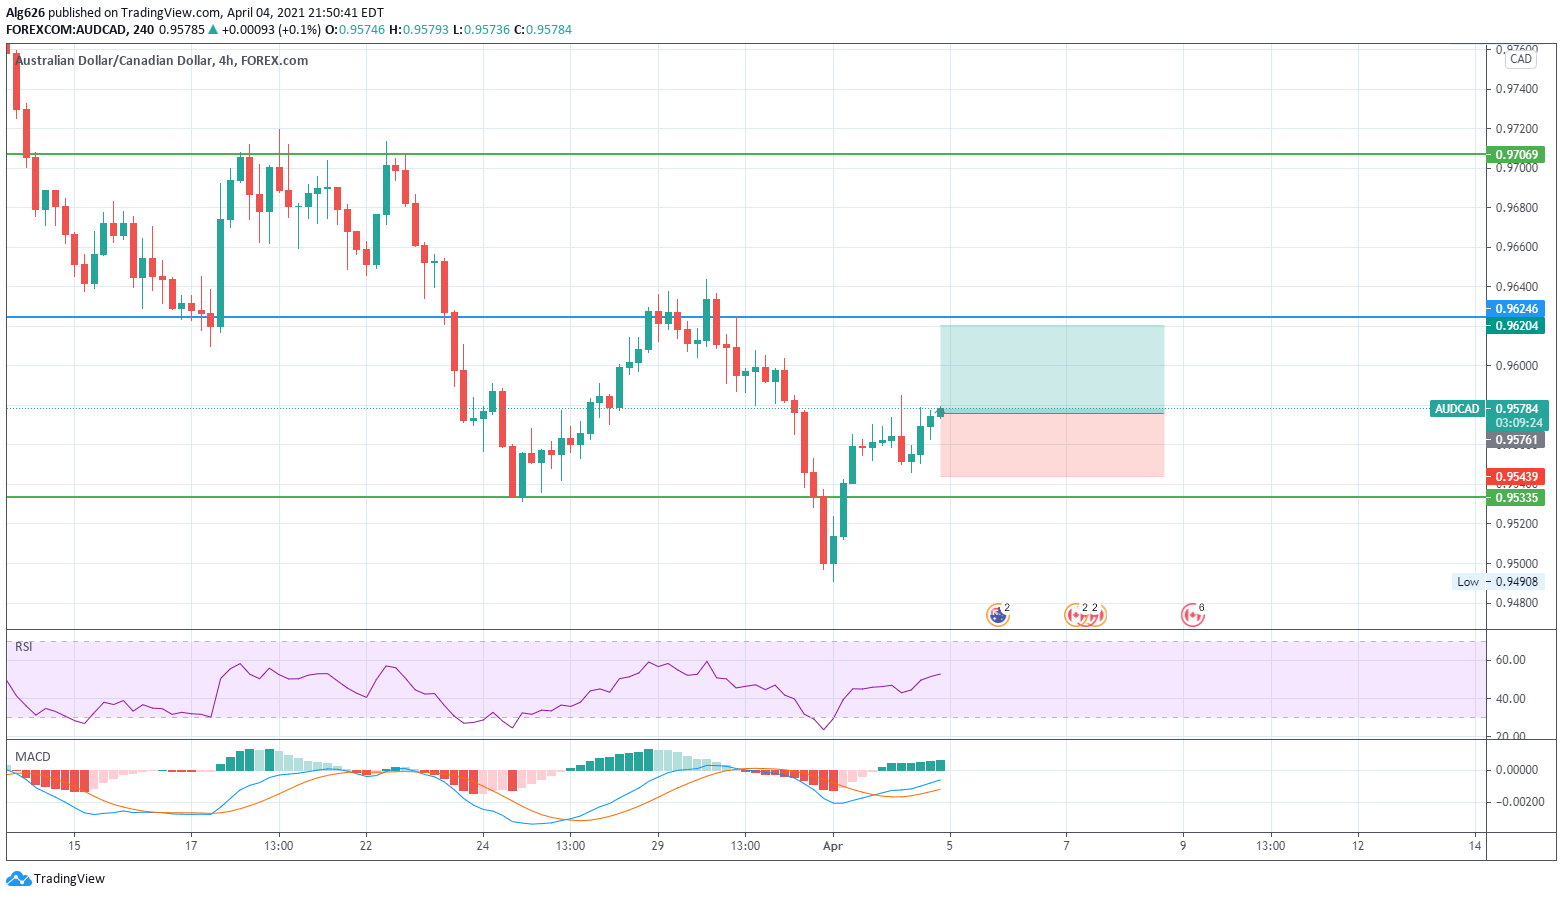
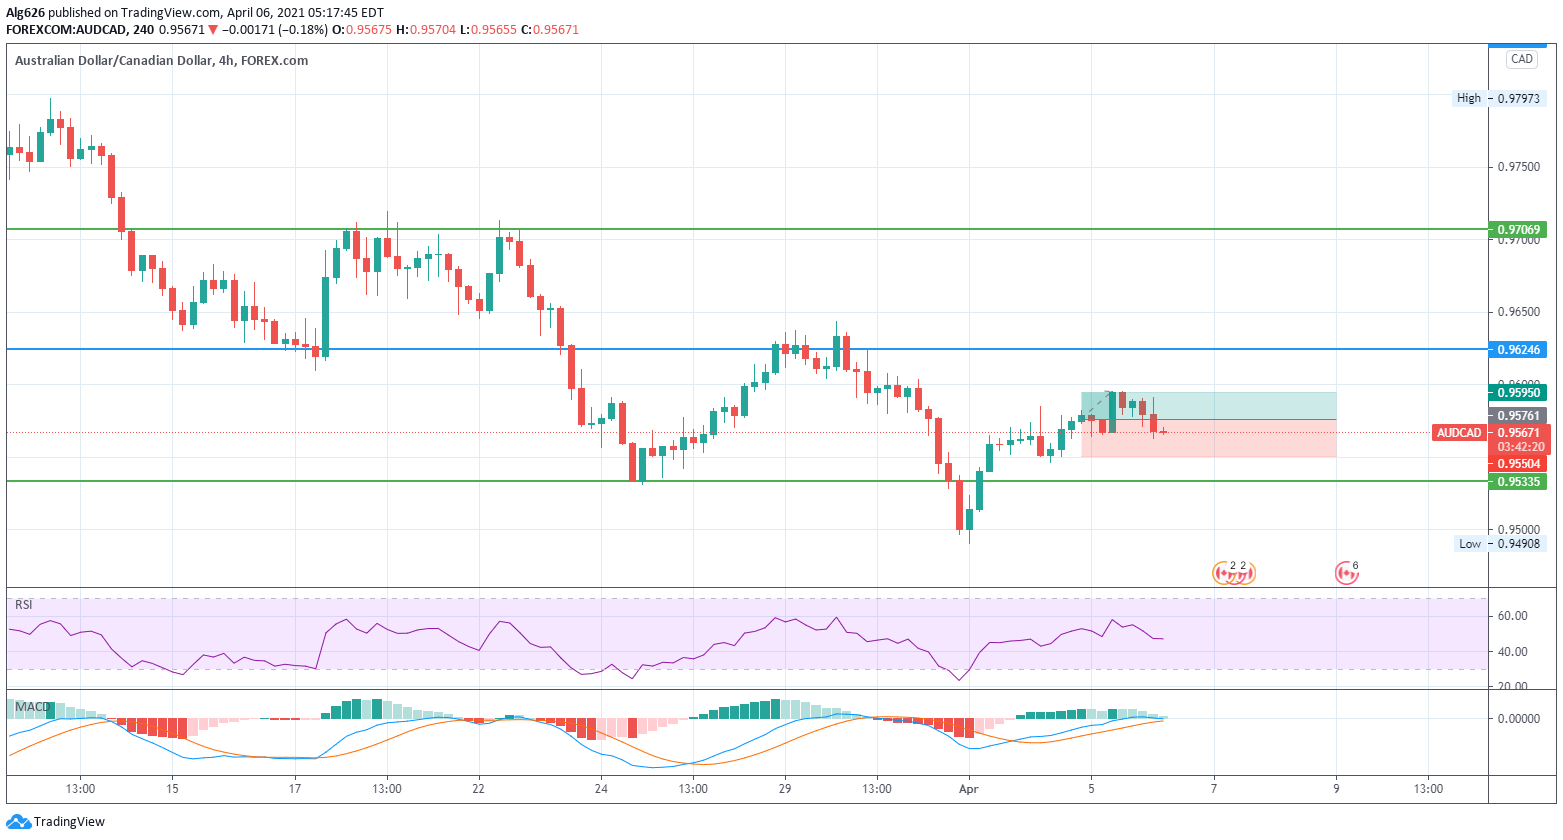
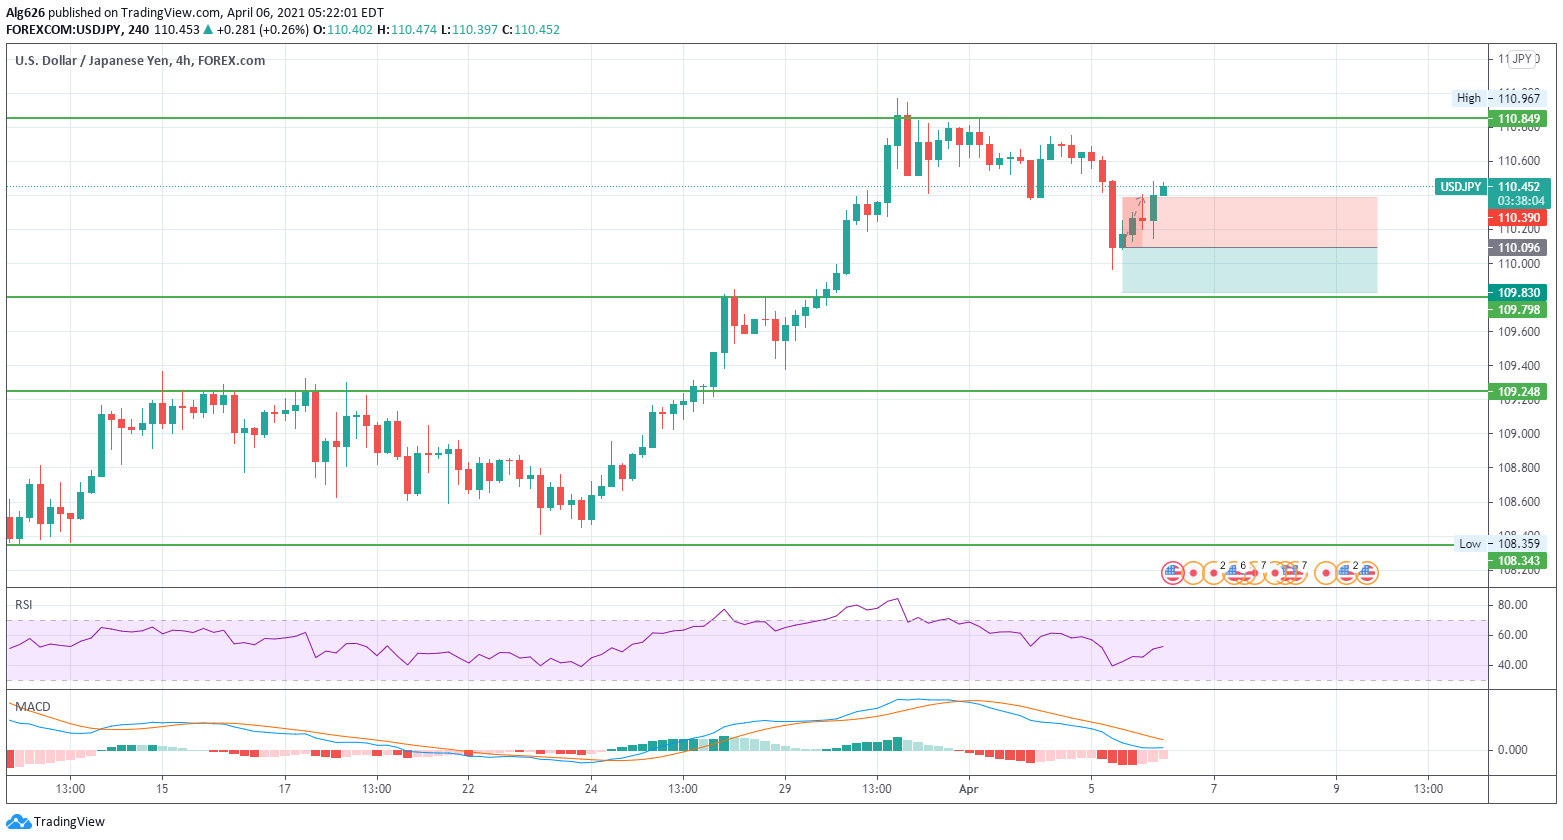
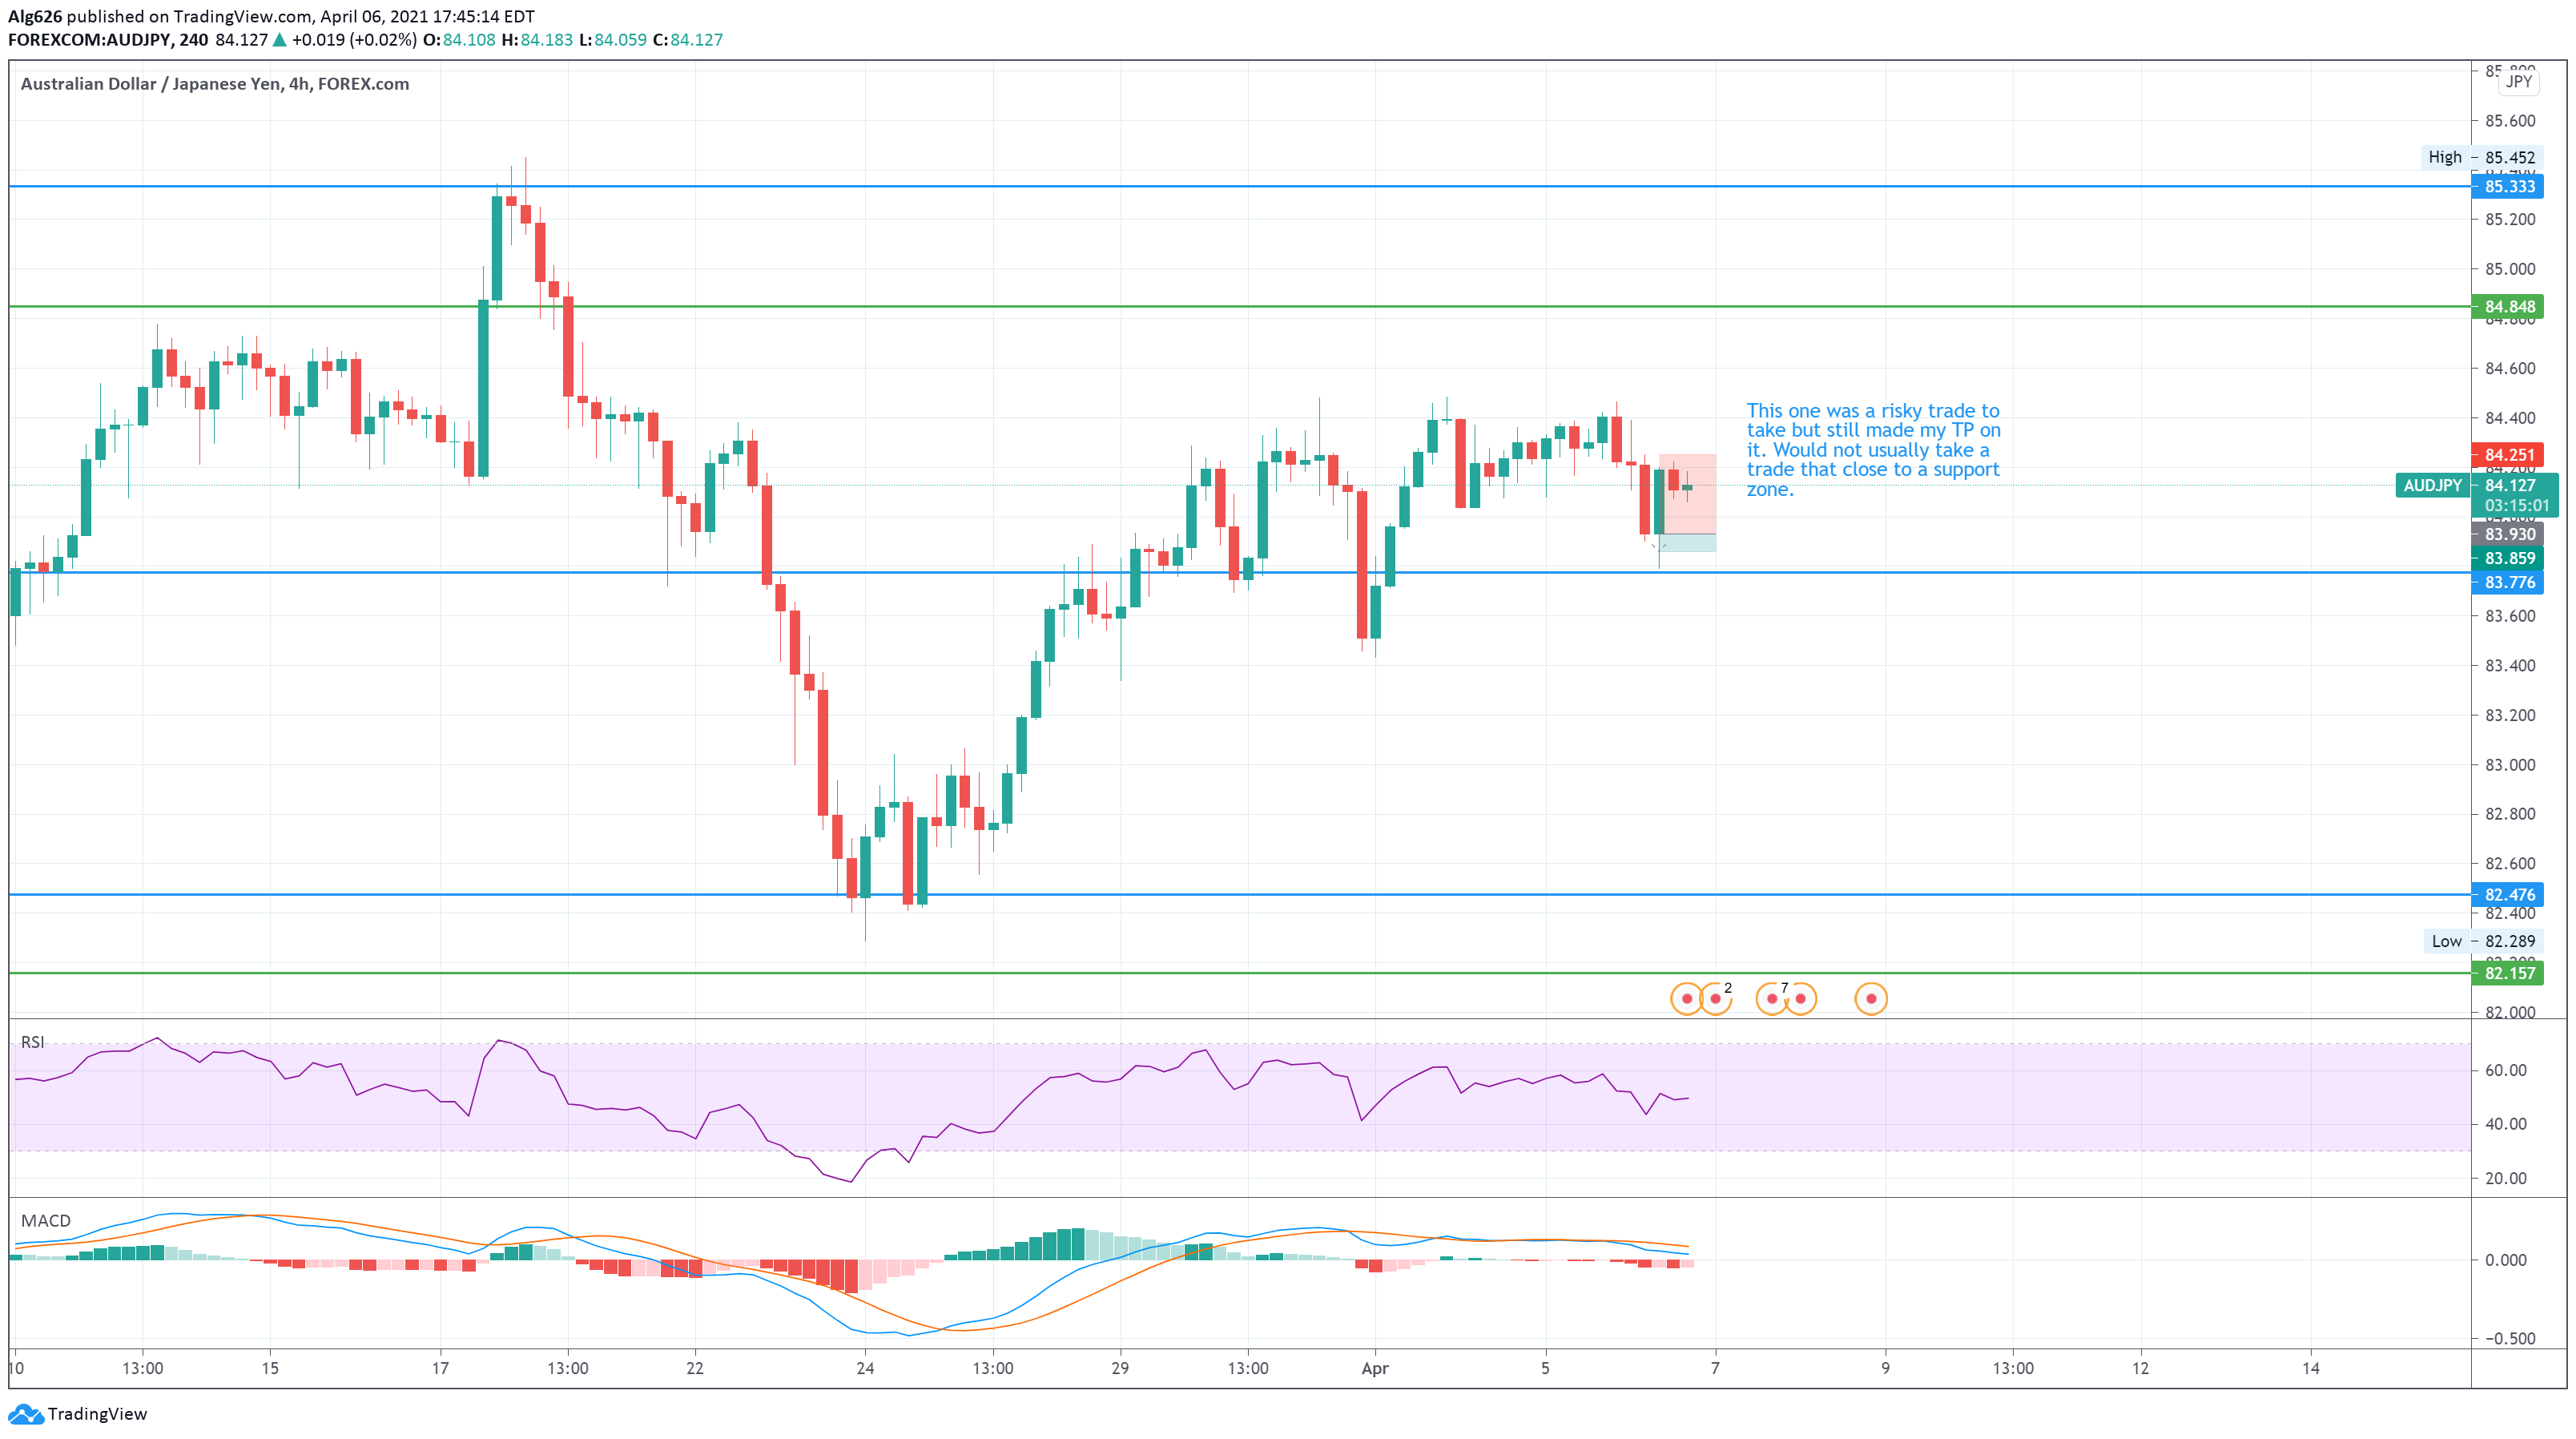
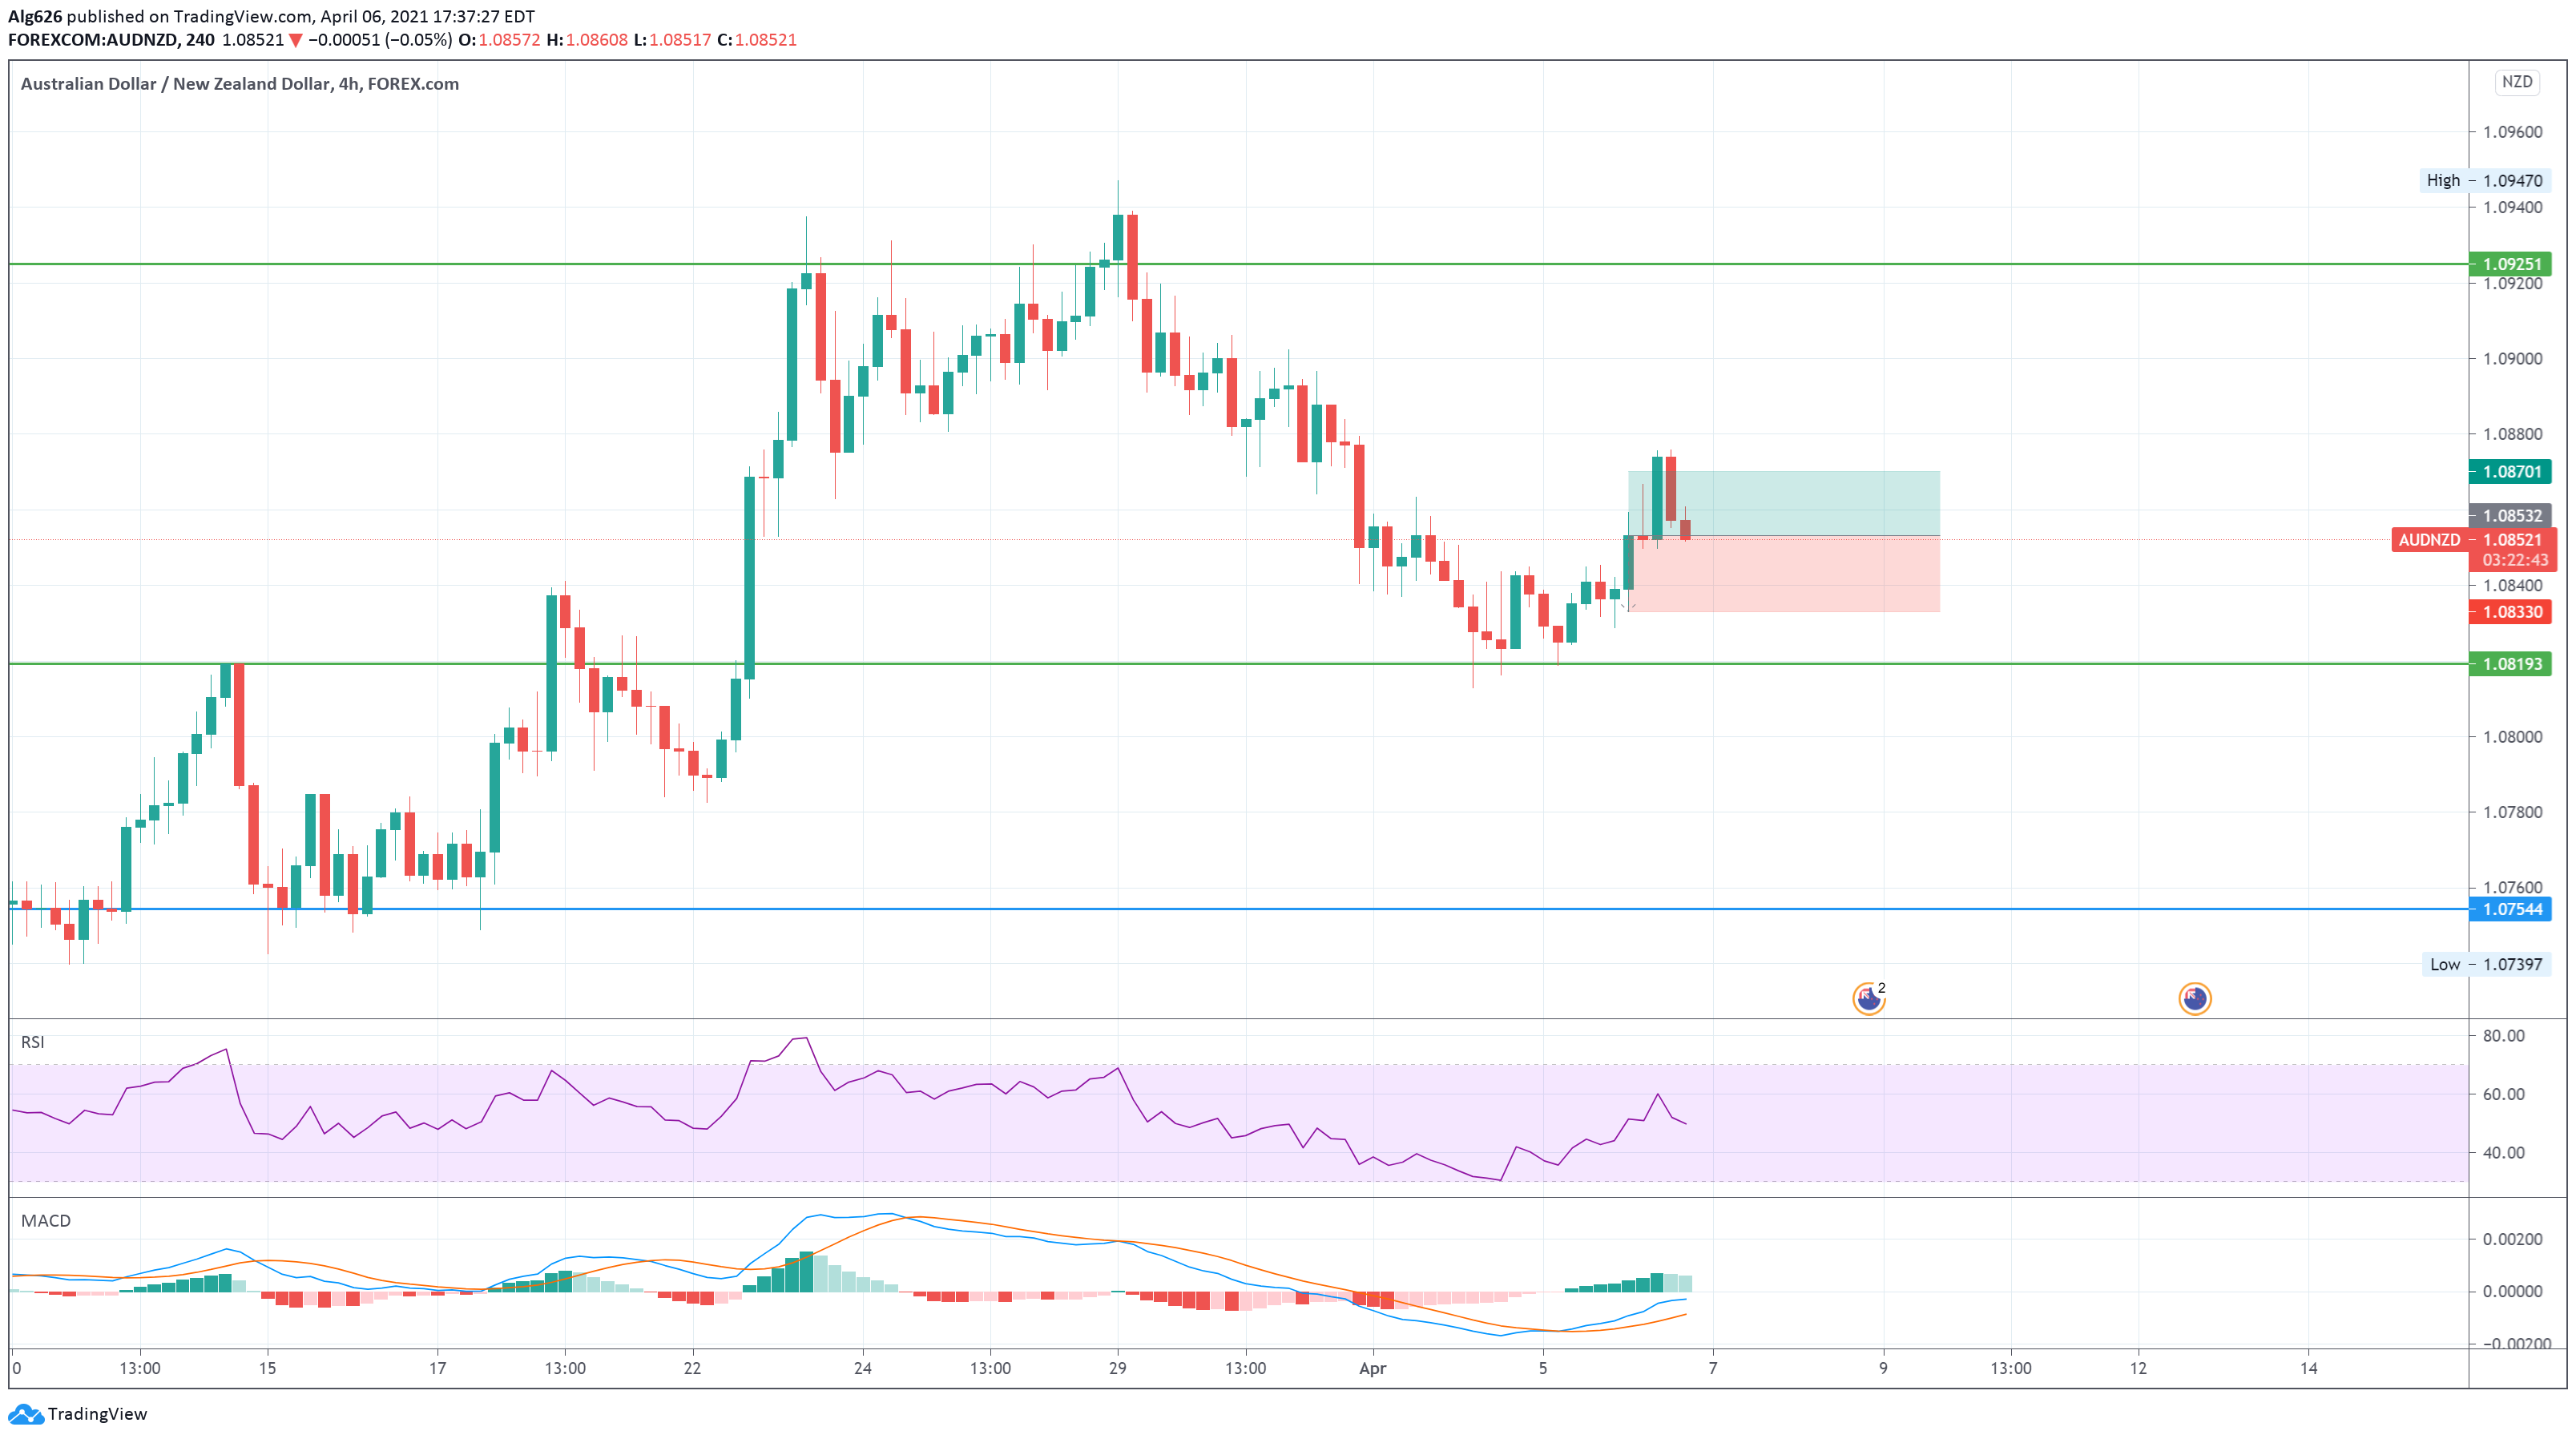
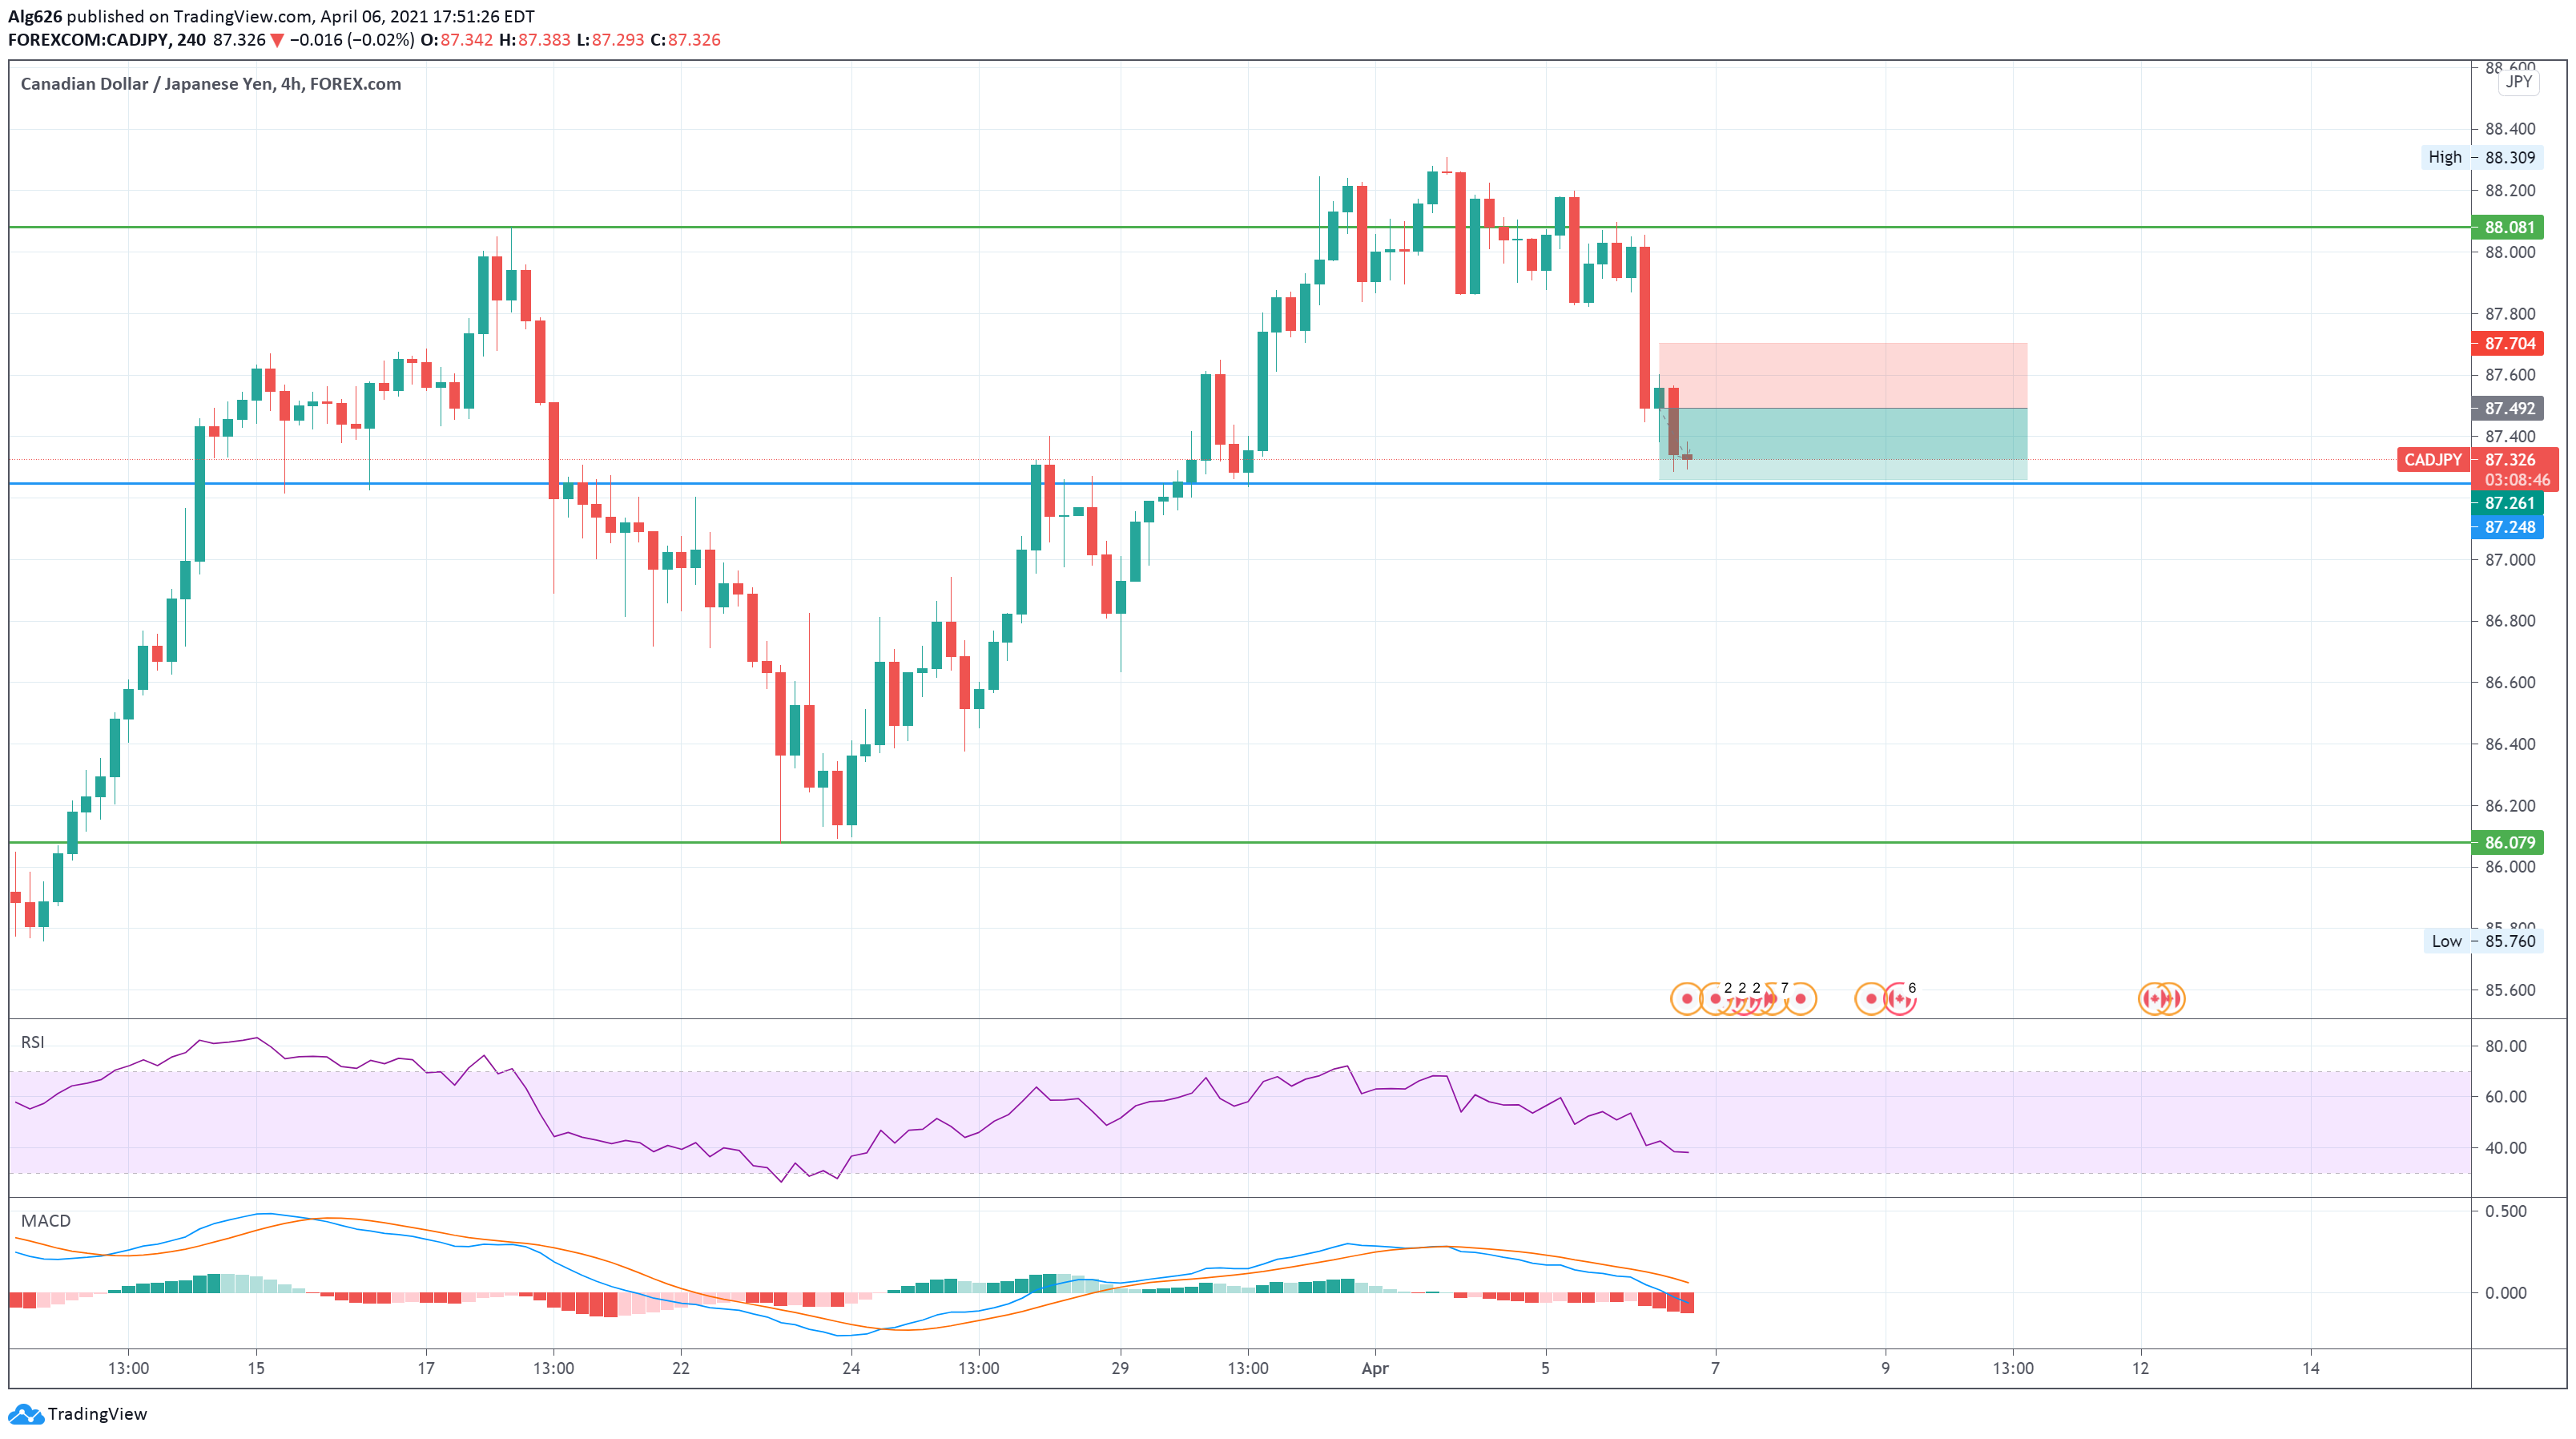
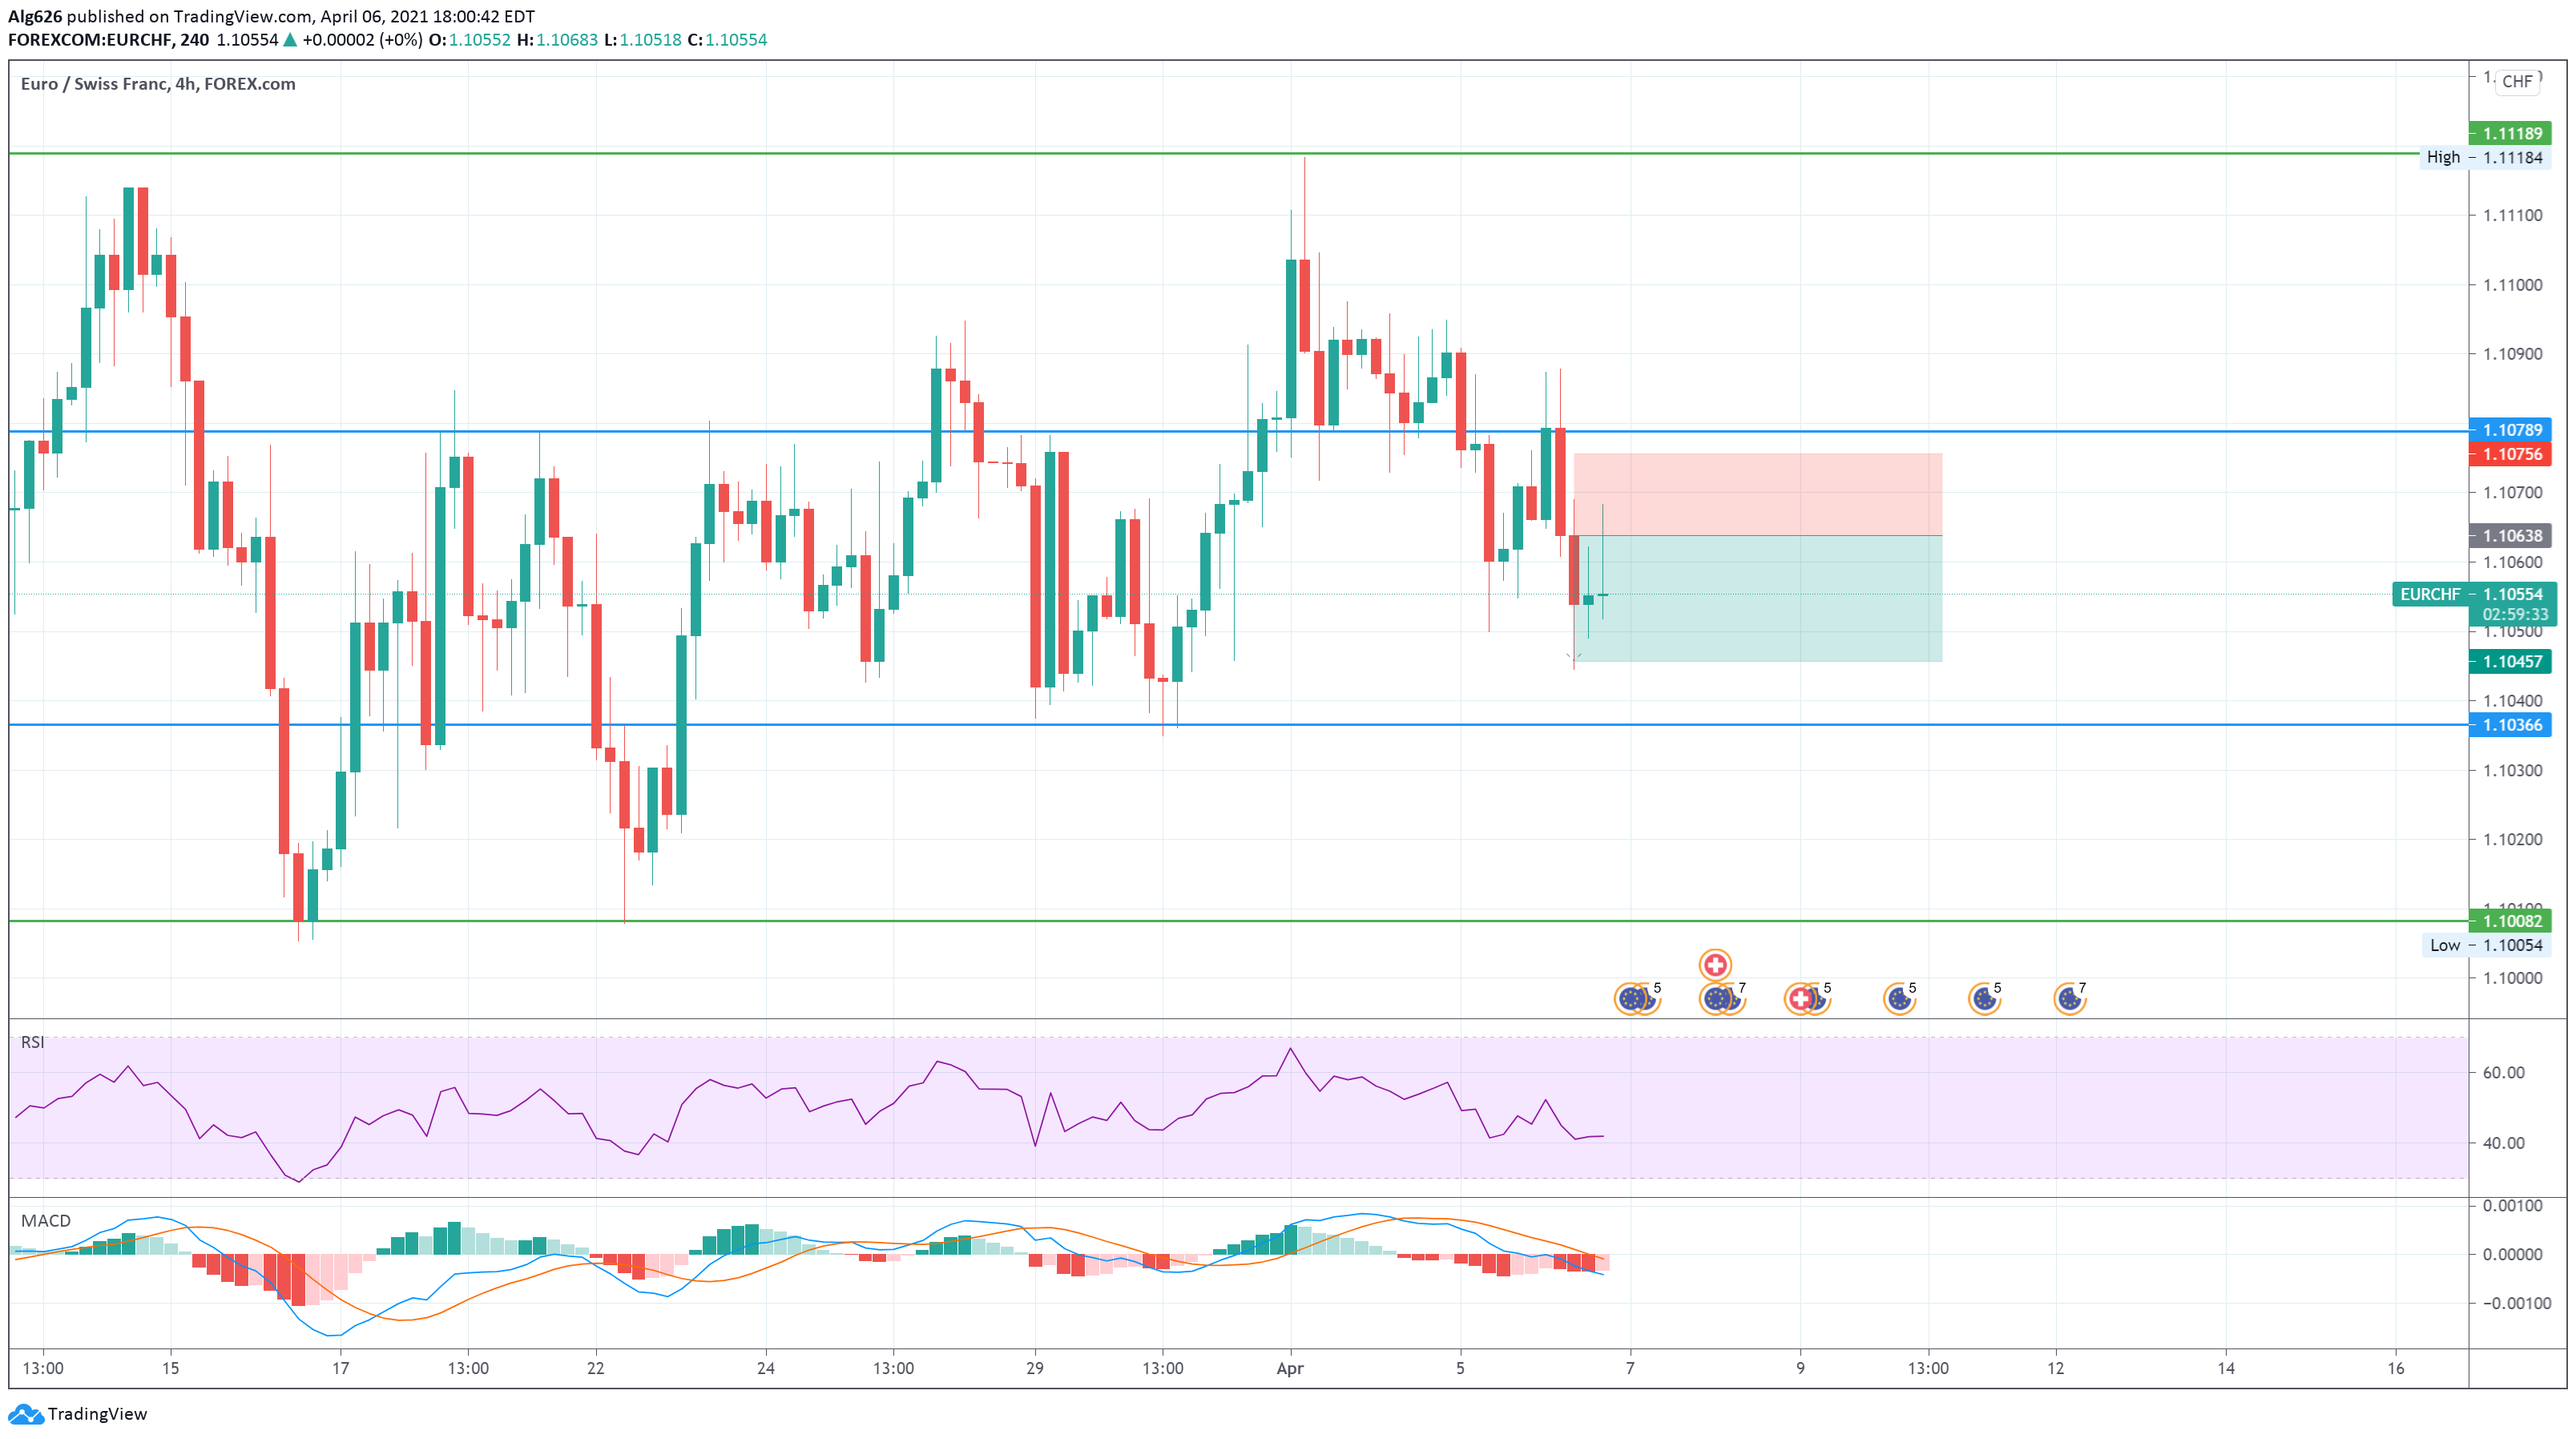
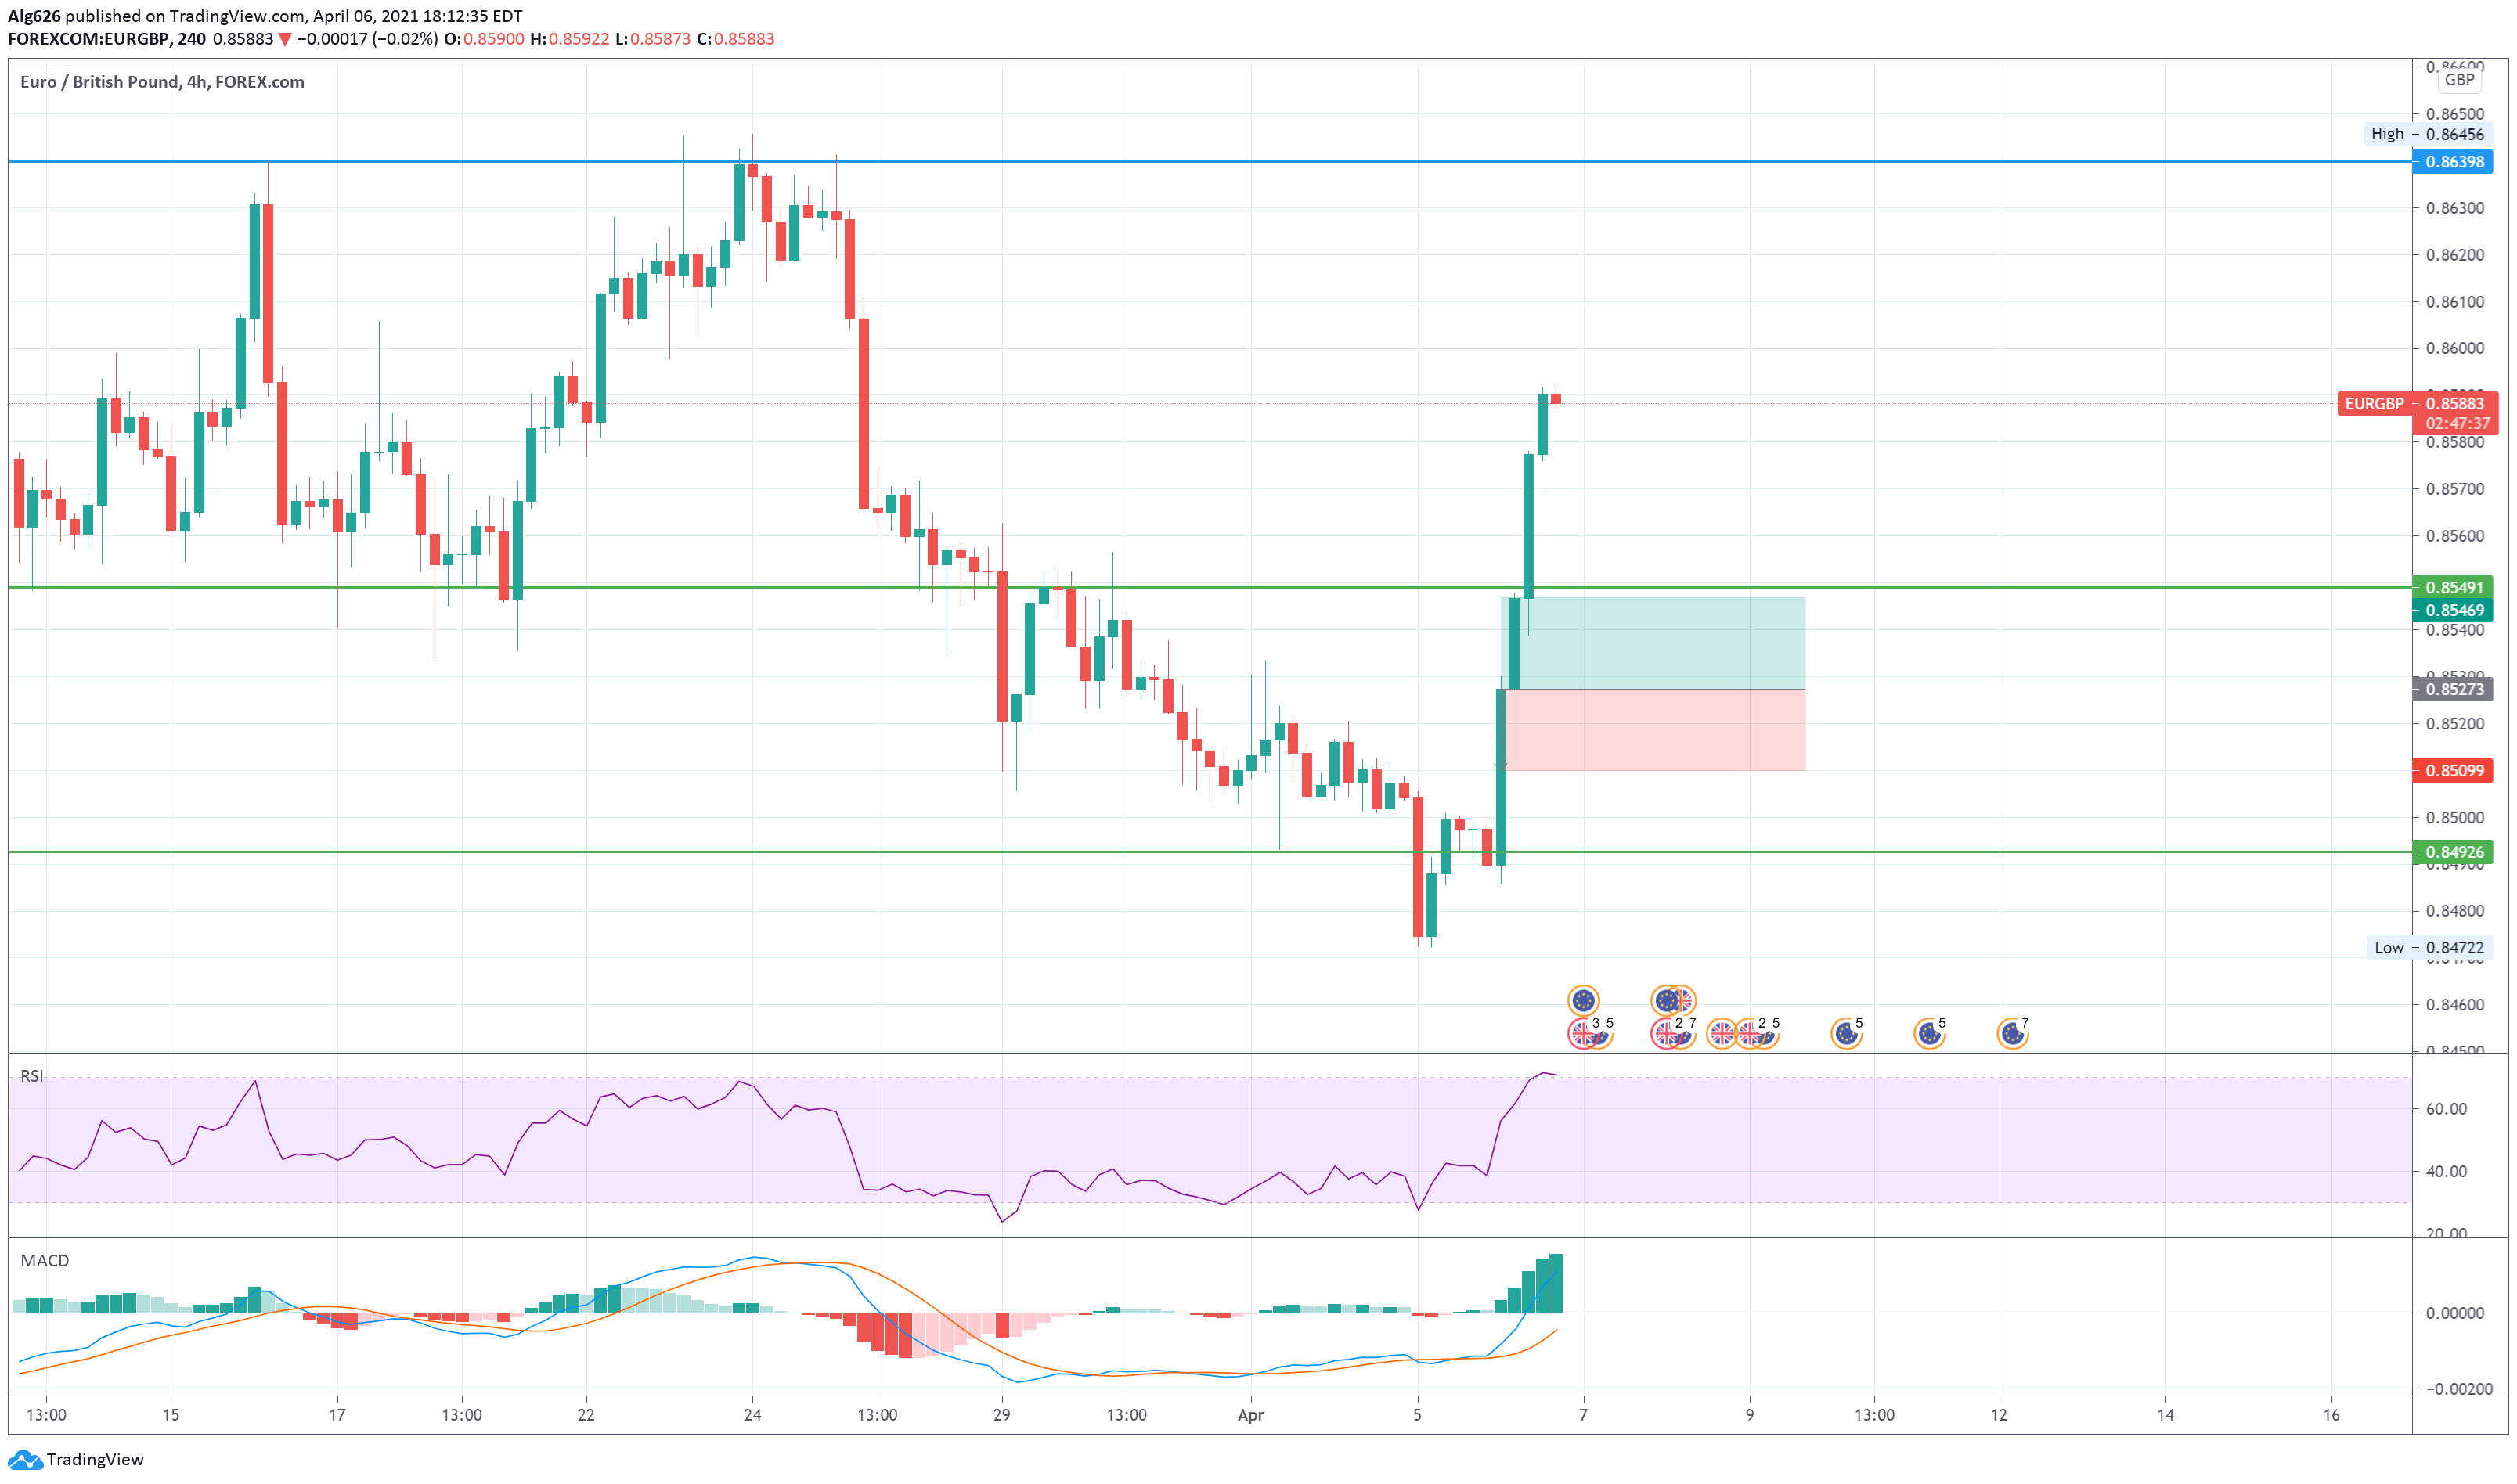
*I identify Support/Resistance(S/R) off the daily chart and color those lines green.
*Identify S/R off the 4HR chart and color those lines blue.
*I use two indicators RSI and MACD. MACD I keep the settings default. The only thing I change on the RSI is the 70/30 lines, I change them to 65/35.
*I trade using 4HR charts.
For me to open a buy position…
The RSI has to be coming from the oversold area crossing up over the 50 value with the candle closed above that value of 50.
The MACD line has to be above the signal line showing it’s starting to diverge
The price can’t be pushing up against a resistance zone.
For me to open a sell position…
The RSI has to be coming from the overbought area crossing under the 50 value with the candle closed below that value of 50.
The MACD line has to be below the signal line showing it’s starting to diverge
The price can’t be pushing down against a support zone.
If all 3 are met than I open a position.
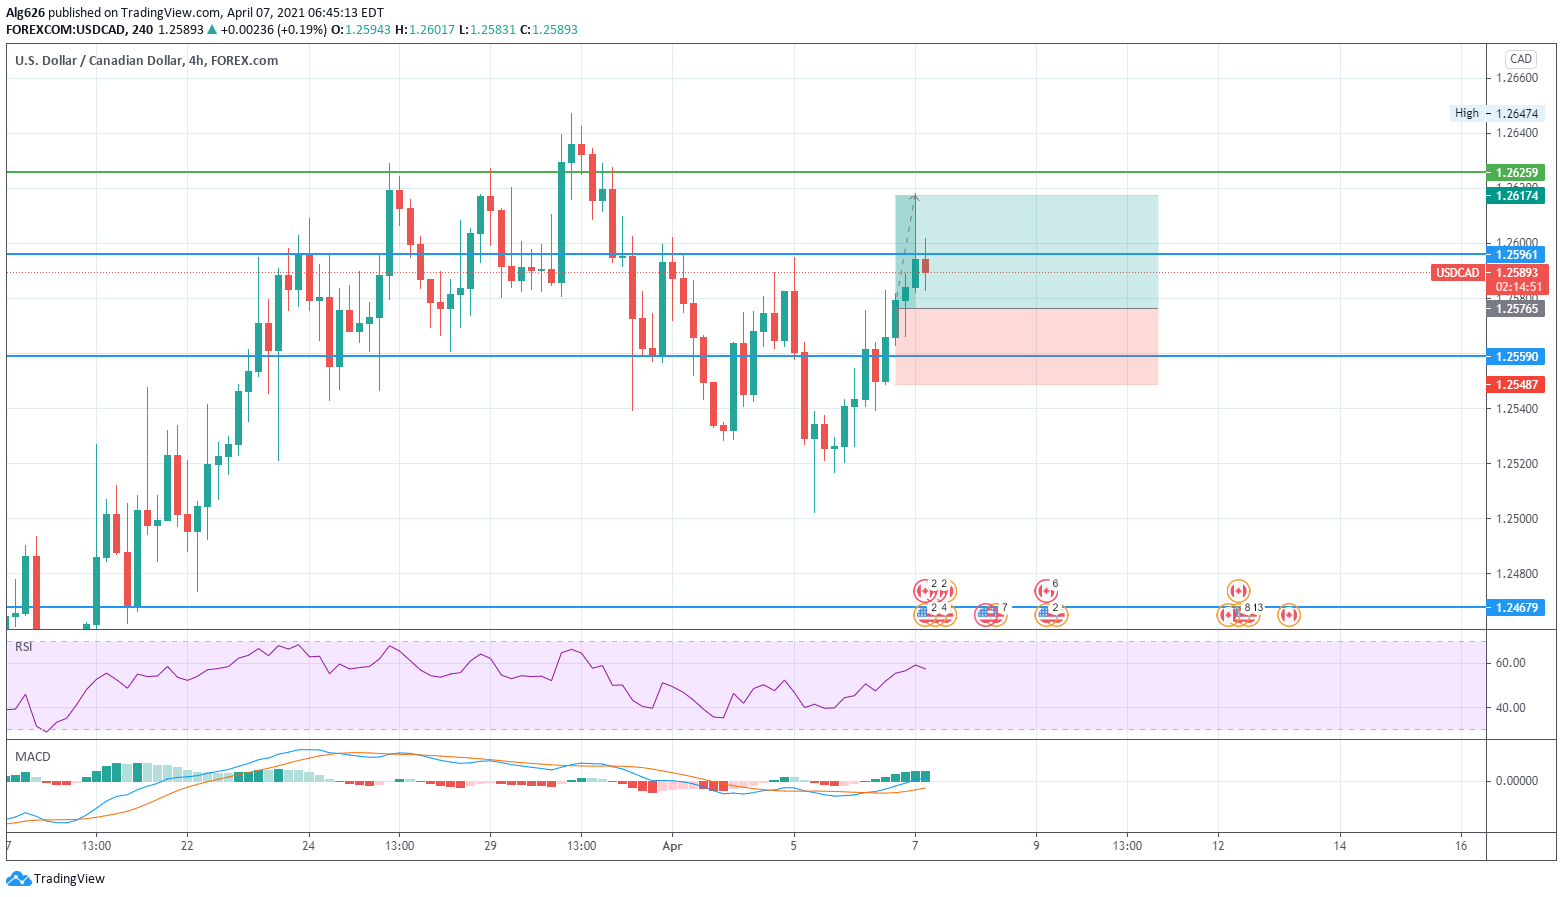
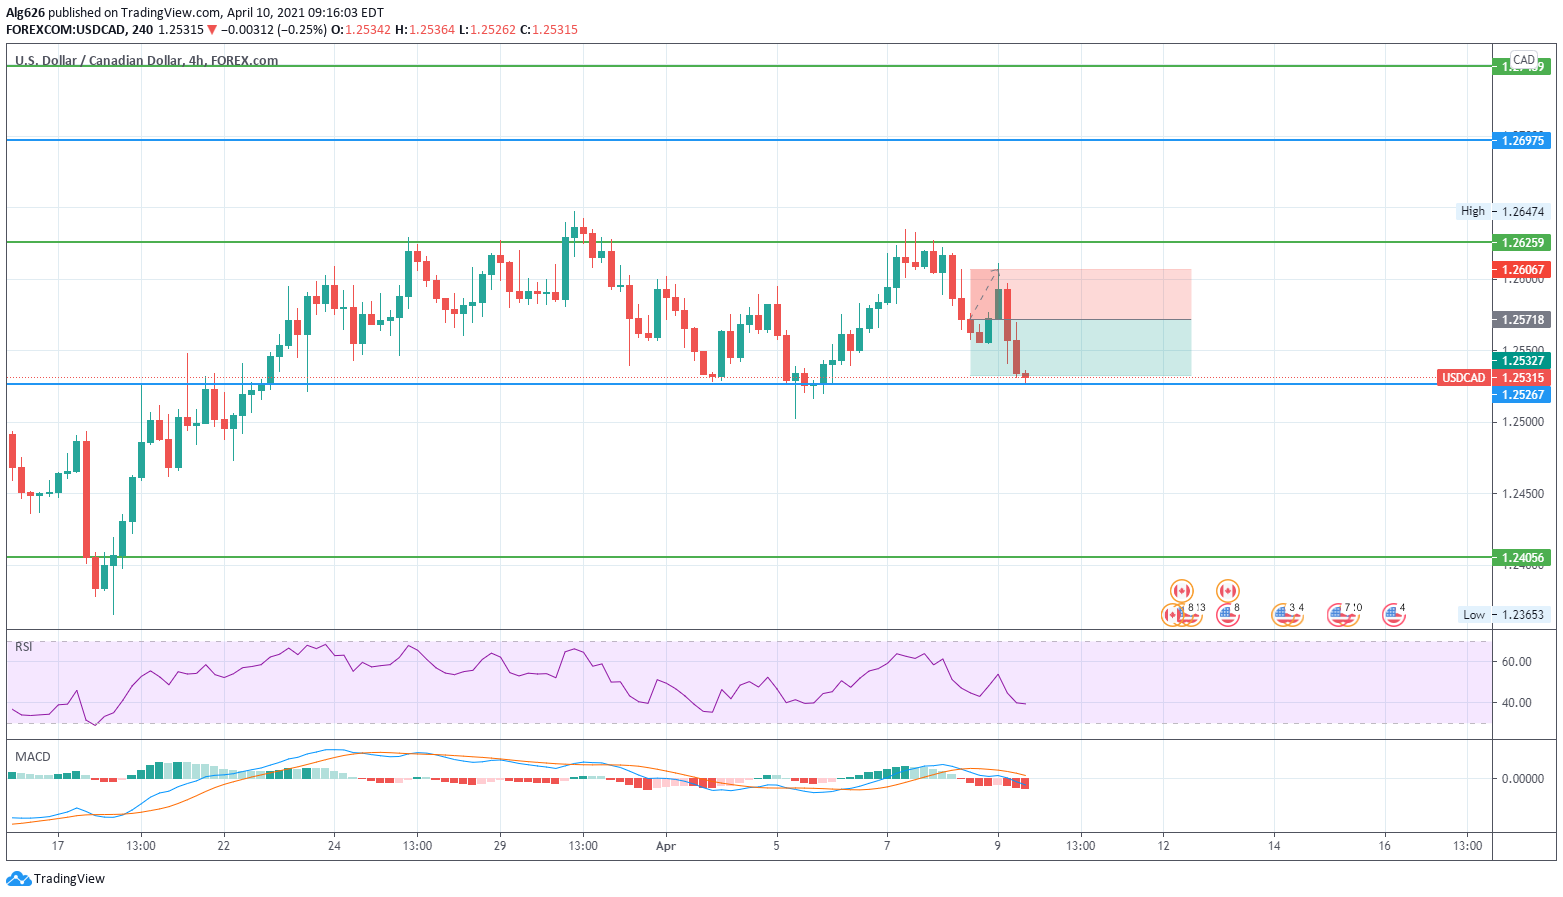
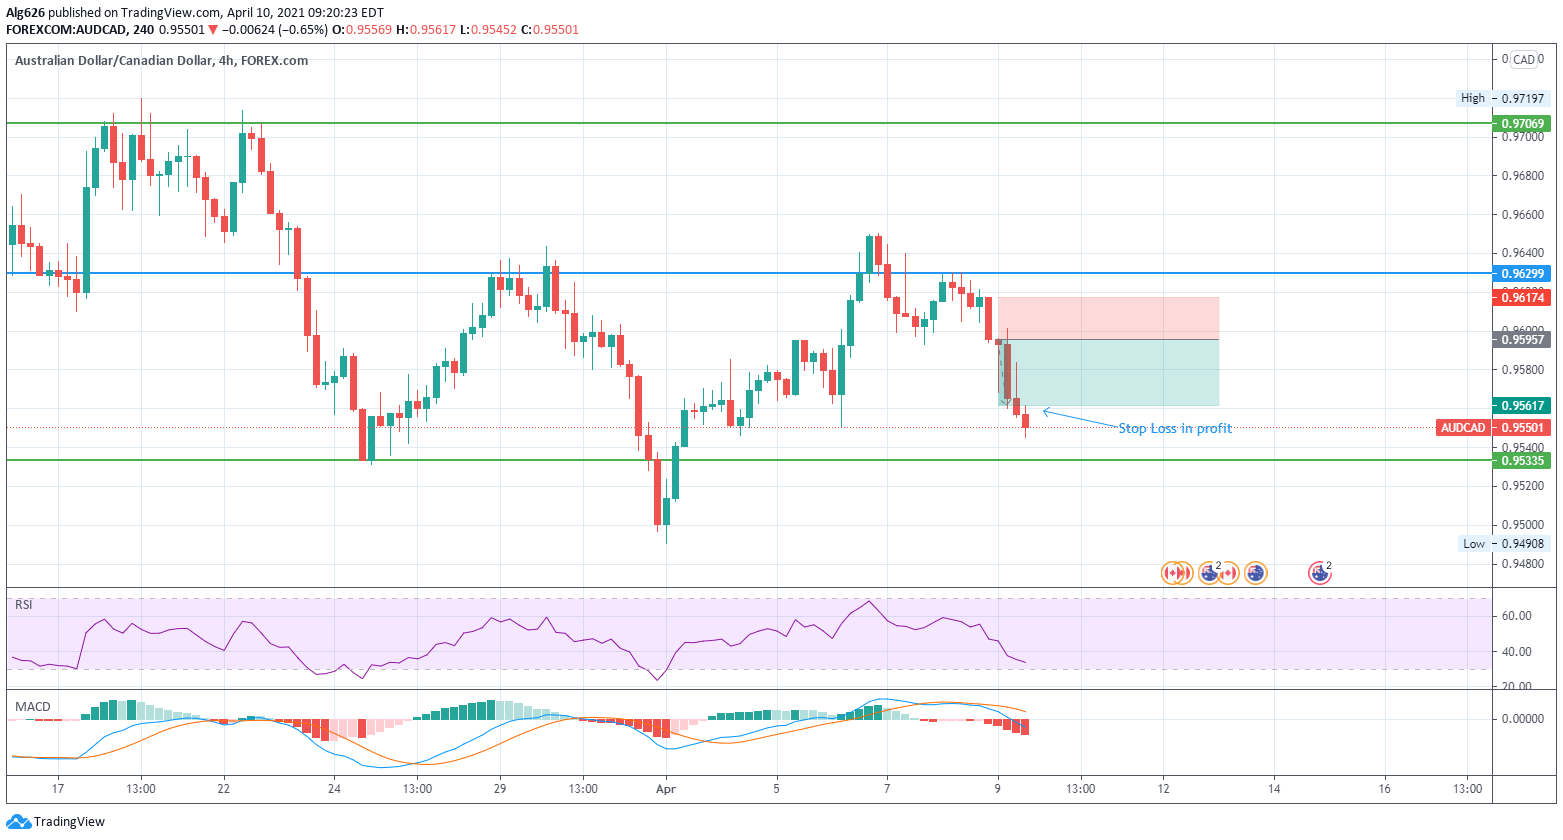
*I set my stop loss at the last candles high/low depending the direction I’m taking. If the candle isn’t big enough and too tight I will set it at the last swing. (I have them on my chart I posted)
*I set my TP at the next S/R zone, but with each closing of the candle I move my SL to the high/low of the candle(depending on the direction of trade) that just closed given that the candle has some body to it. And only if the candle is going my direction, meaning if I have open a buy and the next two candles are in profit I move my SL to the low of the latest candle that closed. Let’s say the next candle the price moves down a little but doesn’t stop me out. I leave my SL at the last candle going my way not the one that just closed. (goodness hope that makes sense lol, I have shown it on my chart as well).
*Also have to be mindful of whipsaws, so I look at what the price has been doing and if it’s in consolidation I wait for it to make a break out and than open a trade once all the signals have been given.
*I also remove my Stop Loses during the swap just so the spread doesn’t take me out of the trade. Add them back in at 6pm eastern time.
Feel free to ask questions. I have used this strategy for the last three months but have backtested going back to Sep. 2020 with good results.
Just wanted to update this post as well since I have changed it a little. See charts below for some examples.
On my charts if you see a black line coming from a candle that is where I have moved my SL. The red is where I originally placed my stop when I opened my trade.
Good Luck Trading everyone. Look forward to chatting about trading ideas.
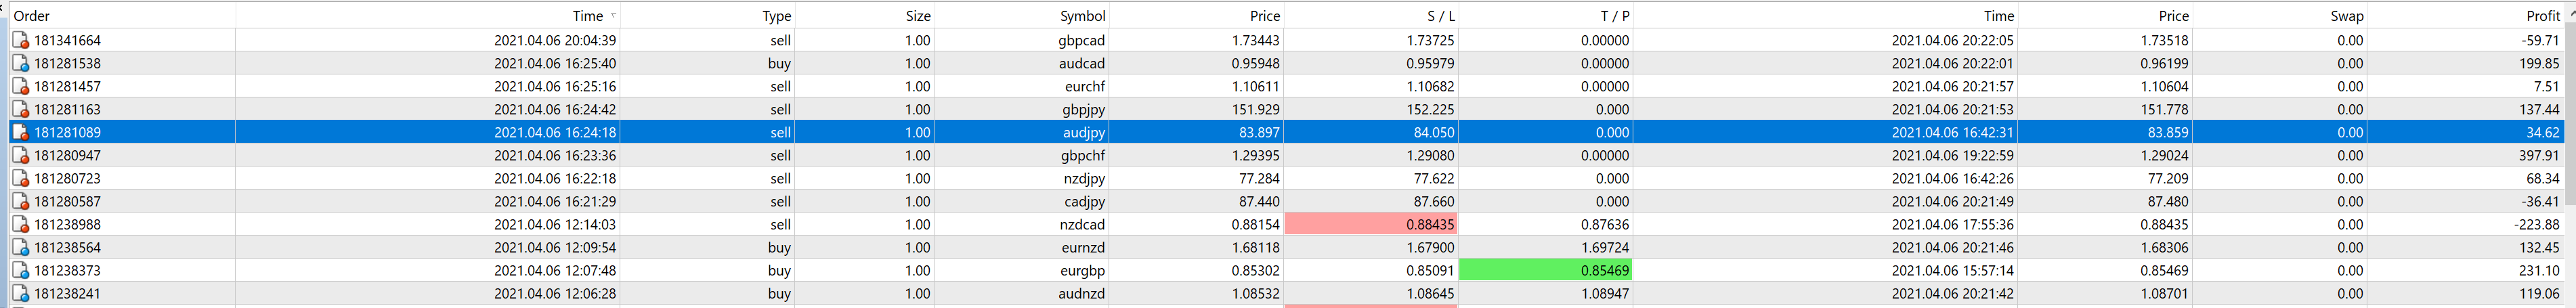
Here are the results from the trades I took yesterday, ended up they all hit TP. Good day trading, yay. lol
AUDCAD - I ended up closing some of the position, and took the last bit of it later on as well in profit.
Ok busier day than normal but here are the trades I took and even some I missed due to being asleep. I’m not awake for the 1am candle. Eastern time zone.
9-3 on the day, been a good start to the week.
AUDCAD
CADJPY - I ended up getting out of all my trades a little early due to work. As you can see in my results I got out in negative but the trade has come back to profit.
Also hope this thread doesn’t come across as me trying to “show” how good of a trader or being arrogant.
I have only been trading 7 months and wanted to share to bounce ideas off each other and see how we all can improve and grow. I certainly understand I don’t know it all or even a little lol. Happy trading.
Your trading after only 7 months is really very impressive:
You have built an excellent strategy which is clean, precise, logical and simple.
You are applying sensible R:R rules.
You are showing discipline and actually following your strategy rules.
I notice that you are trading off the 4hr charts and cover a fairly wide range of currency pairs. I would like to ask you how many pairs do you actually look at, and do you go through them all every four hours during your wake time?
I can imagine that it doesn’t take you very long to evaluate each pair on their daily/4hr charts once you are practiced at what you are looking for, but it is still a heavy workload if you are monitoring, say,
28 pairs? Do you filter out some pairs or have a selective approach based in something else like SW analysis?
Thanks for the compliments. Didn’t come from not learning the hard way and falling for some of the common beginner trader mistakes, which I still fight.
I do look at all 28 pairs and once you get your zones established it only takes me about 15mins after each candle to check all them. I also have tradingview send alerts for when it crosses the RSI at 50 so it helps weed out the ones I don’t need to check on.
Besides yesterday’s result I usually only have 4-6 trades a day. Some days you just get a busy day, have to be careful with exposure and risk.
I wanted a simple strategy that works for me. Saw a lot of people with a lot indicators and very busy looking charts. Guess my mind just doesn’t work that way lol. Simple minded guy here.
And it’s always a battle to follow your own rules, I think I still struggle with taking profit too early at times. But some is better than nothing though.
Yes I felt like it was too much of a risk for me to wait on it to reach those levels. And you never know how long that pair is going to stay overbought/sold and then stop you out.
My first strategy I started testing did wait for it to reach those levels and once it started coming back out of being boverbought/sold and the MACD line crossed enter into the trade. But seemed to get whipsawed more often. But I was also on 1HR chart which was too much work and a nightmare for me lol.
I think that newbies(like me) need to start no lower than a 4HR chart. Wish I did sooner when I started trading. Lower charts have too much noise and false signals. More power to the guys who can and scalpers lol.
Wanted to upload my backtesting and forward testing and see if you guys would like to take a look. Feel free to check it if like to confirm and shoot me any questions you may have. I only have attached March to present. It’s based on the strategy I have posted here.
I have not made that type of money lol(shows what the system should be able to manage). I’m still working on hanging on to my trades and not getting out too early even when my SL is set in profit.
The first tab is the weekly total summary.
The March tab is all the trades in March broken down to the day of entry and how many pips won or lost.
April tab is the same.
Clear, logical, simple - just like your trading method
If this is indeed true then I think you show an extremely mature approach as a trader in both your planning and in your actual trading - which, as you point out, are not always the same thing!
Your tendency to take profits early is understandable but not wise if your system produces more when left to its own rules. It eats away at the R:R and damages the long term results. Maybe specifically documenting these differences between what you do manually and what would have been the result if left to the rules might help to quantify which is better. I.e. does your discretionary premature closing “interference” improve or worsen the overall results compared with the rules.
My only comment overall is well done and keep it up. The system may function differently when the markets start to trend more but that remains to be seen.
I suspect someone will soon be asking whether you can code it into an EA for them to “test”.
I have logged what my actual trading does compared to what my system would do if left to its own rules. And the system does better than me lol. So just got to learn let it all play out.
The mental side of this game is by far the toughest thing.
I am also working on using price action as another strategy to have for when the market does change. Have started my forward testing on it as well.