OK. Vacation is still in my head so don’t expect any brilliant accomplishments tonight.
I thought I’d start by analysing the GBPUSD pair again since that’s what I did just before vacation.
I’m trying to construct something that might be used as an analysis template for these posts. Tonight we’ll just take it as it comes however.
GBP strength recently. Looking at the Globex futures Weeklies, we see almost a doji with an upper wick that’s longer than the real body. Volume was average/slightly above.
All of June and July has been spent in what resembles a distribution phase.
GBP futures therefor at least suggest no strength for GBP.
The USD index. Last week was an inside bar and it looks like the USD index might be in the process of forming a saucer bottom. Also COT seems to suggest that traders can’t get much shorter on the USD index - ergo the index might be poised for a upwards move.
So, taken from these observations, I would have a slight bearish bias on the GBPUSD pair. Let’s see what the charts can tell us.
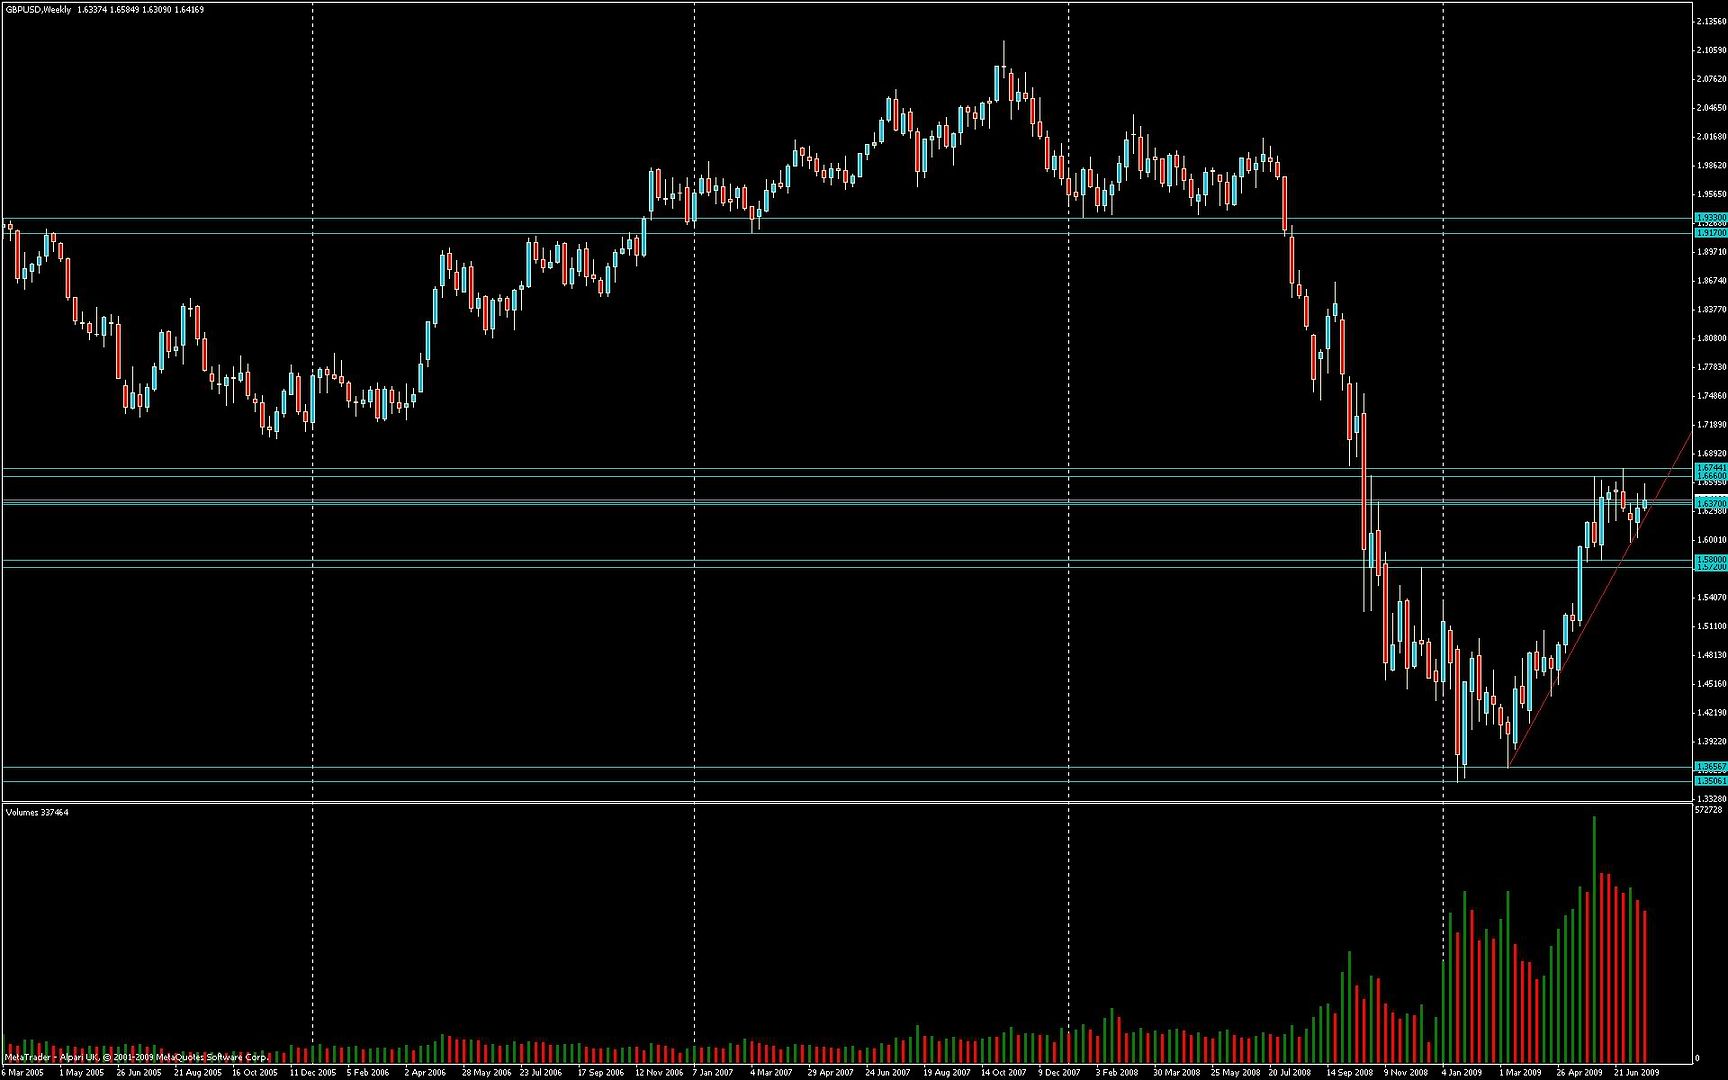
Starting with the Weekly chart for GBPUSD (all screenshots captured 2009-07-26)
What we can see here is that last week formed a bullish bar, but with a substantial upper wick. We can also see that a higher high than the week before was formed, but that price closed within the range from the week before.
Also worth noting is the volume peak which corresponds to the first week in June. This candle suggests heavy selling by smart money, and after that price has gone into and remained in a range - distribution going on?
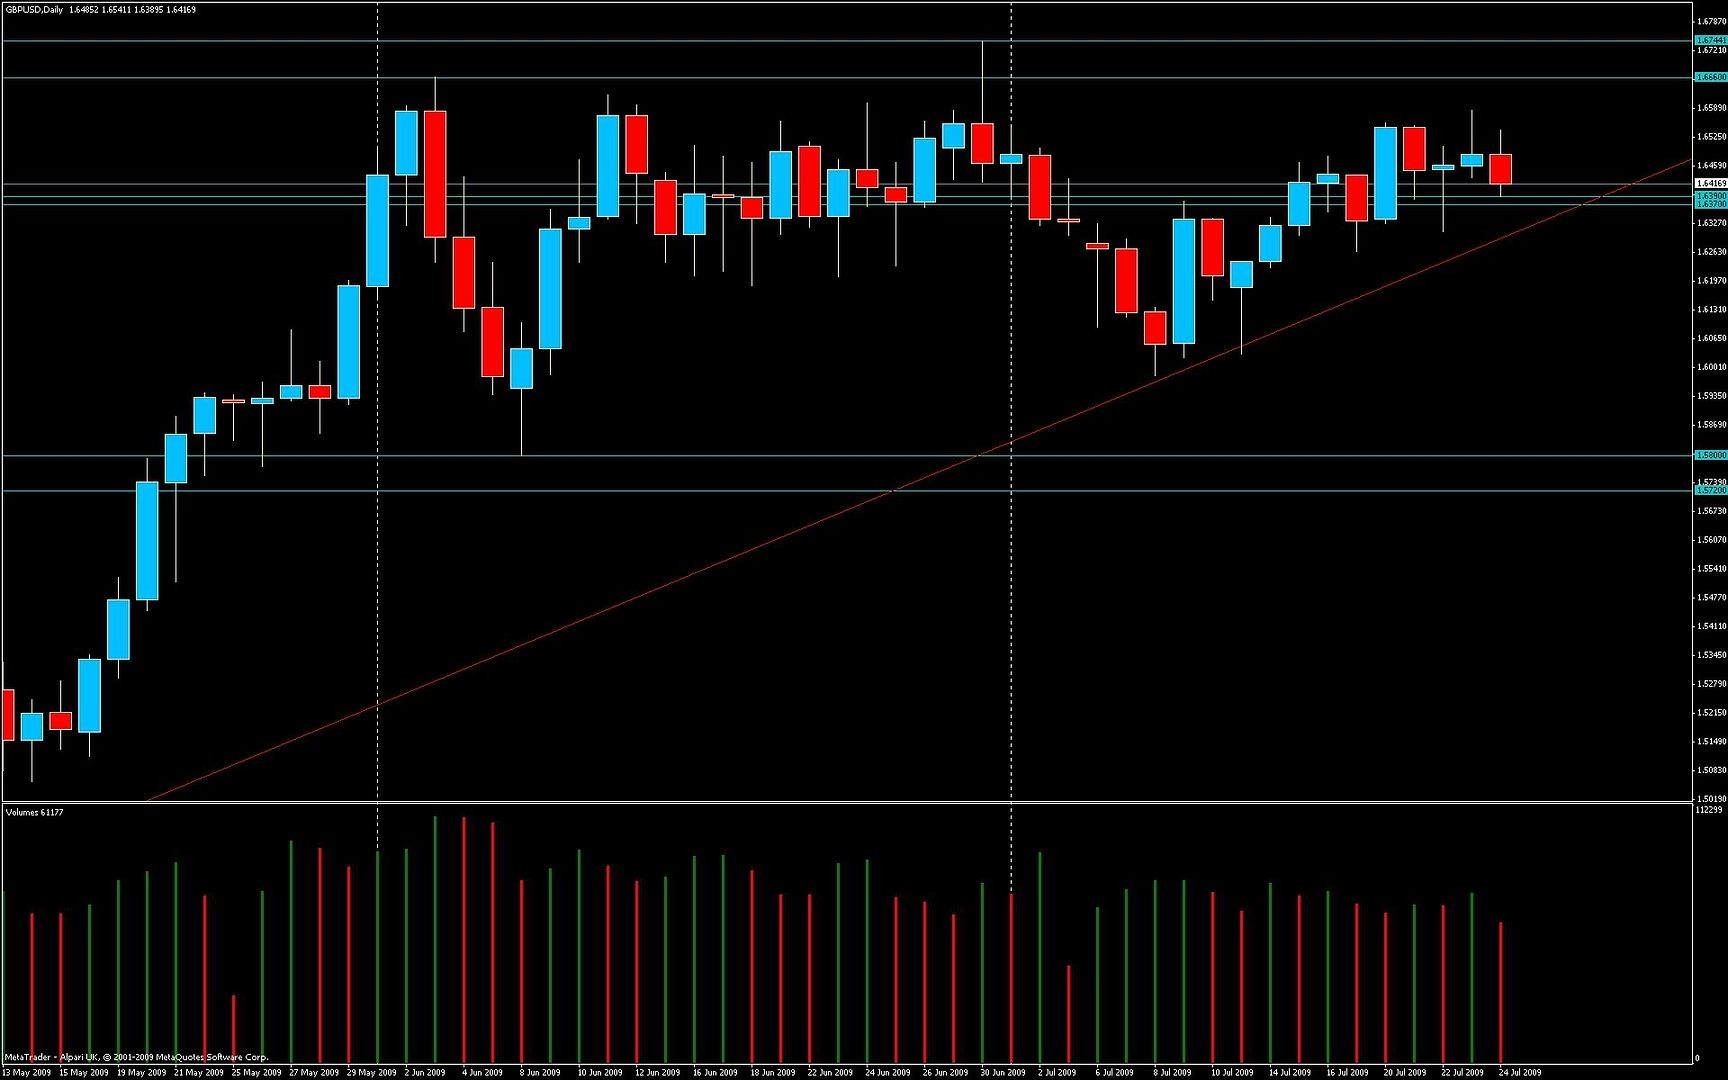
OK, let’s move down to the Daily time frame:
Here we can observe that price is so far respecting the support trend line. We also notice that price hasn’t been able to challenge the high from back in June. And the last two daily candles look pretty bearish, don’t they?
As for high-low pattern the up trend is still valid, but the now expected formation of a higher high seems to be in danger.
Trend on this time frame is unclear.
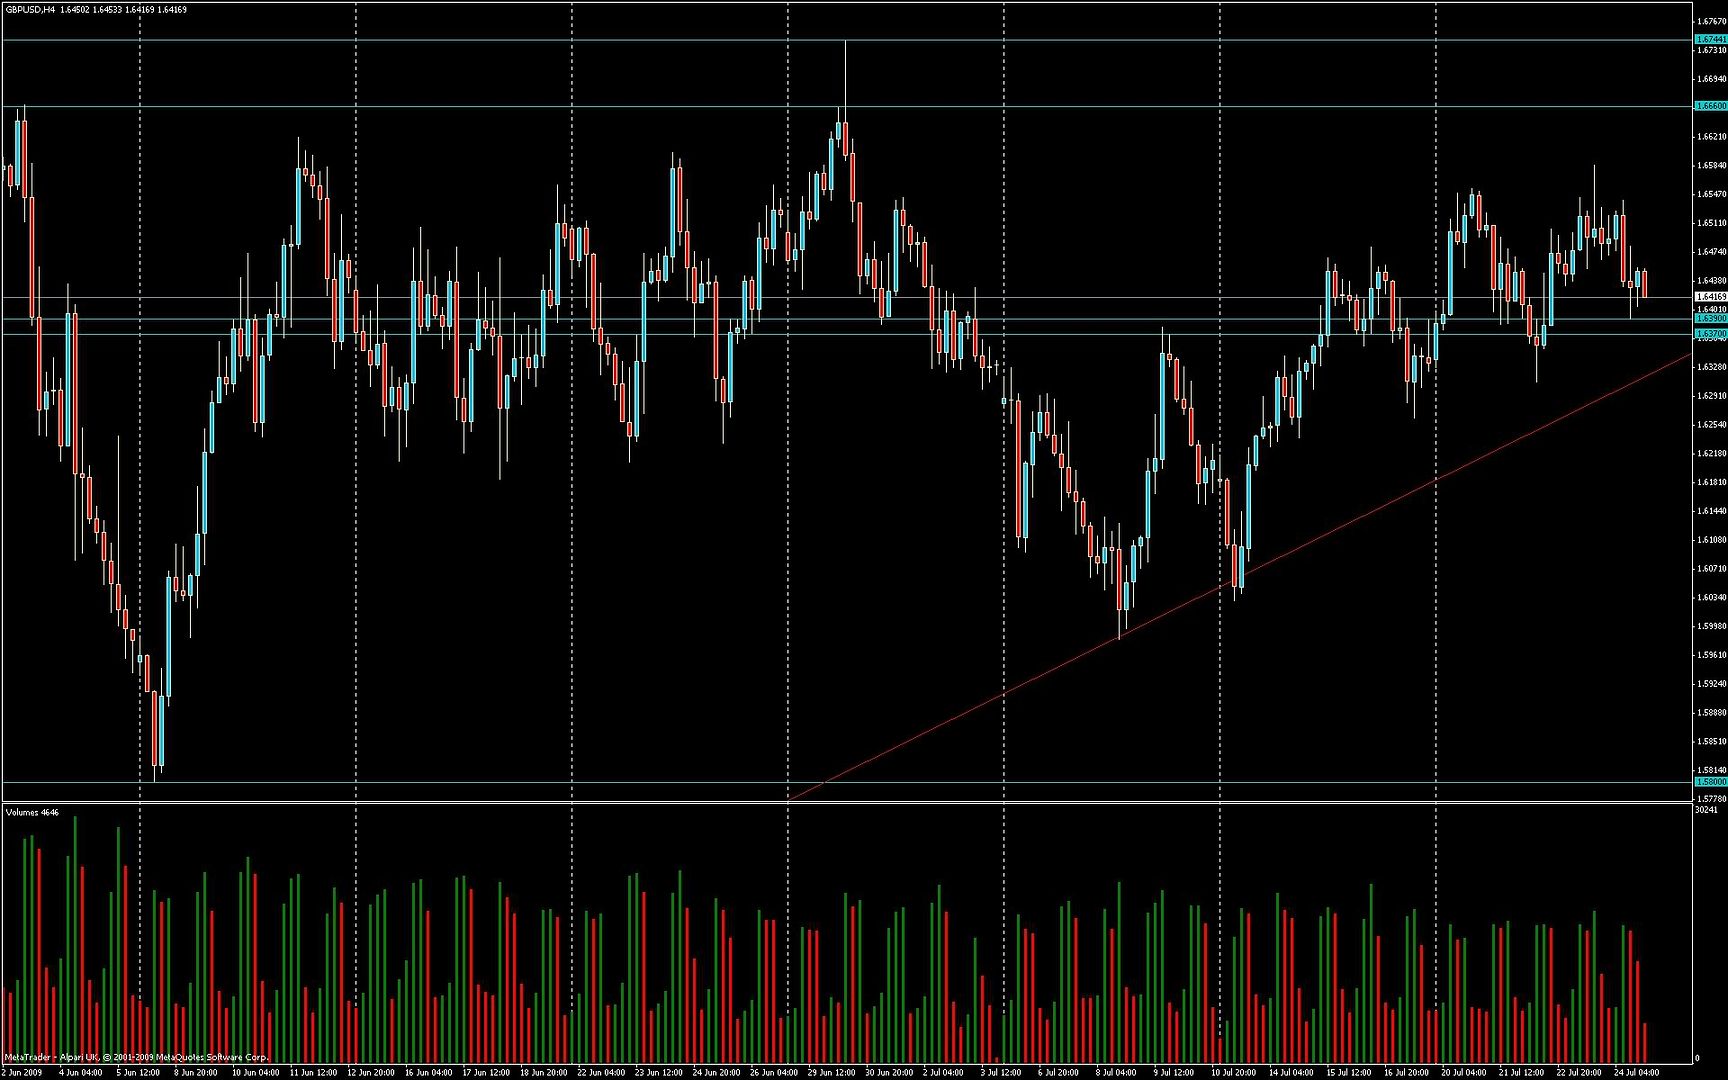
Let’s move on down to 4H:
Now it actually get’s interesting huh?
High-low pattern is valid for an uptrend. But. What are the options here?
Well, as we know price can either go up or down or sideways.
Let’s think about the down possibility:
If price breaks through the weak S zone I’ve marked out just below we have an immediate threat to the higher low pattern. If such a break should happen, I’d wait and watch how it interacts with the S trend line.
Either buy the bounce or sell the break if it’s a clean break with a close below. In either case good Risk to Reward is possible thanks to logical positions for the SL.
If price just goes sideways, well then it’s also going to hit the S trend line in a little bit and we shall decide what to do if that happens, depending on how it plays out.
Well, what if price decides to move upwards then? In that case I’ll stand aside aka sit on hands, and wait for price to interact with the R zone I’ve marked out above (1.6660-1.6744).
So to conclude:
If price moves down and bounces off of either the weak S zone or the S trend line, I’d be looking to buy (mind though the overall bearish bias)
If price moves down and makes a convincing break and close below the S trend line, I’d be looking to sell
If price moves sideways I’ll wait until it interacts with the S trend line
If price moves up I’ll wait and see how it interacts with the R zone above.
Until either happens, I’ll stand aside.
 Not off topic at all, Sometimes people need reminded that quality of life is not one thing [B][I][U]MONEY[/U][/I][/B] . But the whole package including health mental and phsyical… it is easy to sum up .


