EUR against:
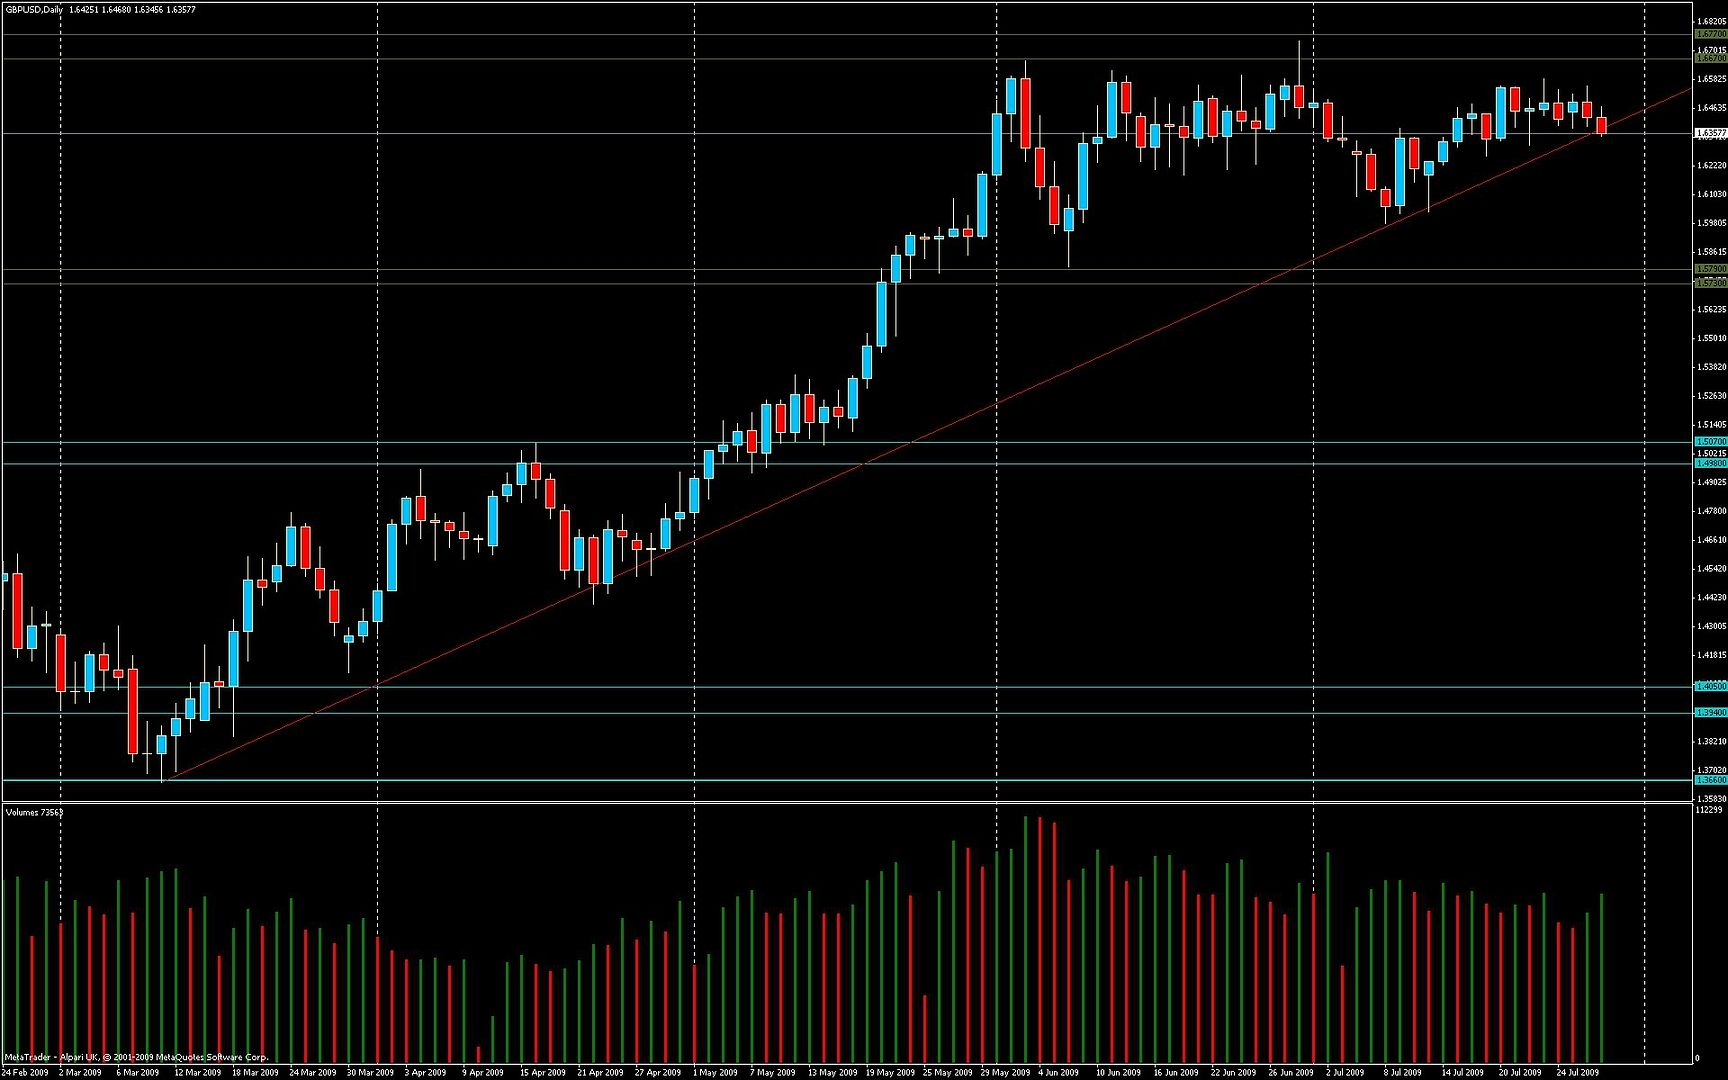
GBP - fell but recovered and closed only slightly down
JPY - declined sharply, recovered some but still closed as a convincing bearish outside day
USD - tested 1.43 major R level, failed and closed down
EUR showed weakness against JPY and USD today.
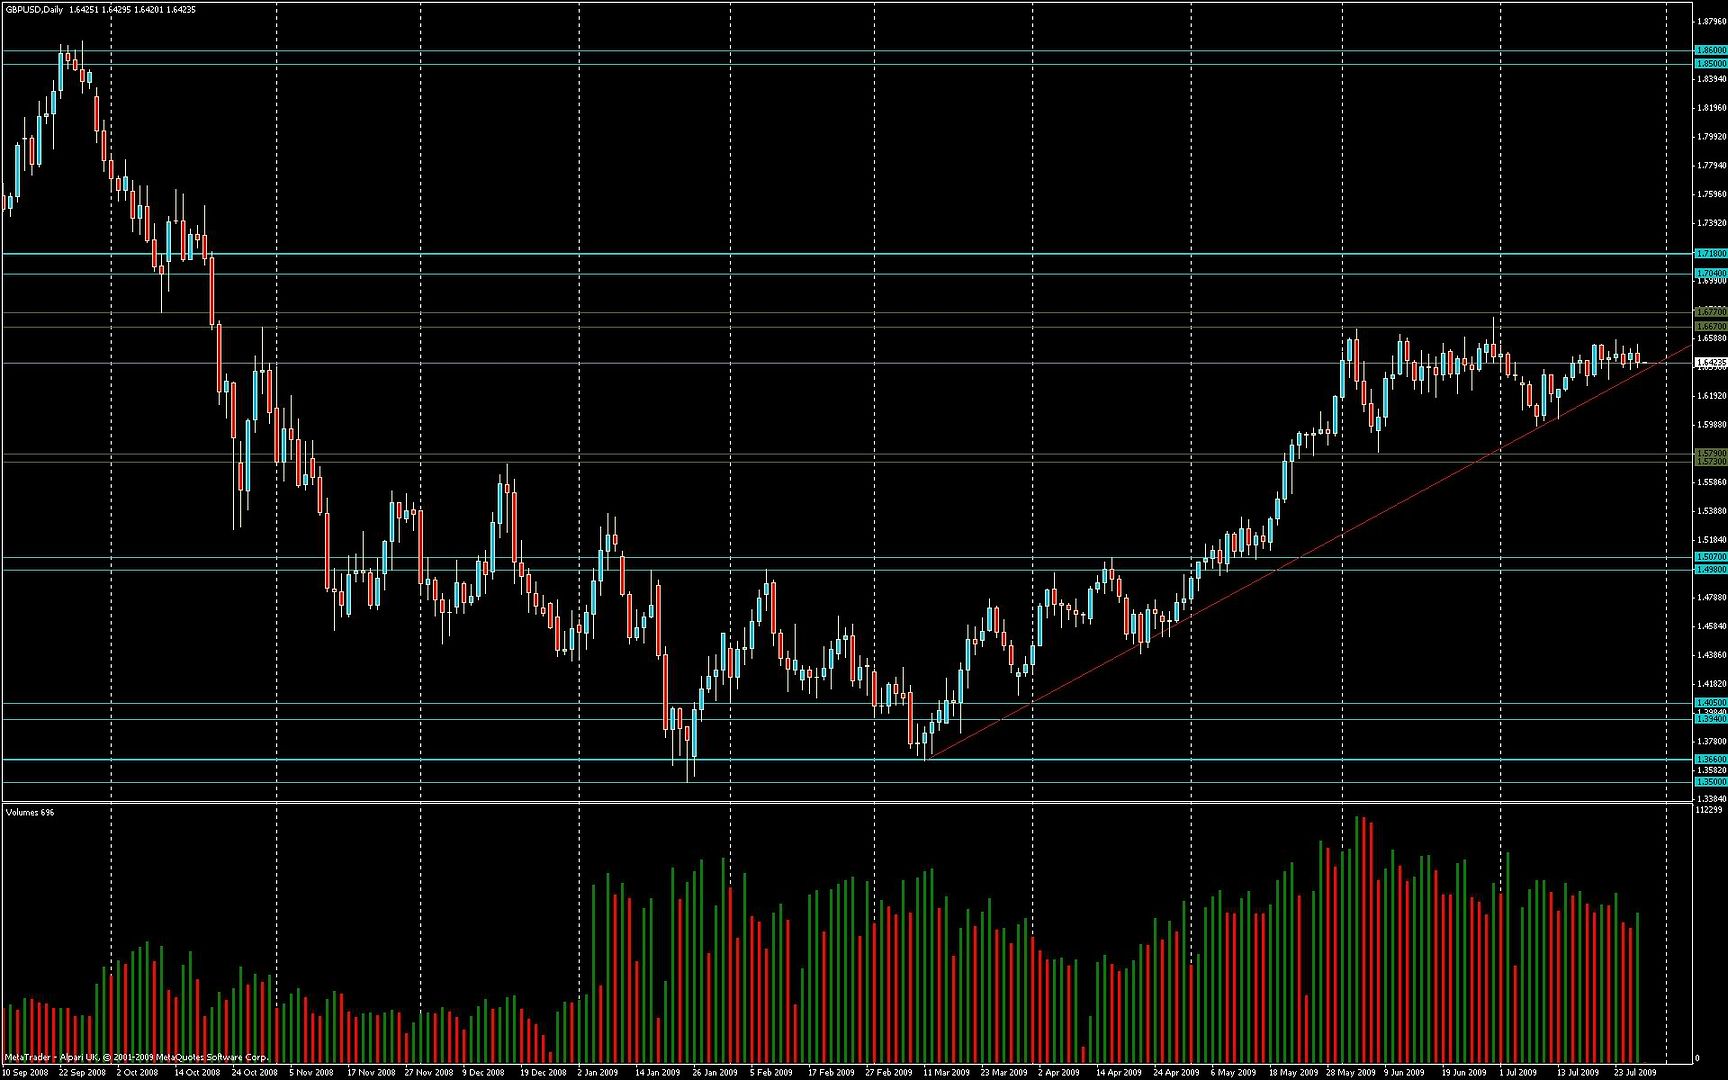
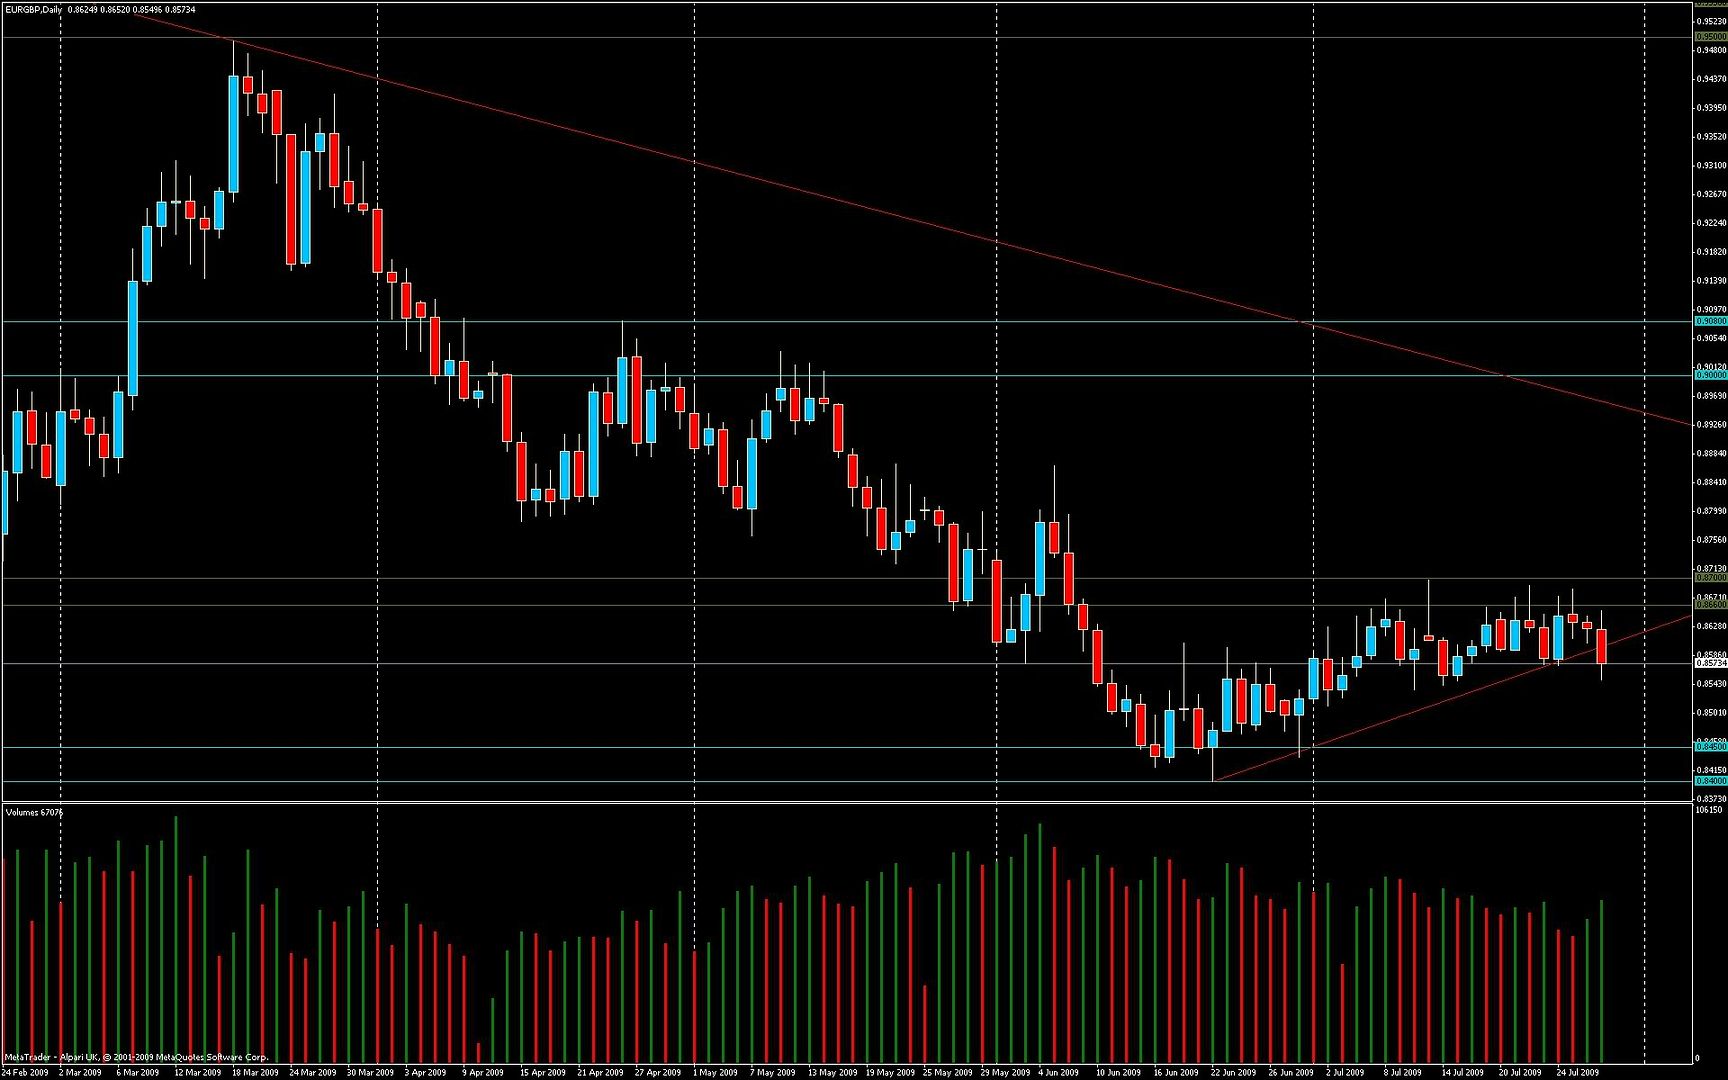
EURGBP
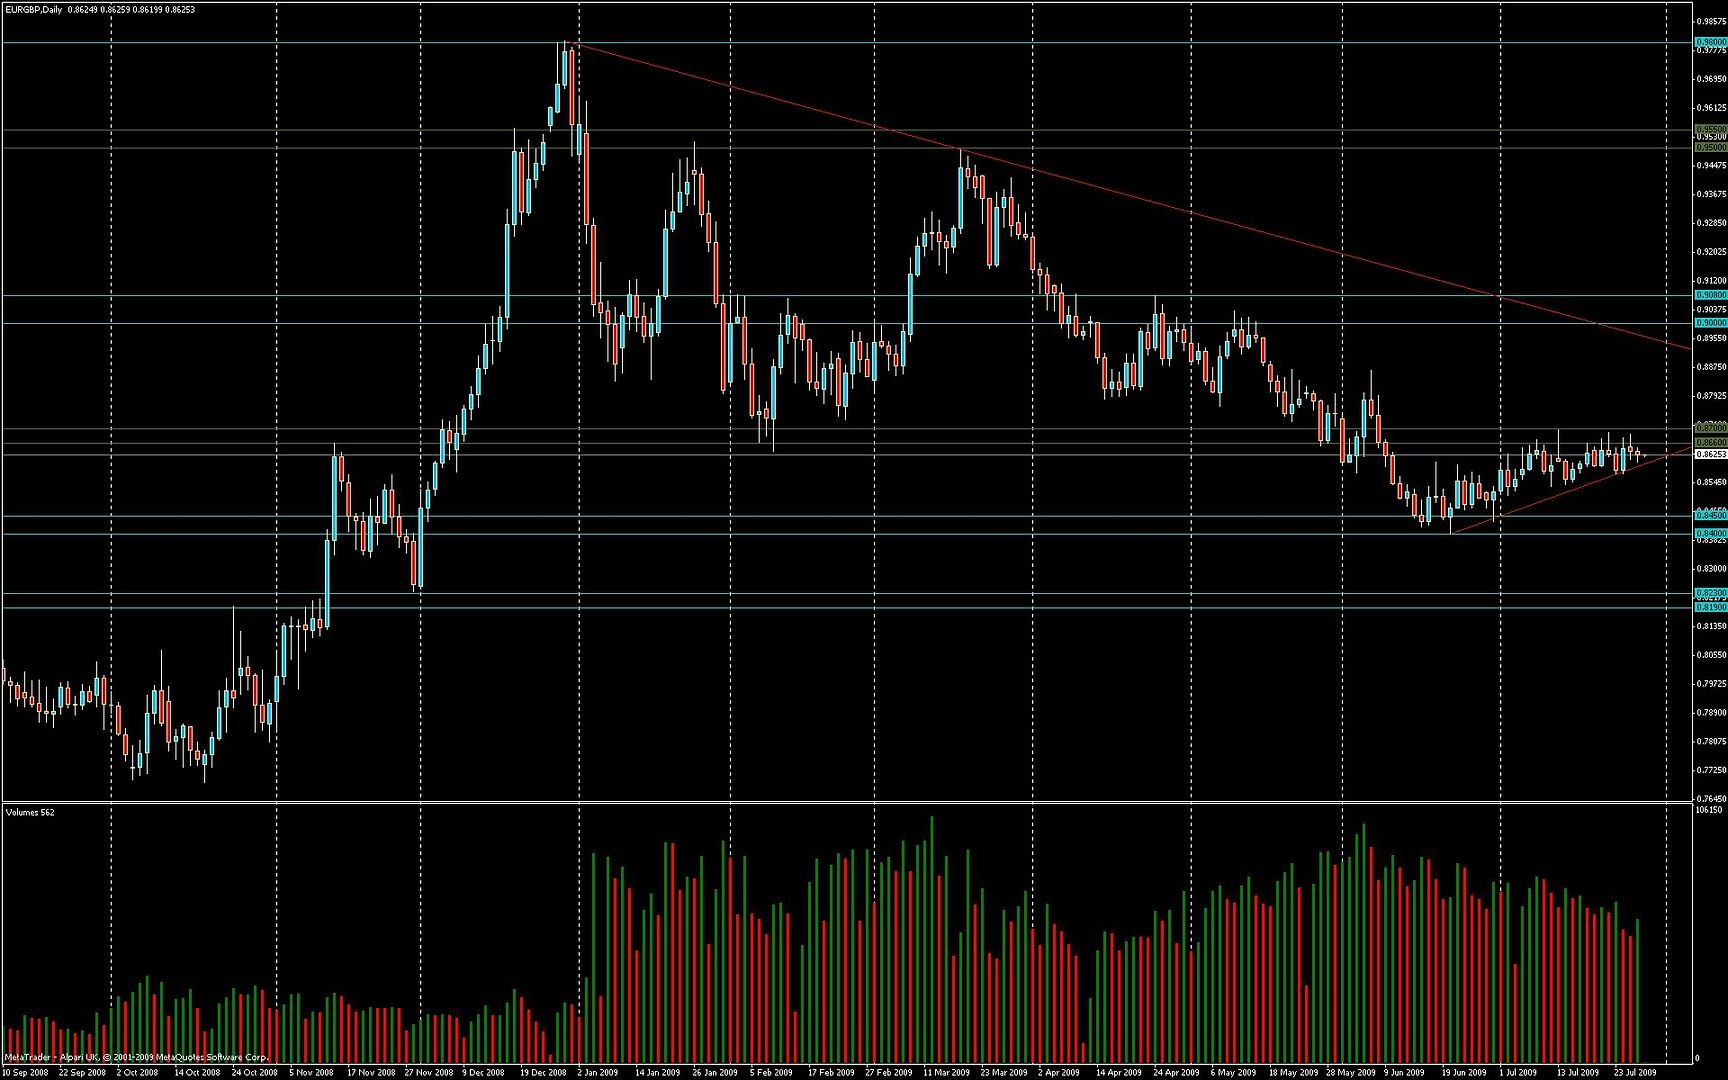
Chart patterns: none identified
General S/R analysis: Price is respecting the rising S trendline which began June 22. Bounced off of it today.
On the upside, price has found some R in the 0.86-0.87 zone.
VSA: suggests weakness IMO, but it’s not very clear. Two upthrusts on low volume during July and falling volume lately as price edges higher. Then again it’s vacation time so I feel VSA is unclear.
Bias: unclear, but I’m leaning slightly to a bearish bias.
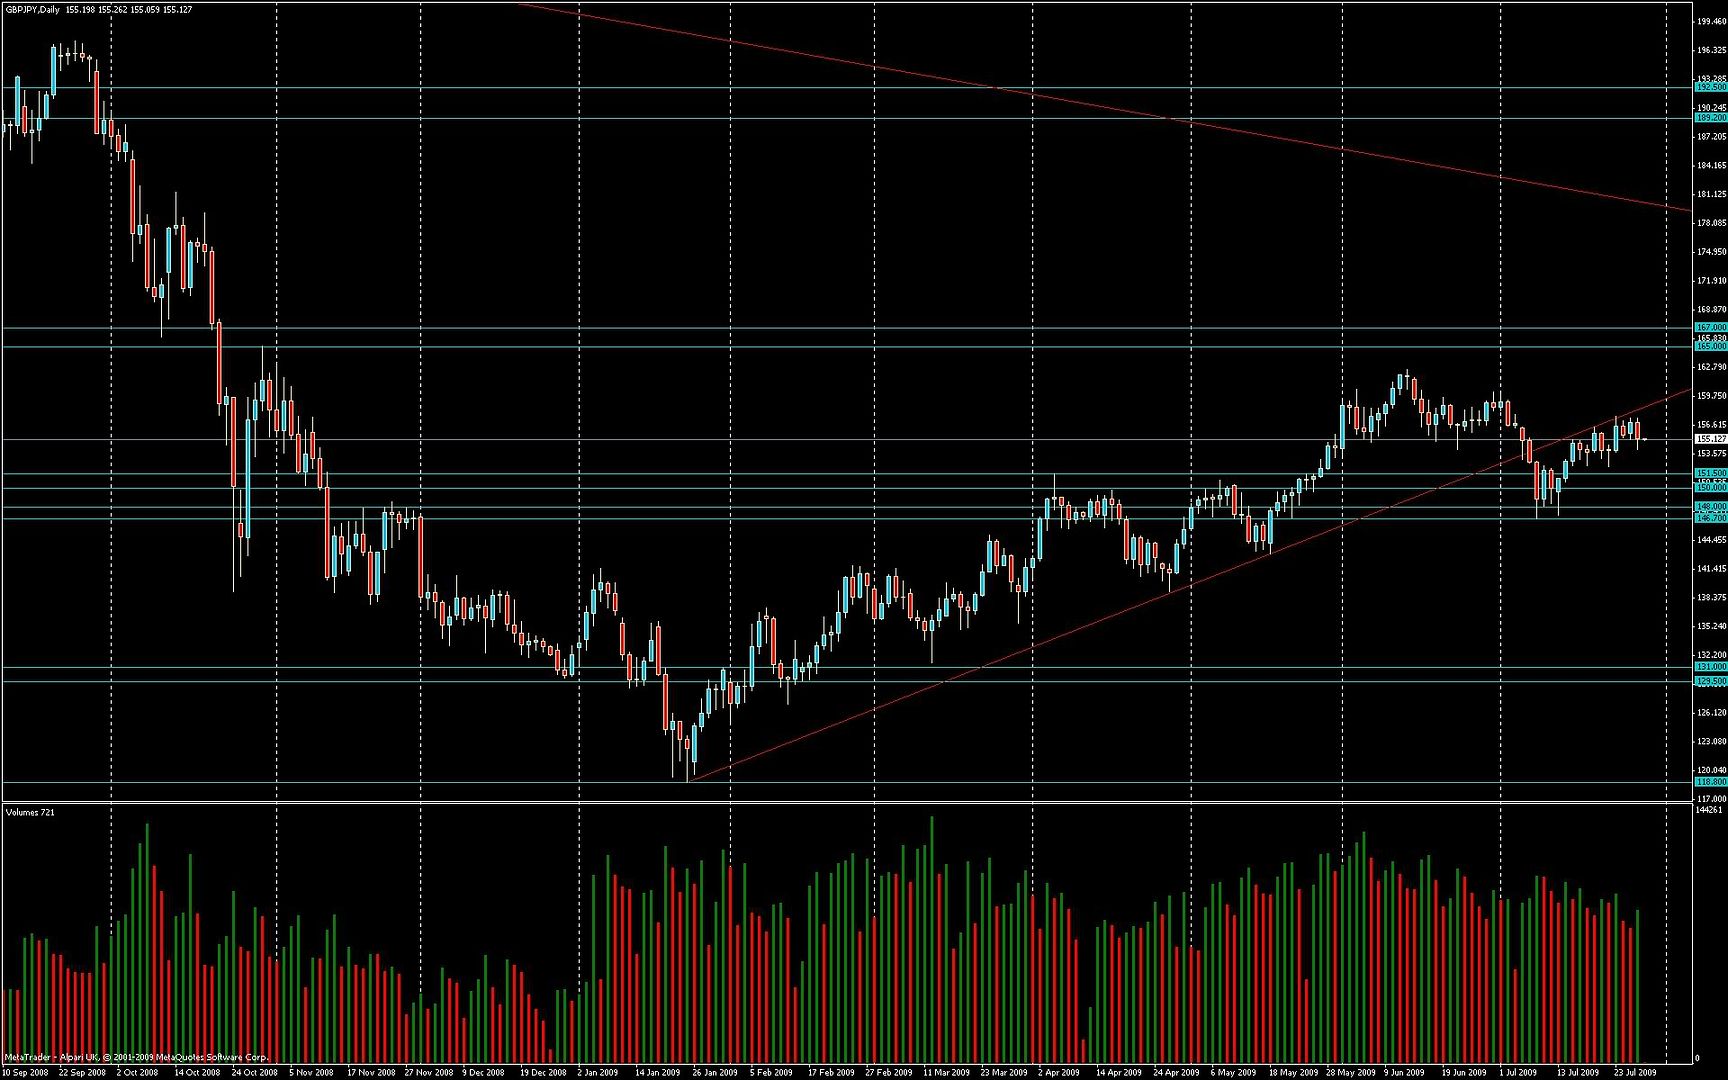
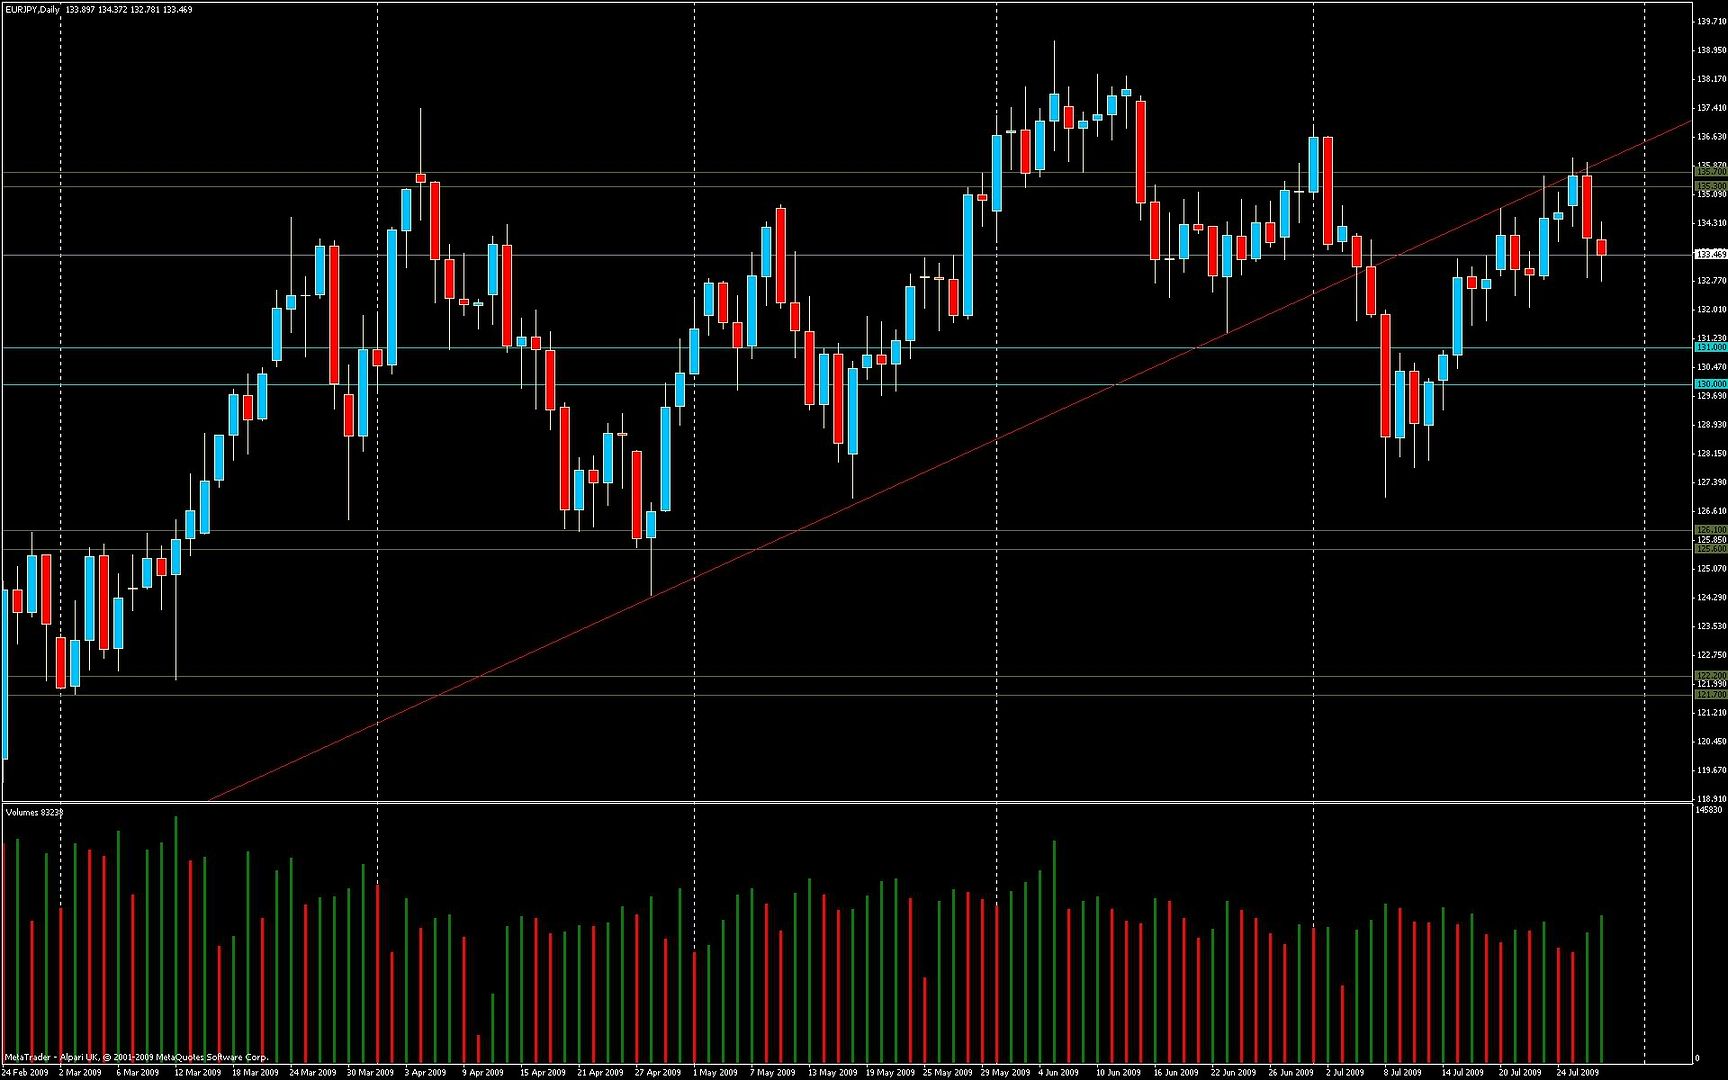
EURJPY
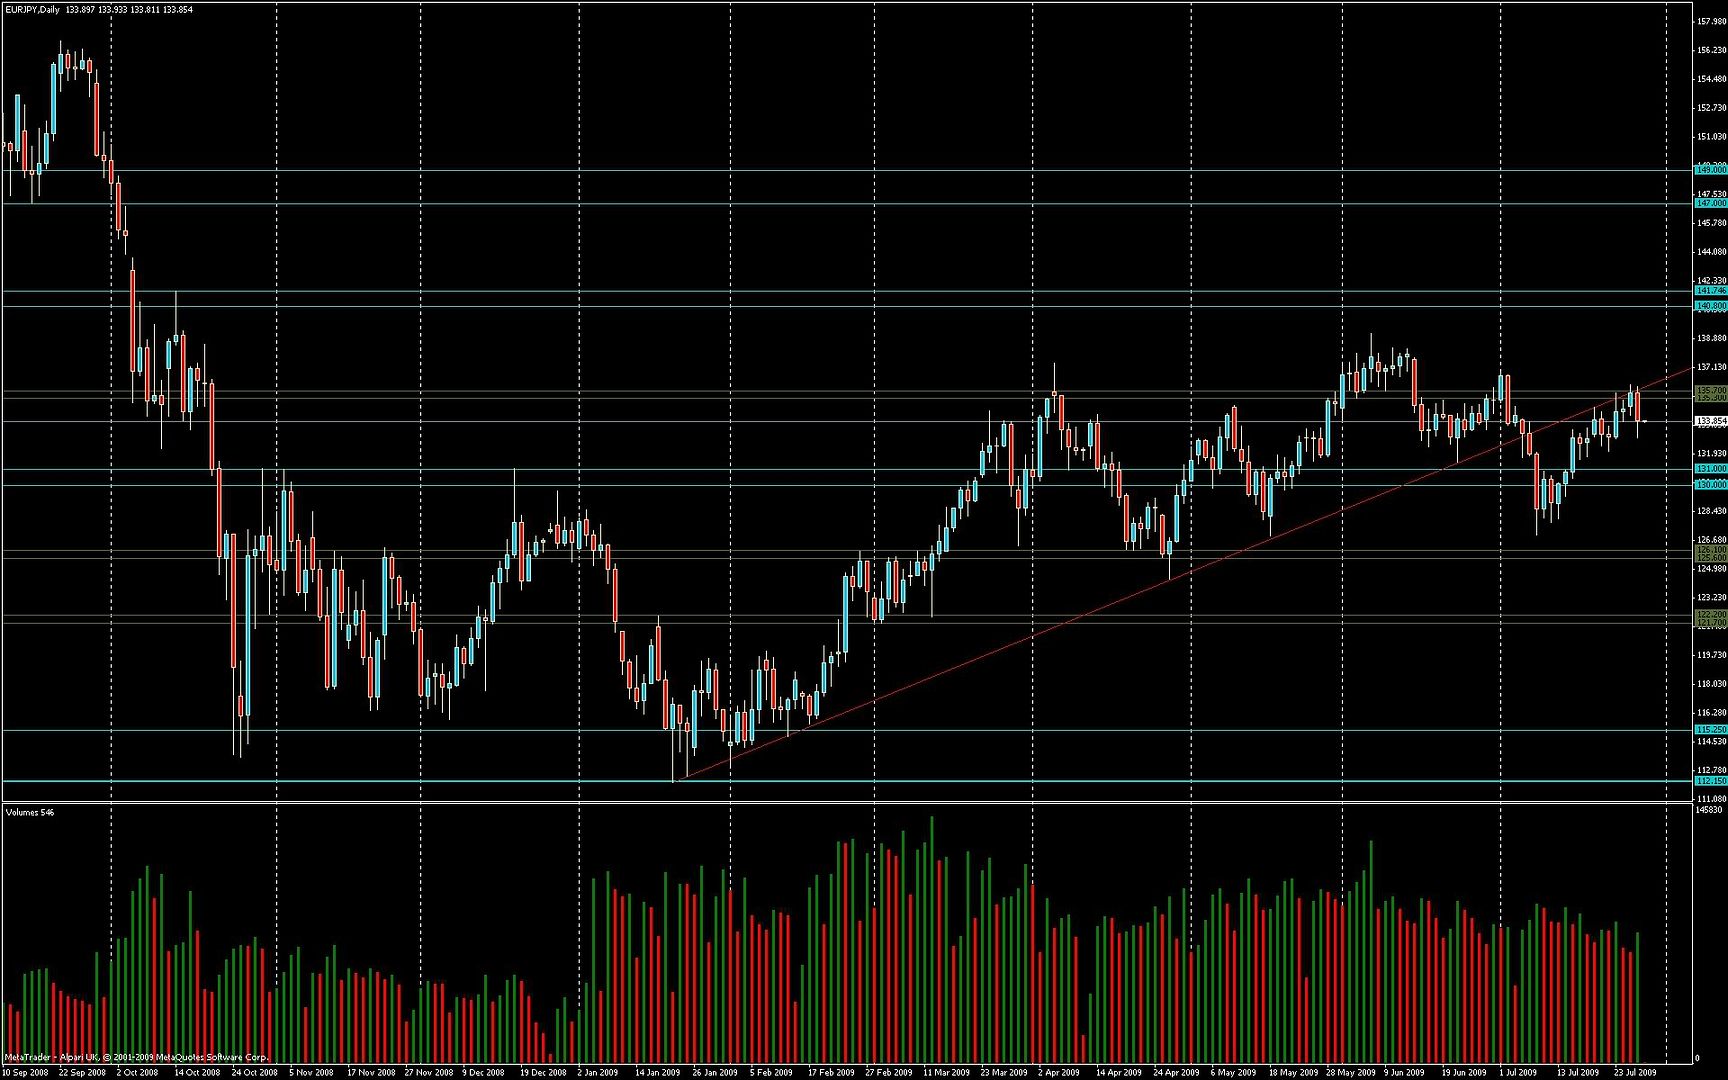
Chart patterns: potential head and shoulders with right shoulder being formed now, requires good will to see
General S/R analysis: Broke through and closed below trendline July 7. Trendline retested July 27/28 - now acting as R trendline. Price bounced off of it and also off the minor R zone 135.3-135.7
VSA: June 5 may have been a climax top. Otherwise nothing particular that I can see on VSA
Bias: Bearish
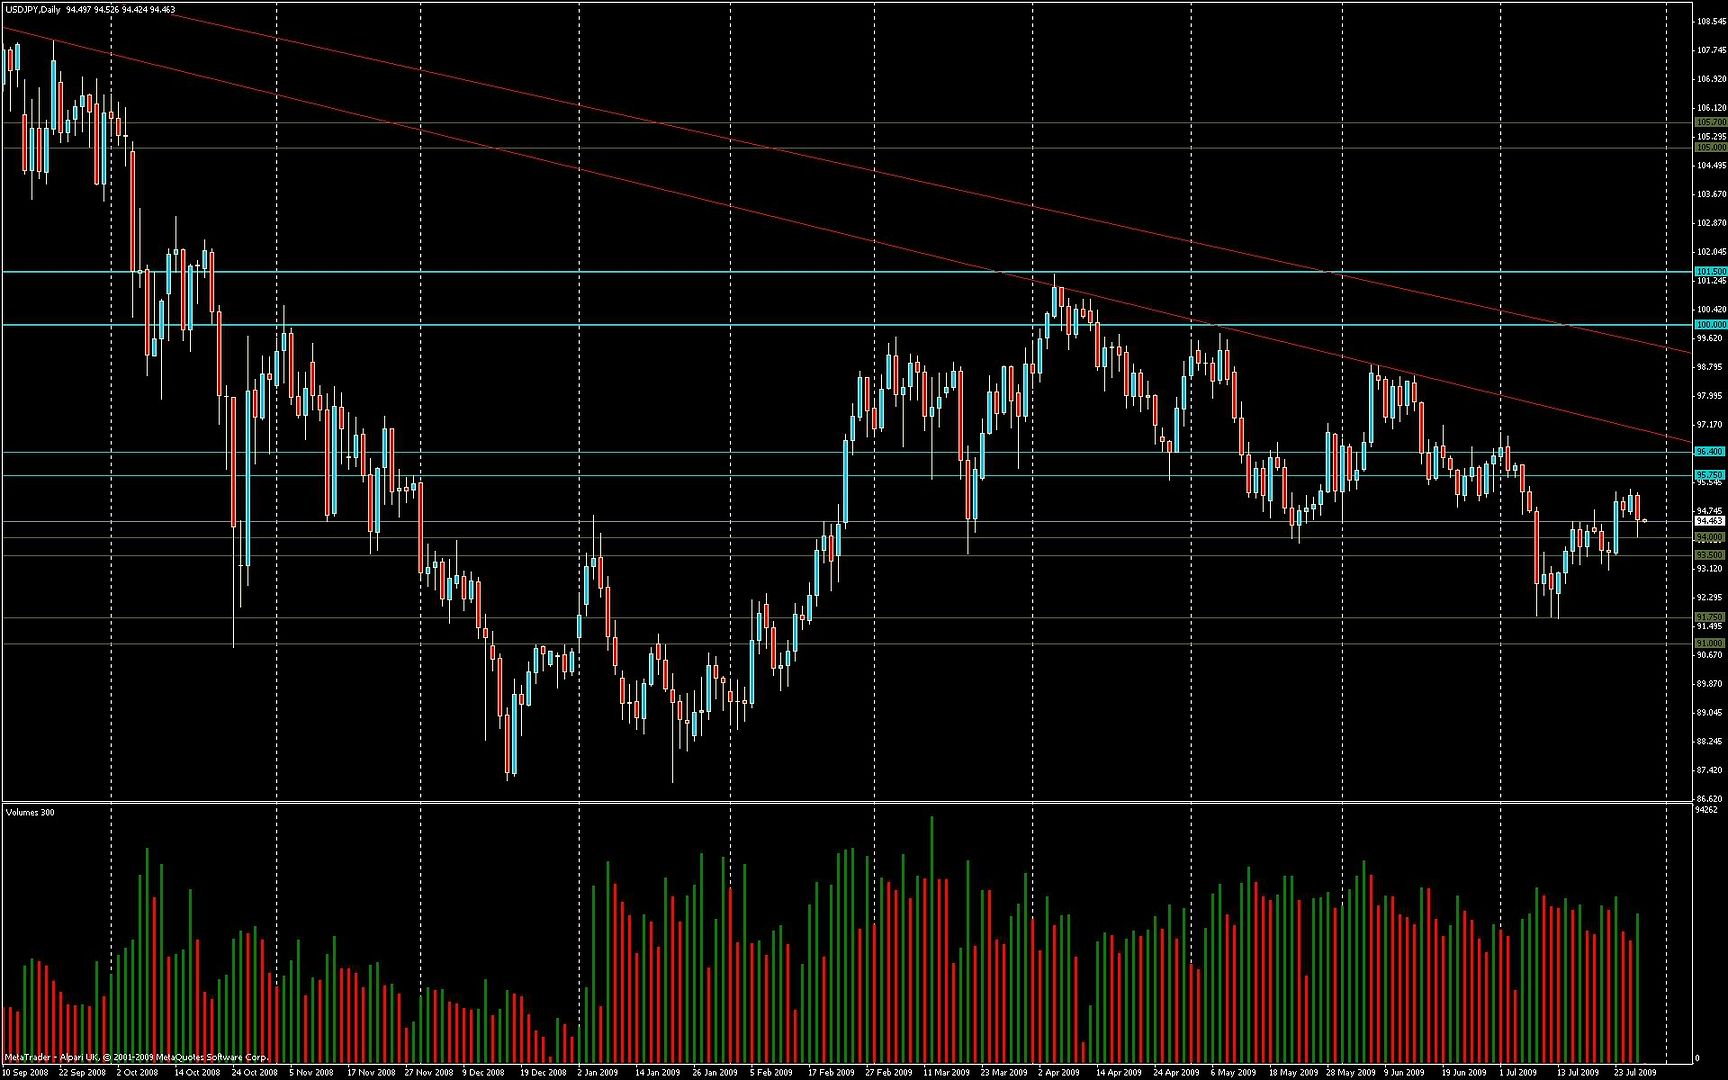
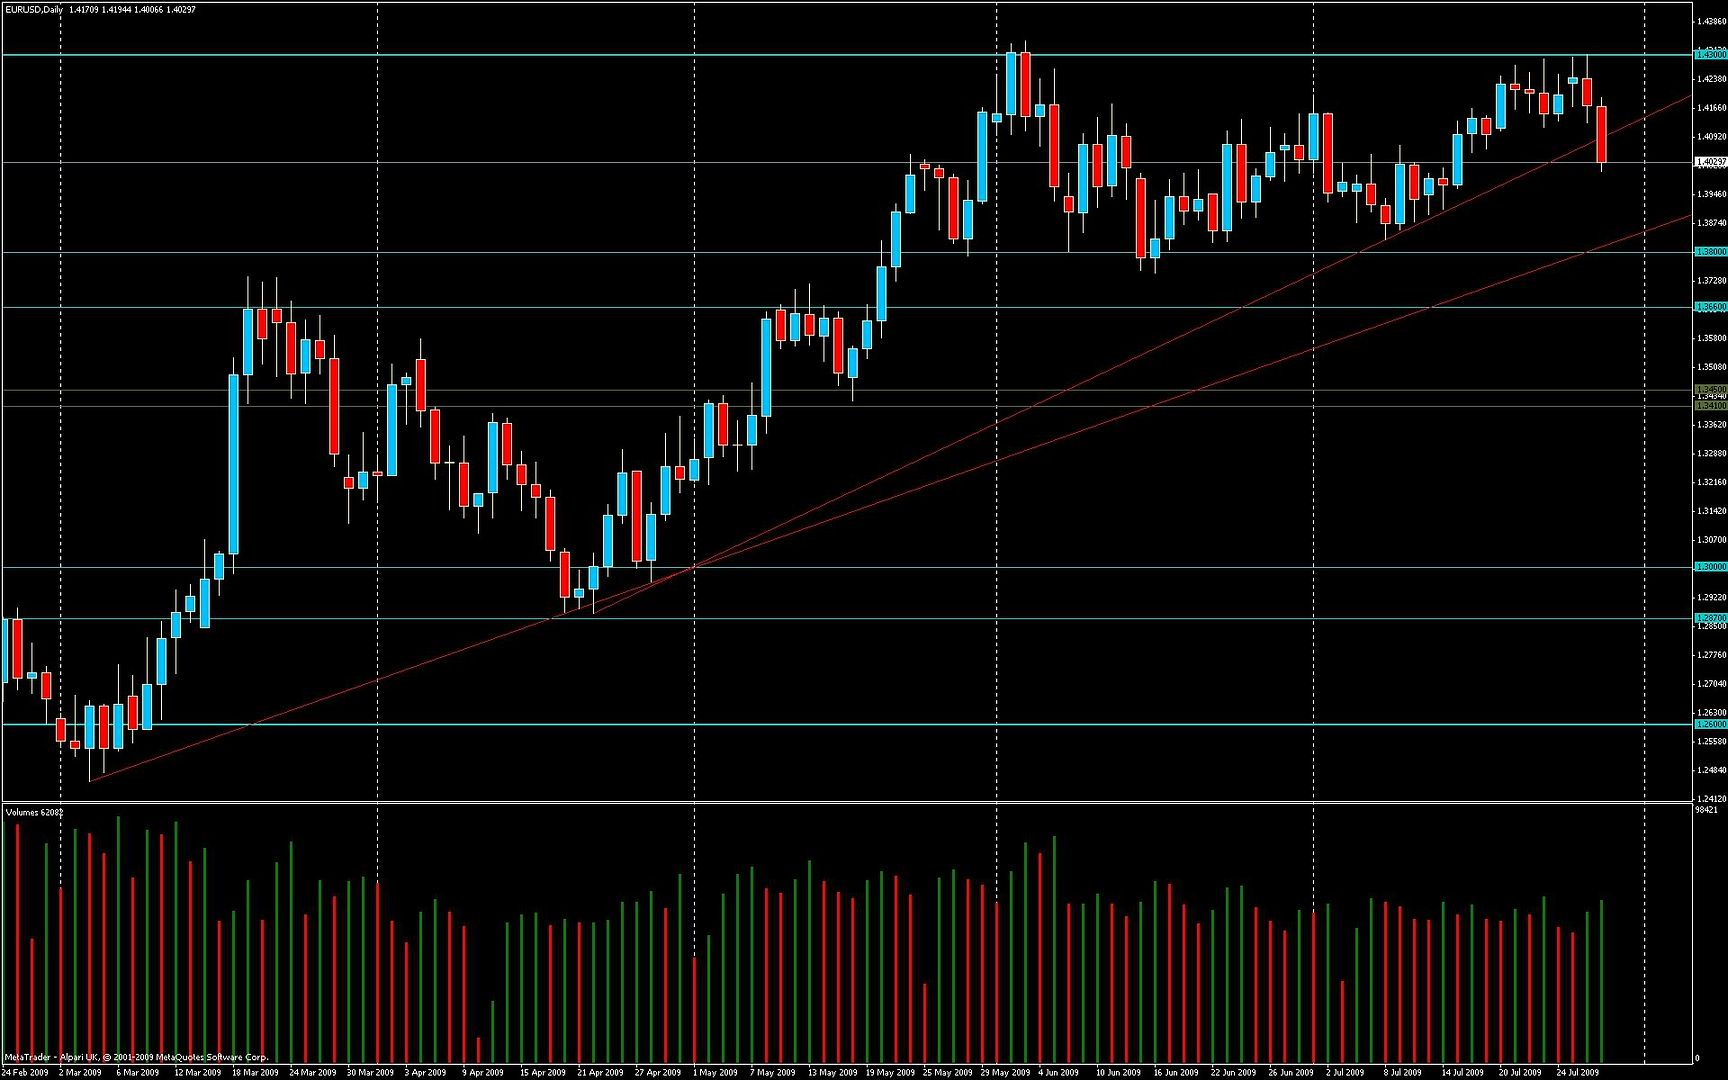
EURUSD
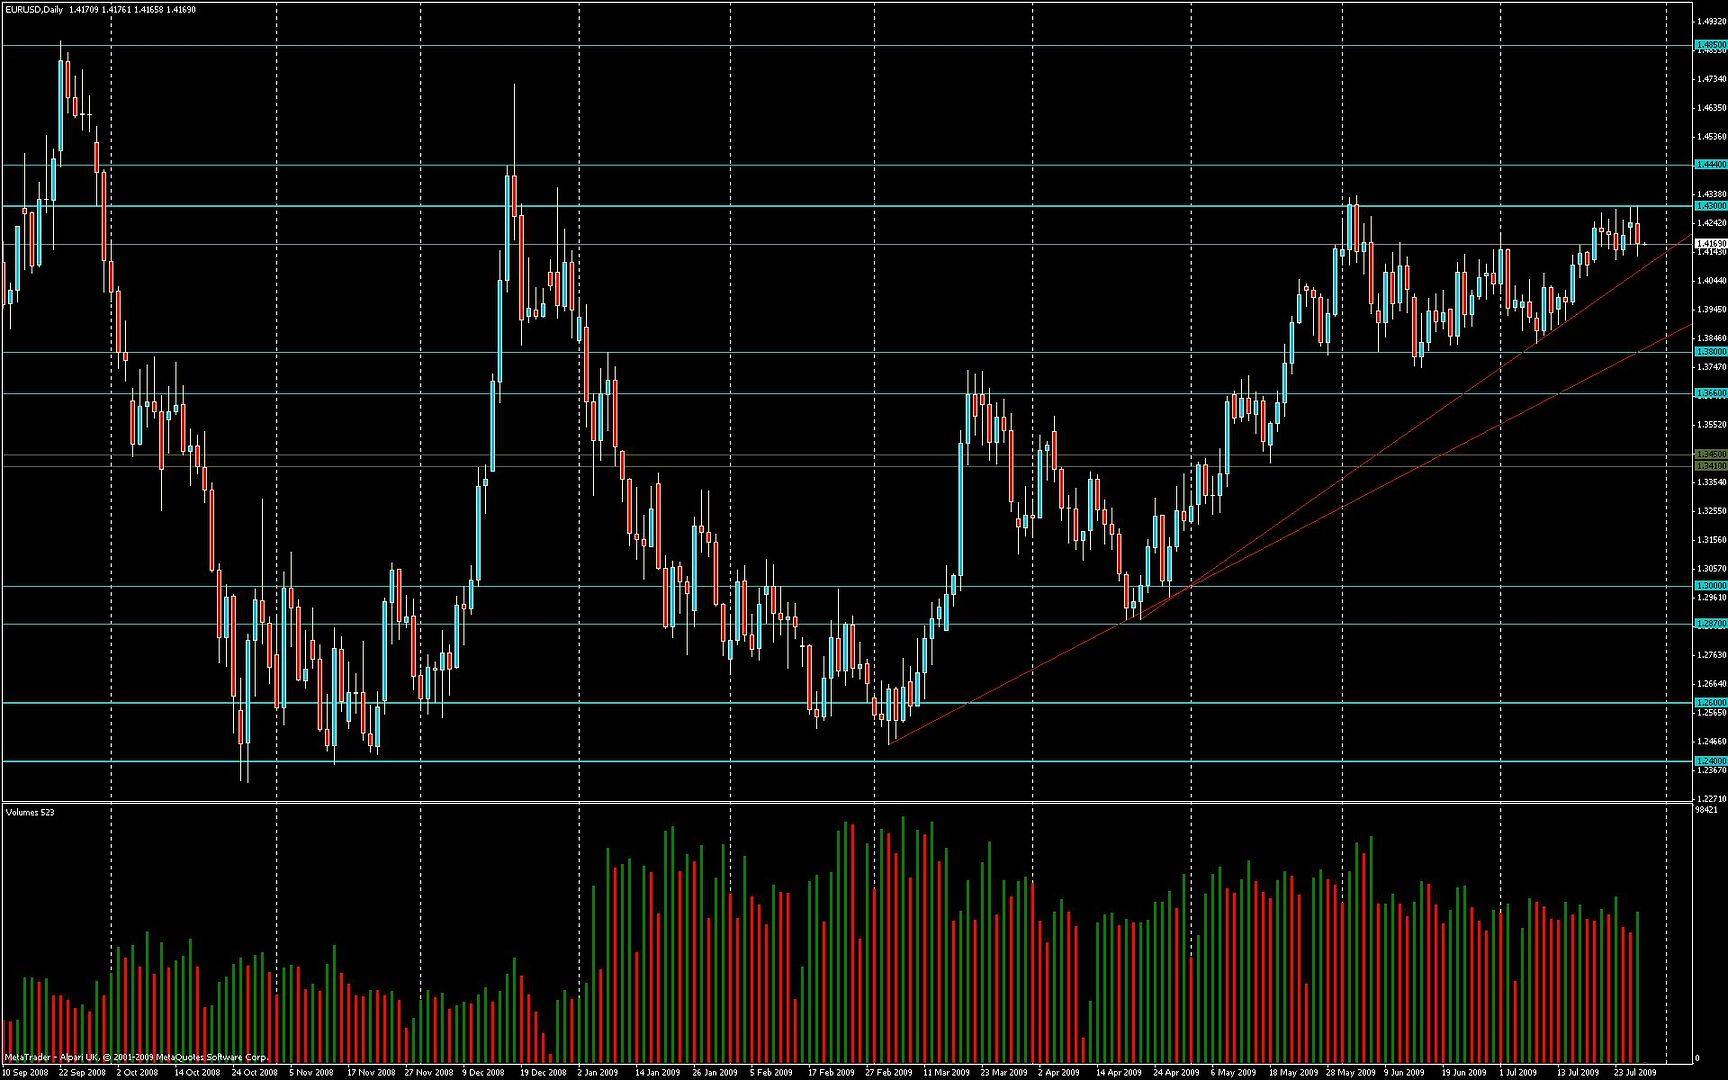
Chart patterns: Potential double top with second top now forming. Not a text book example of the pattern.
General S/R analysis: Price tested the Strong R at 1.43 and failed today. On the downside there are two S trendlines, the first one coming in at approx 1.41 if reached 20090729. The older trendline is a bit further down.
VSA: Several long wicked candles recently. Seems to not be much strength in up moves.
Bias: Bearish