My Trading Log

Have you ever wondered about the reason [B][U]why[/U][/B] the prop desks of the world can achieve so much by [U]expending relatively little at strategic price levels and times[/U]?

The problem that we have today is that so many people are easily led around by chart patterns.

By painting charts the short term technical patterns are used to dupe the crowd and is easily led in circles because so much money is at stake.

The crowd ends up going long, getting stopped out, then going short, then getting stopped out, then reversing back to long, then getting stopped out again until the crowd is eventually [B][U]cleaned out[/U][/B].

And [B][U]then[/U][/B] HUGE OPPORTUNITIES are created that [U]provide small risk, high probability chances for big profits.[/U]

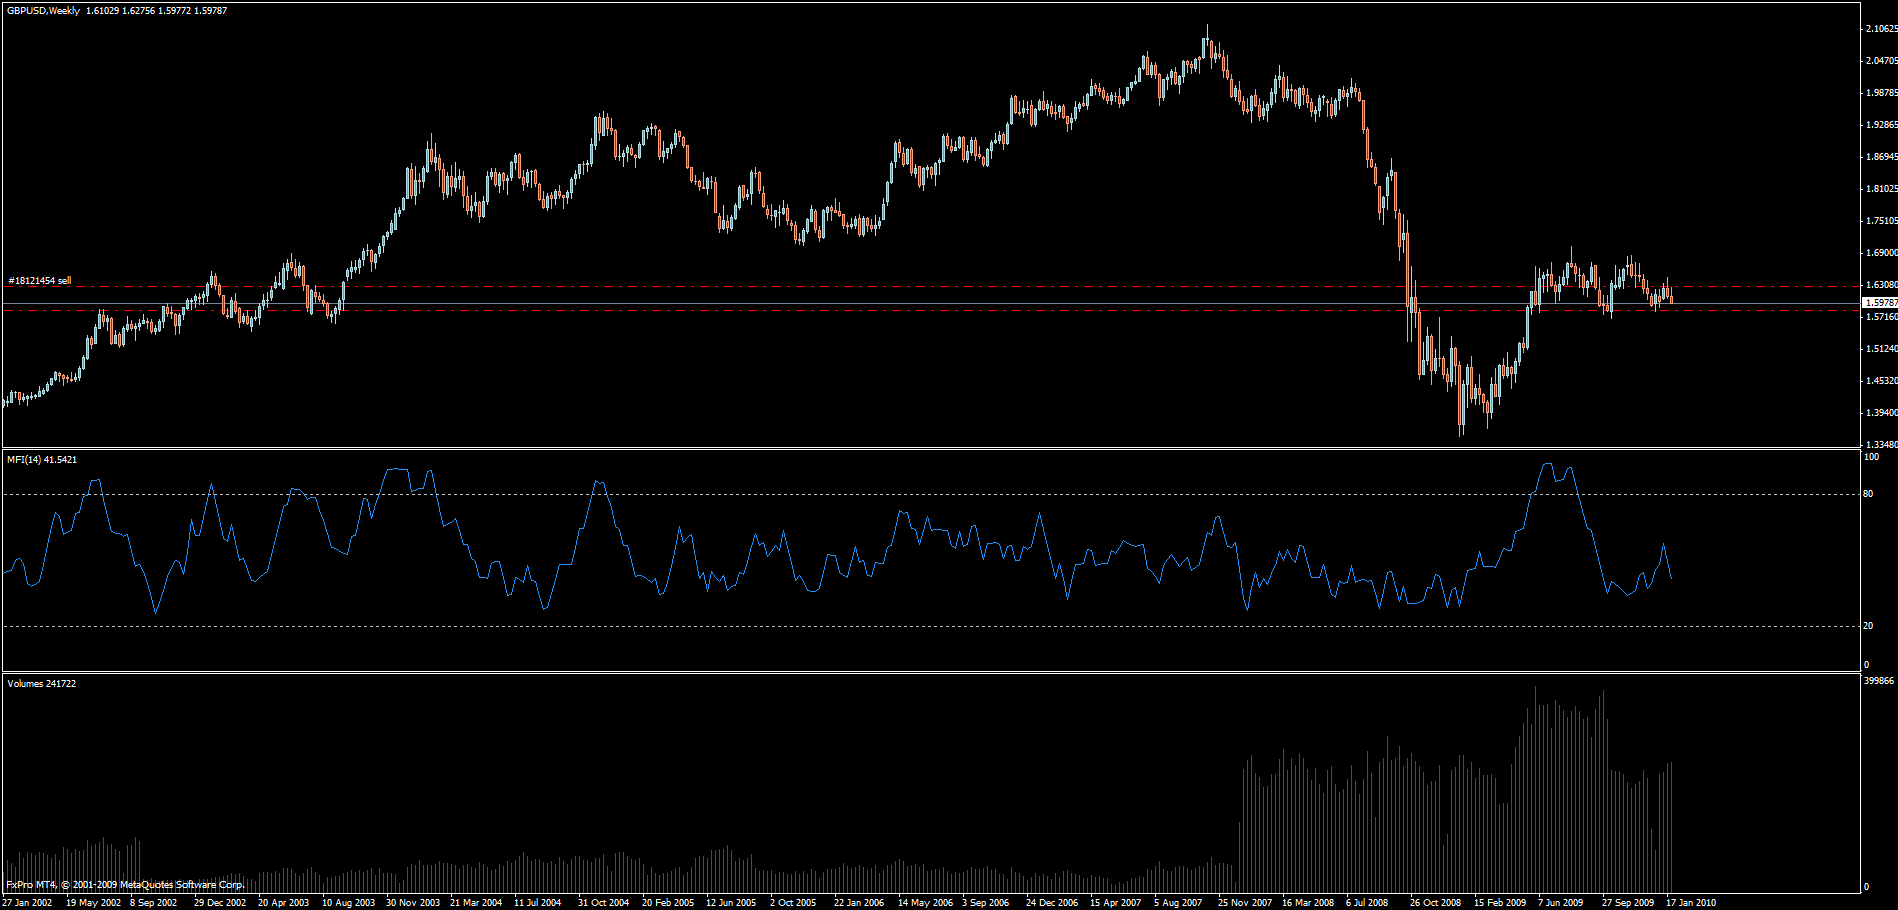
Everything looks bearish for GBPUSD now and logic therefor tells us/me to stay with the flow for as far as it will take us/me.

Profits aren’t generated by adhering to logic

I’m leaning towards doing this and [B][U]trailing my stop far enough behind[/U][/B] to allow some chop.

How far is far enough and not being inside the cluster of stops?

Watching the rear view mirror of your active trades to see who is behind you keeps your trades alive.

I guess you referred to MFI going below 20 on the 1H, and/or the divergence pointed out by tj? I try to stay with the higher time frames, 1H is off limits to me.

Try one week and one month TF.

Waiting game?

Easy solution. Do the opposite of what technical signals call for?

I agree with you on that. In my own short experience I’ve found that the classical chart patterns, H&S for instance, tend to fail more often than you’d expect.

The fact that these patterns are watched and known by more or less everyone in the market, retail and pro alike, may in fact cause a reverse self fulfilling prophecy effect, is my hypothesis anyway.

Of course it’ll be the big and smart money causing and profiting from this. Sounds like Mulder’s conspiracy theories, but I think this may very well be what’s going on.

Yes, but that would often or perhaps almost always require the ability to watch the markets close to 24/6 and that’s not an option for me.

I try to find the best setups I can on daily charts which will always mean larger SL and less impressive risk:reward than someone able to enter intraday.

I’m fine with that though, it’s what works for me and my circumstances.

I think I get you. You’re referring to the fact that trading is less science and more art? I agree with that, understand crowd behavior and we’ll trade profitably.

I should perhaps have exchanged “logic” for “trading plan” in that sentence. Makes better sense?

How about a little distance beyond last weeks high, for now, and then trailing it behind obvious resistance levels that appear?

My volume data makes MFI a no-go. See how bizarre volume data is:

What would happen if you sent that chart to your broker? Could they fix it?

The volume on both charts seems to agree.

:slight_smile:
You got duped.

The fact that these patterns are watched and known by more or less everyone in the market, retail and pro alike, may in fact [B]cause a reverse self fulfilling prophecy effect[/B], is my hypothesis anyway.

That’s how markets move to those strategic price levels and times I was mentioning before.

Market participants throw their orders into the markets at a specific level, which in turn attracts more orders.

It slows when some or all decide to pull those orders back out again. The directional flow of the price action at that point will depend on why those exit orders were encashed and what spooked market participants.

A spook is easily done with chart painting outside strategic price levels and times.

Of course it’ll be the [B]big and smart money[/B] causing and profiting from this.

They are the ones who are generating money flows and you want to get in synch with money flows to avoid being spooked out.

Yes, but that would often or perhaps almost always require the ability to watch the markets close to 24/6 and that’s not an option for me.

That would depend on the situation the markets find themselves in.

If strategic price levels and times are coming into view then yes a 24/6 babysitting of the markets would be required.

Let’s be honest about this. You are up against traders dedicated a 100% to completely wiring themselves into the circuit. When they switch on the screens they are ready for some serious rock’n roll with everything else put to the side.

I’m not saying everyone has to go to those extremes in order to make a little money out of the markets - - but that’s the kind of competitor you are up against when you click your buy/sell button.

How about a little distance beyond last weeks high, for now, and then trailing it behind obvious resistance levels that appear?

What are resistance levels?
Aren’t they the same dupe as the rest outside strategic price levels and times?

How about above the last bar before G/U drop last week wednesday/thursday and trailing it with a distance equal to today’s open, checking it after each session Asia/Europe/NY ends in the next couple of days?

I don’t think so, it’s simply the data they provide…

Yes, I’m well aware of what I’m up against. That’s why I don’t try to compete with the pros intraday on short time frames. My chances are better on dailies and weeklies.

I’d venture to say no, chart patterns and S/R are not the same thing. S/R works very well for me and I repeatedly see price behaving as I expect when it interacts with these zones.

I know you and xtraction and others prefer markers like weekly open and last weeks h/l. I’m sure that works just as well, but I’m comfortable with my current strat so I’m sticking with S/R.

Yes, I see the logic (pun intended;)) in that, smart money stops would be placed somewhere above that bar and it should therefor be as safe a stop location as we can get.

GU failed to pass the december 30 1.5828 mark by 15 pips at Europe session, today. Also, GU passed friday’s high mark by 4 pips at 1.5974 during Asian session, today.

The buyers haven taken over for the time being.

Is that trailing stop getting too close inside the day’s range depending on your broker feed?

What is your reading on the GU trade stop location map now, Mr. o990l6mh? :slight_smile:

Call me a coward but I just closed out my position for a 5.56% account increase.

Looks like there’s a retrace going on and I’ll be looking to get in short again if opportunity presents itself. For now I’m happy to bank my profit and stand aside.

So much for holding it huh…

:smiley:

Because the contents where so valuable and correct that people wanted others to read it too? :D:D

My reading was that I wanted to keep what I had (fear maybe), so I closed out before the probable retracement.

Now I’m flat and unbiased in my analysis. Watch out next A+ setup, I’m coming for you…

How about you? Sitting tight in a GU short?

I don’t know. Should I?

You bailed out with a nice profit. If you exit rules told you so then there is nothing wrong with that.

[B]Looks like there’s a retrace going on[/B] and I’ll be looking to get in short again if opportunity presents itself. For now I’m happy to bank my profit and stand aside.

There have been two order flow bursts on the long side at NY session start and Frankfurt session end, respectively.
That was enough to spook some weak shorts.
No damage done.
The move did not attract decent participation. Most recent Asian high did hold.

So much for holding it huh…

Different psychology tolerances for different types.

Just placed a bank wire to Oanda. My reward to myself for not having lost money this month (since inception of my trading plan). Hope to be doing the same thing this time next month.

Tomorrow I’m going to (if I remember to) make a post about how we can use monthly charts to create a bias for ourselves when looking at daily charts.

A hint is: take a alook at the monthly AUDUSD chart. In my view, it’s screaming SHORT at us. This is something we can benefit from if/when we find a short setup on the pair.

In short…, it’s the power of going with the higher time frame.

No trades for me tonight.

I see on another thread some are thinking of taking the bearish formation on USDCAD. I’m not, I think it’s running into support too soon, plus you’d be trading against not one but two monthly pin bars, neither of which have been invalidated. Not A±ish enough in my book.

Me, I just need 1-5 [B]great[/B] setups this month. They’ll come if we wait, and if they don’t we’ll just wait until they do show up. Simple.

No. That’s what my greed side called my fear side today. I didn’t listen though and decided to follow my original plan of exiting around here.

I did notice that the opening gap held as resistance, but I still decided to go flat and wait for the next trade to come along. Maybe it’ll be the same pair and direction again, who knows.

Oh yes, I still have much to learn. Holding on through a long trend is one of many things for me to work on.

Now I’m flat and unbiased in my analysis. Watch out next A+ setup, I’m coming for you…

LOL
What you want to come for?

GU Shorts/Longs are at logger heads at a strategic price level in a very resticted range. That has been going on since NY session, yesterday.

Tickets anybody? :slight_smile:

How about you? Sitting tight in a GU short?

I am engaged since second week in January 2010 in this GU short gig. This is a medium term play for me until I get an exit signal. It can last another couple of weeks or it can be over the next minute. We will see. Provided I don’t do anything stupid and get mugged.

I like those tight ranges. Makes for good breakouts.

I meant I’m coming for the trade setup, not you :smiley:

Hey, English isn’t my first language :o (always a handy excuse :D)

Question: would you take a longer term trade in the spot market if the swap is negative, or would you choose another instrument?

It’s quite costly shorting for instance AUDUSD for a long holding period.