My Trading Log

Well, might as well share the position size spreadsheet tonight.

If any savvy math wiz finds I haven’t done the calculations properly I’m all ears. :wink:

Anyhow, remember that this works correctly only if your account is in EUR and you have to update the current price of the instruments regularly as well as fill in desired risk, your account balance, +1 for a buy trade and -1 for a sell trade in the G column and also entry and SL price.

As for XAGUSD and XAUUSD my calculations seem to work for how Oanda quotes prices on those two metals but I make no promise that it’ll work for other brokers as they may quote with more or fewer decimal places.

Since excel files can’t be uploaded I’ve zipped it, see below:

MacGyver EUR account position size calculator.zip (3.5 KB)

Heres my Positioning Chart, I just made: heres how to use:
The sheet is for 50 000 account (demo), assuming that pairs traded are given in dollars. e.g that one pip gain in a mini 10 000 lot, is $1.
Ex:

If I was to trade with 35 pip stop loss, with a risk of 2% (1000 dollar w/ 50 000 capital), my lot size would be 268 K`s rounded down to nearest 10 K is 260 K, or 260 000 units of currency.

Please let me know if I have done wrong ****, as i will mostly use this when trading my demo account, lol


I think you switched the 6 and the 8 around, see above, but other than that it seems right to me.

I know, I promised for sure to present the material no later than this weekend. That was however before I knew I’d spend it helping my parents with some stuff so…

I’ll post it asap but I’ll be traveling for a bit next week so it will be when there’s time.

As for trading, this week may produce some above average ATR mileage as we have the US mid term elections as well as NFP.

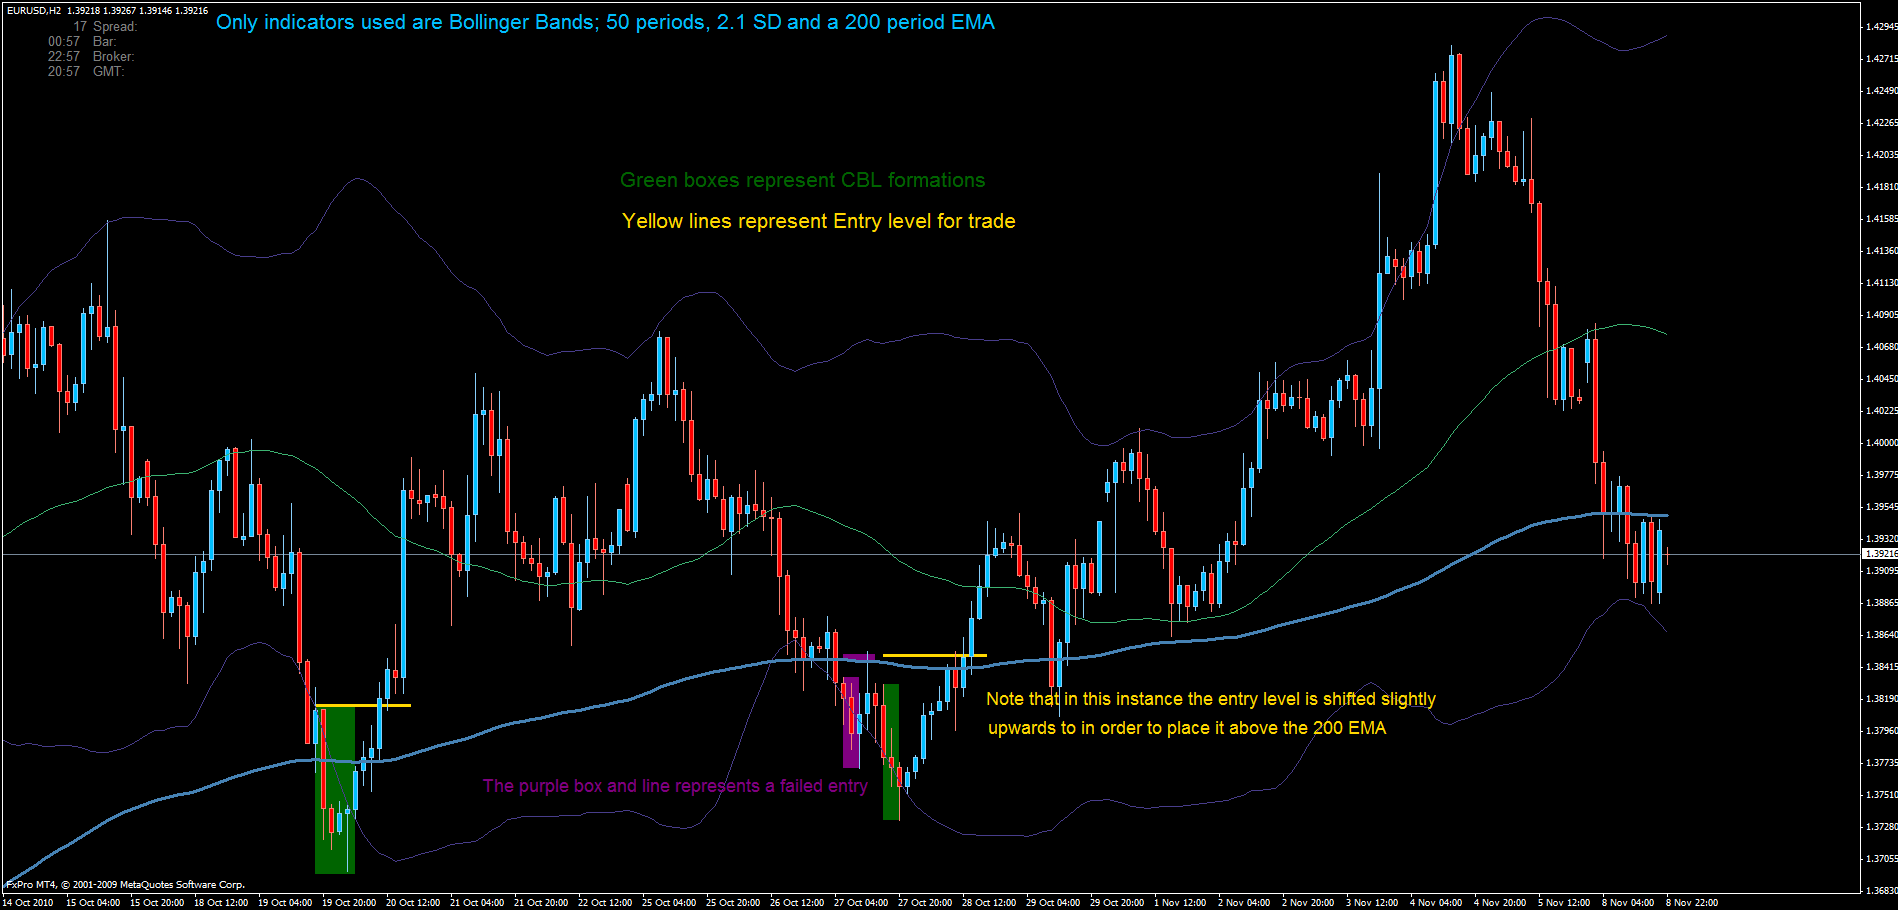
The wait has been long enough. I’m going to post a chart tonight that gives a pretty good idea of my approach. It’s extremely simple and at the same time it still manages to fulfill the criteria I have. For instance it offers entries exclusively with the trend, it offers on average better than 1R trades (often much better), etc.

Now, the chart below speaks for itself I guess, but to clarify: I look for trades when price has been trending above or below the 200EMA - indicating a trend. When price then retraces towards the 200EMA and comes into contact with the outer Bollinger Band I place a CBL entry to get in when the retrace ends and the trend resumes - which we know it does most of the time, giving us a high probability setup.

The sharp reader will realize that this principle is exactly the same that I’ve used earlier as well. The gain for me by adding the EMA and BB is that chart analysis now requires virtually no time at all. The other benefit is that the chart analysis becomes more mechanical and less discretionary than before.

From what I’ve been able to tell, this approach is completely time frame independent. Due to work etc I plan to use the 2H TF as my home chart but for a full time trader it might be possible to trade profitably with this approach on any intraday TF.

An updated Trading Plan is also forthcoming. With the spreadsheet and the Trading Plan finished I then intend to resume trading my Live Kelly Demo. :wink:

Rules and Goals:

[ol]
[li] The goal of the demo trading is to achieve a net profitable result after a minimum of twelve consecutive weeks.[/li]Only weeks when trades have been taken count, no trading weeks are viewed as non existent when performance is reviewed.
[li] The home chart for trading will be the 2H time frame.[/li]4H and 8H are also allowed for trading.
[LIST=1]
[li] Lower time frames may be used for trading in the future.[/li][/ol]

[li] Charts and demo accounts[/li][ol]
[li] Netdania.com ChartStation demo will be used for all charting[/li][LIST=1]
[li] 2H bars close at 00, 02, 04, 06, 08, 10, 12, 14, 16, 18, 20, 22 GMT+1[/li][li] 4H bars close at 02, 06, 10, 14, 18, 22 GMT+1[/li][li] 8H bars close at 02, 10, 18 GMT+1[/li][/ol]

[li] Trading will be performed with an Oanda FXTrade account.[/li][li] Trades will be placed using Oanda FXTrade and Oanda FXTrade for Android.[/li][/LIST]

[li] The charts will be checked when a bar closes except during night hours or when circumstances cause a delay.[/li][li] All trades are placed using pending orders and trades are triggered if/when the CBL entry line is reached by price. The CBL is always used for entries.[/li][li] Risk per trade[/li][ol]
[li] On the Kelly demo the risk will be 20%[/li][LIST=1]
[li] Since sufficient trading data does not exist this figure is based on a reasonably conservative estimate where a win rate of 60% is combined with an average reward of 1R.[/li][li] When enough trading data exists the risk will be adjusted to reflect this.[/li][/ol]

[li] Maximum simultaneous risk will be 20%[/li][/LIST]

[li] Stop loss is always used and it is placed a few pips beyond the high/low of the CBL formation.[/li][ol]
[li] The stop loss is moved to break even at around 1R as circumstances allow.[/li][/ol]

[li] Trades can be exited in three different ways:[/li][ol]
[li] By trailing the stop loss behind swing levels[/li][li] By exiting at a predetermined level or R multiple[/li][li] By stop loss being hit[/li][/ol]

[li] Funds will not be added to the demo account at all[/li][ol]
[li] If/when the method is used for live trading the main account funds will be added only after a profitable month when trades have been taken.[/li][/ol]

[li] Records:[/li][ol]
[li] All trades will be recorded in the online service MyFXBook.[/li][/ol]

[li] During the weekend as well as every evening a detailed analysis is performed where the most promising pairs are noted and placed on the Watchlist. The Watchlist may contain a maximum of six pairs.[/li][li] Position size is calculated by use of the custom made spreadsheet.[/li][li] The setup/chart analysis used for trading is as follows:[/li][ol]
[li] Charting and observation of S/R zones from the time frame one step above the home chart.[/li][li] Retracement in a trend where the trend is determined by a 200 period EMA.[/li][li] The retracement must touch or come into very close vicinity of the outer band of Bollinger Bands with the settings; 50 periods, 2.1 Standard Deviations.[/li][LIST=1]
[li] The setup is further strengthened if the retracement also reaches and bounces off of a S/R zone.[/li][/ol]

[li] A CBL is calculated and used for entry with the trend, position size is determined using the custom made spreadsheet. The CBL line must be located above the EMA for uptrends and vice versa for downtrends.[/li][li] The expected reward must be larger than the risk.[/li][/LIST]

[/LIST]

Good luck!

But 20% risk? That sounds like a lot??

It is indeed. I’m basing it on something called the Kelly criterion which is, put short, a mathematical formula for determining the optimum bet size based on knowing your win rate and the average return of winning trades.

I’ve decided to find out whether it works in reality. If it doesn’t I’ll be going back to the standard 2%.

I guess that makes sense. Sort of like increasing the risk when more and more factors are pointing in your favor?

Yes one could say that.

No, that area has been as quiet as a well sound proofed grave :smiley:

I’m pausing until I’ve managed to finish my latest revision to the trading plan, hoping to get back on track on Monday.

Right now I’m debating with myself which is best to use, Bollinger Bands with standard settings, or with 50 periods and 2.1 standard deviations. I guess I have to scrool through charts for quite a bit to decide.

What about you? I see you posting sometimes in the ATT thread and making excellent vids in your own thread, are you doing any trading as well?

what is that math formula?

A few links for you:

Investopedia: Money Management Using the Kelly Criterion

Wikipedia: Kelly criterion - Wikipedia, the free encyclopedia

Edward O Thorp excerpt: http://www.edwardothorp.com/sitebuildercontent/sitebuilderfiles/KellyCriterion2007.pdf

If you just want the formula, check the investopedia link. If you want to know more about the idea check the other links as well.

Rules and Goals:

[ol]
[li] The goal of the demo trading is to achieve a net profitable result after a minimum of twelve consecutive weeks.[/li]Only weeks when trades have been taken count, no trading weeks are viewed as non existent when performance is reviewed.
[li] The home chart for trading will be the 2H time frame.[/li]4H and 8H are also allowed for trading.
[LIST=1]
[li] Lower time frames may be used for trading in the future.[/li][/ol]

[li] Charts and demo accounts[/li][ol]
[li] Netdania.com ChartStation demo will be used for all charting[/li][LIST=1]
[li] 2H bars close at 00, 02, 04, 06, 08, 10, 12, 14, 16, 18, 20, 22 GMT+1[/li][li] 4H bars close at 02, 06, 10, 14, 18, 22 GMT+1[/li][li] 8H bars close at 02, 10, 18 GMT+1[/li][/ol]

[li] Trading will be performed with an Oanda FXTrade account.[/li][li] Trades will be placed using Oanda FXTrade and Oanda FXTrade for Android.[/li][/LIST]

[li] The charts will be checked when a bar closes except during night hours or when circumstances cause a delay.[/li][li] All trades are placed using pending orders and trades are triggered if/when the CBL entry line is reached by price. The CBL is always used for entries.[/li][li] Risk per trade[/li][ol]
[li] On the Kelly demo the risk will be 20%[/li][LIST=1]
[li] Since sufficient trading data does not exist this figure is based on a reasonably conservative estimate where a win rate of 60% is combined with an average reward of 1R.[/li][li] When enough trading data exists the risk will be adjusted to reflect this.[/li][/ol]

[li] Maximum simultaneous risk will be 20%[/li][/LIST]

[li] Stop loss is always used and it is placed a few pips beyond the high/low of the CBL formation.[/li][ol]
[li] The stop loss is moved to break even at around 1R as circumstances allow.[/li][/ol]

[li] Trades can be exited in three different ways:[/li][ol]
[li] By trailing the stop loss behind swing levels[/li][li] By exiting at a predetermined level or R multiple[/li][li] By stop loss being hit[/li][/ol]

[li] Funds will not be added to the demo account at all[/li][ol]
[li] If/when the method is used for live trading the main account funds will be added only after a profitable month when trades have been taken.[/li][/ol]

[li] Records:[/li][ol]
[li] All trades will be recorded in the online service MyFXBook.[/li][/ol]

[li] During the weekend as well as every evening a detailed analysis is performed where the most promising pairs are noted and placed on the Watchlist. The Watchlist may contain a maximum of six pairs.[/li][li] Position size is calculated by use of the custom made spreadsheet.[/li][li] The setup/chart analysis used for trading is as follows:[/li][ol]
[li] Charting and observation of S/R zones from the time frame one step above the home chart.[/li][li] Retracement in a trend where the trend is determined by a 200 period EMA.[/li][li] The retracement must touch or come into very close vicinity of the outer band of Bollinger Bands with the settings; 20 periods, 2.0 Standard Deviations.[/li]The setup is further strengthened if the retracement also reaches and bounces off of a S/R zone.
[li]A CBL is calculated and used for entry with the trend, position size is determined using the custom made spreadsheet. The CBL line must be located above the EMA for uptrends and vice versa for downtrends.[/li][li]The expected reward must be larger than the risk.[/li][/ol]

[/LIST]

Been scrolling through a lot of charts and my conclusion is that when you combine the BB with S/R, standard settings work better. When using them standalone, 50 periods actually seem to work better.

Since I view S/R as a vital part of price analysis, standard settings it is.

Sunday I’ll place S/R on as many pairs as I have time for, hopefully all of them, and then off we go on Monday.

Well, I’ve looked at a variant of using the mid BB in combination with a CBL entry. I got more whipsaws than I could accept though but it may be something to investigate again as time permits.

Right now I’m working on how I’ll use S/R. I have a few different options. One could place S/R “as usual” at PPZ etc, or or one could use lines such as weekly open, high, lows. Or any combination.

I’ve been scrolling through some charts today using just the weekly open as a sort of pivot line, ie only short trades below and vice versa, and it looks very promising.
If it holds water I’d be very pleased as I could then do without other S/R lines and it would be a quick, neat and standardized process.

I’ll post some charts to show what I’m talking about later if I don’t scrap the concept first.

I’m not ready for trading just yet, I’m currently trying to figure out how to use horizontal lines on my charts in a way that is as simple as possible.

Instead of using the usual “discretionary” lines I’m looking at the possibility of using something like the weekly open, high, low as directional guides. All together or just one of them. Currently leaning towards just the weekly open.

Anyway, another week of no trading ahead… almost starting to wonder whether I’m a trader or a theorist…

I once read a really good book; [I][B]Zen and the Art of Motorcycle Maintenance: An Inquiry into Values[/B][/I], a 1974 novel by Robert M. Pirsig (on a recommendation from my father btw, one of the wisest men I know of)

Anyhow, the author describes something that he calls a gumption trap in that book. Gumption trap - Wikipedia

Days like yours today push us towards the gumption trap. Solution? Sleep, wake up to a new day. :slight_smile:

You should be pleased with the fact that your trading style is generating profitable signals instead of fretting over missing some of them.

I know how it feels to sense that one has wasted time instead of making good use of it. It’s a really annoying feeling, use it in a positive way tomorrow.

Sharp and alert, not trigger-happy. :wink:

Rules and Goals:

[ol]
[li] The goal of the demo trading is to achieve a net profitable result after a minimum of twelve consecutive weeks.[/li]Only weeks when trades have been taken count, no trading weeks are viewed as non existent when performance is reviewed.
[li] The home chart for trading will be the 2H time frame.[/li]4H and 8H are also allowed for trading.

[LIST=1]
[li] Lower time frames may be used for trading in the future.[/li][/ol]

[li] Charts and demo accounts[/li]
[ol]
[li] Netdania.com ChartStation demo will be used for all charting[/li]
[LIST=1]
[li] 2H bars close at 00, 02, 04, 06, 08, 10, 12, 14, 16, 18, 20, 22 GMT+1[/li][li] 4H bars close at 02, 06, 10, 14, 18, 22 GMT+1[/li][li] 8H bars close at 02, 10, 18 GMT+1[/li][/ol]

[li] Trading will be performed with an Oanda FXTrade account.[/li][li] Trades will be placed using Oanda FXTrade and Oanda FXTrade for Android.[/li][/LIST]

[li] The charts will be checked when a bar closes except during night hours or when circumstances cause a delay.[/li][li] All trades are placed using pending orders and trades are triggered if/when the CBL entry line is reached by price. The CBL is always used for entries.[/li][li] Risk per trade[/li]
[ol]
[li] On the Kelly demo the risk will be 20%[/li]
[LIST=1]
[li] Since sufficient trading data does not exist this figure is based on a reasonably conservative estimate where a win rate of 60% is combined with an average reward of 1R.[/li][li] When enough trading data exists the Kelly risk calculation will be adjusted to reflect this.[/li][/ol]

[li] Maximum simultaneous risk will be 20%[/li][/LIST]

[li] Stop loss is always used and it is placed a few pips beyond the high/low of the CBL formation.[/li]
[ol]
[li] The stop loss is moved to break even at around 1R as circumstances allow.[/li][/ol]

[li] Trades can be exited in three different ways:[/li]
[ol]
[li] By trailing the stop loss behind swing levels[/li][li] By exiting at a predetermined level or R multiple[/li][li] By stop loss being hit[/li][/ol]

[li] Funds will not be added to the demo account at all[/li]
[ol]
[li] If/when the method is used for live trading the main account funds will be added only after a profitable month when trades have been taken.[/li][/ol]

[li] Records:[/li]
[ol]
[li] All trades will be recorded in the online service MyFXBook.[/li][/ol]

[li] During the weekend as well as every evening a detailed analysis is performed where the most promising pairs are noted and placed on the Watchlist. The Watchlist may contain a maximum of six pairs.[/li][li] Position size is calculated by use of the custom made spreadsheet.[/li][li] The setup/chart analysis used for trading is as follows:[/li]
[ol]
[li] A horizontal line is placed at the opening price of the trading period. A vertical line is also placed at the opening to make it easily visible. The opening line acts as a directional bias where only shorts are traded if price is below and vice versa.[/li]
[LIST=1]
[li] For 2H charts this value will represent the weekly opening price[/li][li] For 4H charts this value will represent the monthly opening price[/li][li] For 8H charts this value will represent the quarterly opening price[/li][/ol]

[li] The trend is determined by a 200 period EMA.[/li][li] When price trades above both the opening line and the EMA, CBL entries are used as price retraces and touches or comes into very close vicinity of the outer band of Bollinger Bands with the settings; 20 periods, 2.0 Standard Deviations.[/li][li] A CBL is calculated and used for entry with the trend, position size is determined using the custom made spreadsheet. [/li][li] The CBL line must be located above the EMA for uptrends and vice versa for downtrends.[/li]The CBL line must also be located above the opening line for long trades and below for short trades.
[li] The expected reward must be equal to or larger than the risk.[/li][/LIST]

[/LIST]