Nasdaq Intraday Elliott Wave view suggests that Intermediate wave (3) ended with the rally to 6429.5. Intermediate wave (4) pullback remains in progress to correct cycle from 8/21 low (5753.6) in 3, 7, or 11 swing before the rally resumes. Intermediate wave (4) is unfolding as a double three Elliott wave structure where Minor wave W ended at 6246 and Minor wave X ended at 6391.75. Minor wave Y of (4) is currently in progress towards 6096.24 – 6209.28 area. Afterwards, Index should resume the rally higher or bounce in 3 waves at minimum. We don’t like selling the proposed pullback and expect buyers to appear from the above area for at least a 3 waves bounce provided that pivot at 8/21 low (5753.6) stays intact.
Nasdaq Short Term Elliott Wave view suggests that Intermediate wave (3) ended at 6429.5 and Intermediate wave (4) pullback is proposed complete at 6231.75. Subdivision of Intermediate wave (4) is unfolding as a double three Elliott wave structure where Minor wave W ended at 6283, Minor wave X ended at 6391.75, and Minor wave Y of (4) ended at 6231.75. Index still needs to break above Intermediate wave (3) at 6429.5 for this view to gain validity. Until then, we still can’t completely rule out a break below Intermediate wave (4) at 6231.75 in a double correction.
Near term, cycle from 12/5 low (6231.75) is mature and expected to complete soon with Minute wave ((w)). Index should then pullback in Minute wave ((x)) to correct cycle from 6231.75 low in 3, 7, or 11 swing before Index resumes the rally. We don’t like selling the proposed pullback.
Nasdaq Elliott Wave Analysis: More Upside Favored While Above 6232.3
Nasdaq Short Term Elliott Wave view suggests that the Index remains bullish as far as pullbacks stay above Intermediate wave (4) at 6232.3. Rally from Intermediate wave (4) low unfolded as a double three Elliott Wave structure where Minor wave W ended at 6545.75 and Minor wave X is proposed complete at 6432.25 in the green box. Internal of Minor wave W unfolded as a double three Elliott Wave structure where Minute wave ((w)) ended at 6427.75, Minute wave ((x)) ended at 6383, and Minute wave ((y)) of W ended at 6545.75.
Internal of Minor wave X unfolded as a double three Elliott Wave structure where Minute wave ((w)) ended at 6463.25, Minute wave ((x)) ended at 6520.75, and Minute wave ((y)) of X ended at 6432.25. Near term, while dips stay above 6432.25, but more importantly as far as pivot at 12/5 low (6232.3) stays intact, expect Index to extend higher. Unless already long with a risk free trade from the green box area, we prefer to wait for the Index to break above Minor wave W at 6545.75 before buying the dips again. Until the Index breaks above Minor wave W at 6545.75, a double correction in Minor wave X still can’t be ruled out.
If the Index breaks below 12/26 low (6432.3) from here, then it could either form a triple three or double three correction from 12/19 peak. In the case of a triple three correction, Index should then extend lower to 6371 – 6391 area to end Minor wave X before the rally resumes. In the case of a double three correction, then Index can go to as low as 6234 – 6361 to end Minor wave X before buyers appear for at least a 3 waves bounce.
Short Term Nasdaq Elliott Wave view suggests that the rally from 12/5 low unfolded as a double three Elliott Wave structure where Minor wave W ended at 6545.75 and Minor wave X ended at 6383.25. This week, the Index made a new high above Minor wave W at 6545.75, suggesting the next leg higher has started. Internal of Minor wave W unfolded as a double three Elliott Wave structure where Minute wave ((w)) ended at 6427.75, Minute wave ((x)) ended at 6383, and Minute wave ((y)) of W ended at 6545.75.
Internal of Minor wave X pullback unfolded as a triple three Elliott Wave structure where Minute wave ((w)) ended at 6463.25, Minute wave ((x)) ended at 6520.75, Minute wave ((y)) ended at 6432.25, and second Minute wave ((x)) of X ended at 6382.44. Near term, rally from 12/30 low (6383.25) is unfolding as an impulse Elliott Wave structure and could see more upside to end 5 waves up in Minute wave ((a)). Afterwards, the Index should pullback in Minute wave ((b)) in 3, 7, or 11 swing to correct cycle from 12/30 low (6382.44) before the rally resumes. We don’t like selling the Index and while Minute wave ((b)) dips stay above 6382.44, expect Index to extend higher.
NASDAQ Elliott Wave Analysis: Nesting Higher As Impulse
NASDAQ ticker symbol: $NQ_F short-term Elliott wave analysis suggests that the rally from 7/30 low ($7167.75) to $7505.25 high ended Intermediate wave (1). The internals of lesser degree cycles within Intermediate wave (1) unfolded as 5 waves impulse structure. Down from there, the correction against that cycle in Intermediate wave (2) pullback is proposed complete at $7316.5 low. The subdivision of Intermediate wave (2) unfolded as double three structure. Where Minor wave W ended at $7378.25. The rally to $7479 high ended Minor wave X. And the decline to $7316.45 low ended Minor wave Y of (2).
Above from there, the NASDAQ has already made a new all-time high confirming the next extension higher in Intermediate wave (3) higher has started. The internals of the rally higher is unfolding as 5 waves impulse structure. Where Minute wave ((i)) ended in 5 waves at $7433.5 high. Then the pullback to $7352 low ended Minute wave ((ii)) pullback as a Flat structure. Up from there, the index is nesting higher in Minute wave ((iii)) with lesser degree cycles showing 5 wave advance. Near-term, as far as a pivot from $7316.45 low remains intact index is expected to see more upside. We don’t like selling it and expect buyers to appear in 3, 7 or 11 swings against $7316.45 low in the first degree.
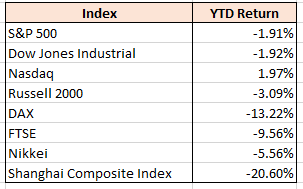
Global Indices continue to retreat in the fourth quarter of this year as the combination of Fed’s quantitative tightening and escalating trade wars threatens to derail the 10 year bullish market. Below is the Year-to-Date return of the Global Indices as of Friday Nov 24:
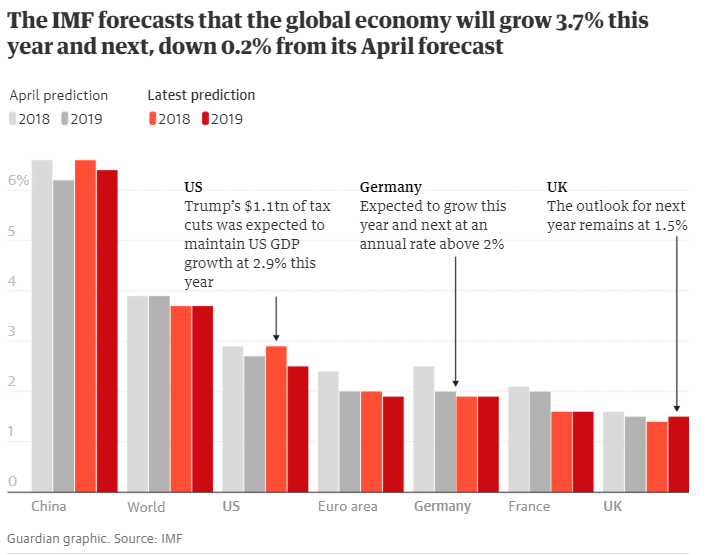
Next week, global Indices will have a chance to find support if the U.S. and China are able to bridge their differences in G20 meeting. Beijing and Washington have engaged in an escalating tit-for-tat trade war since this summer. The U.S imposed tariffs on Chinese goods worth US $250 billion per year, while China imposed tariffs on U.S. goods worth US $110 billion. The IMF warned that rising trade tensions could cost the global economy $430 billion and lower global growth by as much as 0.5% by 2020.
President Trump and Xi will meet on the sidelines on Nov 31 and Dec 1 in Argentina at G20 summit to try to strike a deal. President Trump has threatened to increase the tariffs on $200 billion Chinese imports from 10% – 25% starting January next year if there’s no agreement. On the other hand, China does not show any willingness to bend the knee and lose face. The summit will be an opportunity to broker ceasefire and avoid further escalation, although it remains to be seen if it can reverse the previously announced tariffs.
Should there be a truce made, global Indices can see support after the current selloff is over and see at least a 3 waves rally. However, if the meeting fails to produce any deal, then global Indices could continue to see weakness until the end of the year.
Nasdaq Daily Outlook suggests lower stock market
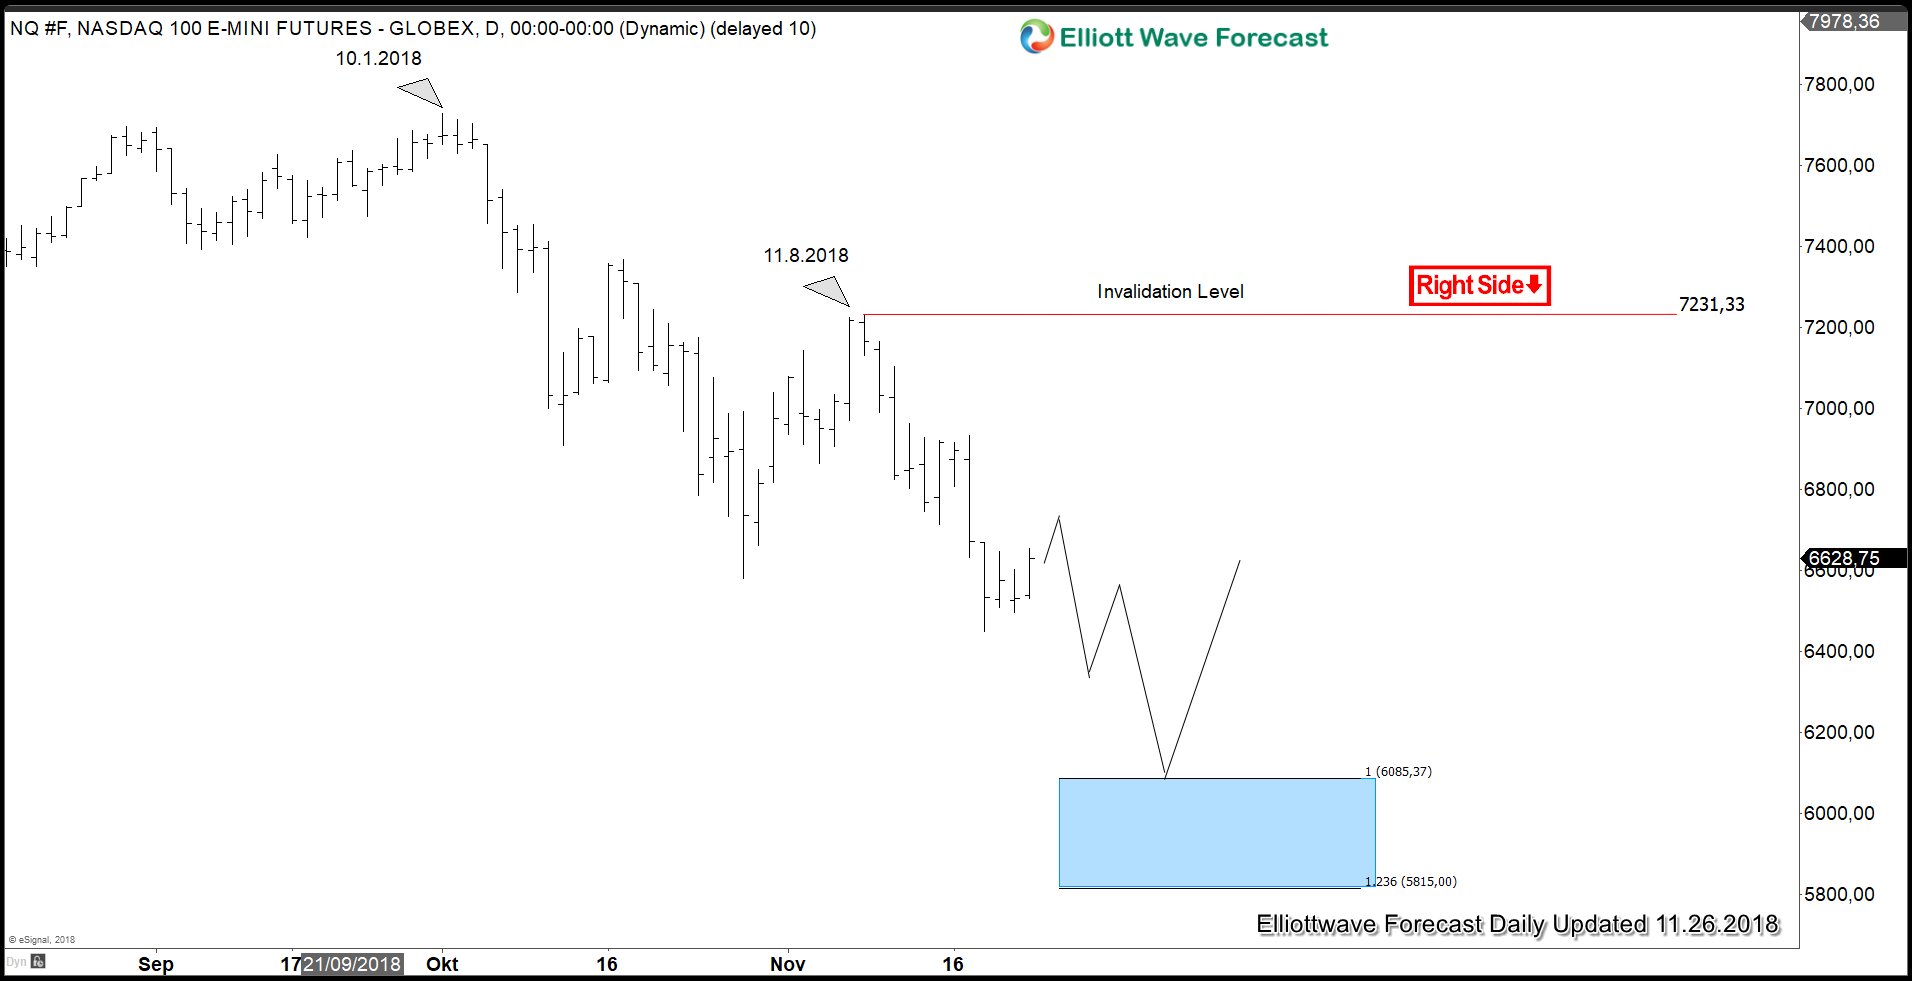
Despite still showing positive YTD return, Nasdaq has pull back 16% from the peak of 2018 in less than 2 months. The Index shows incomplete bearish sequence from 10.1.2018 high favoring further downside to 5815 – 6085 blue box as far as near term rally stays below 7231.3. We should expect the Index to continue lower next week towards the blue box. If the Index has reached the box prior to the G20 meeting and the outcome is positive, then it can trigger at least a 3 waves rally from the box to at least correct the decline from 10.1.2018 peak.
Nasdaq Short Term Elliott Wave Outlook
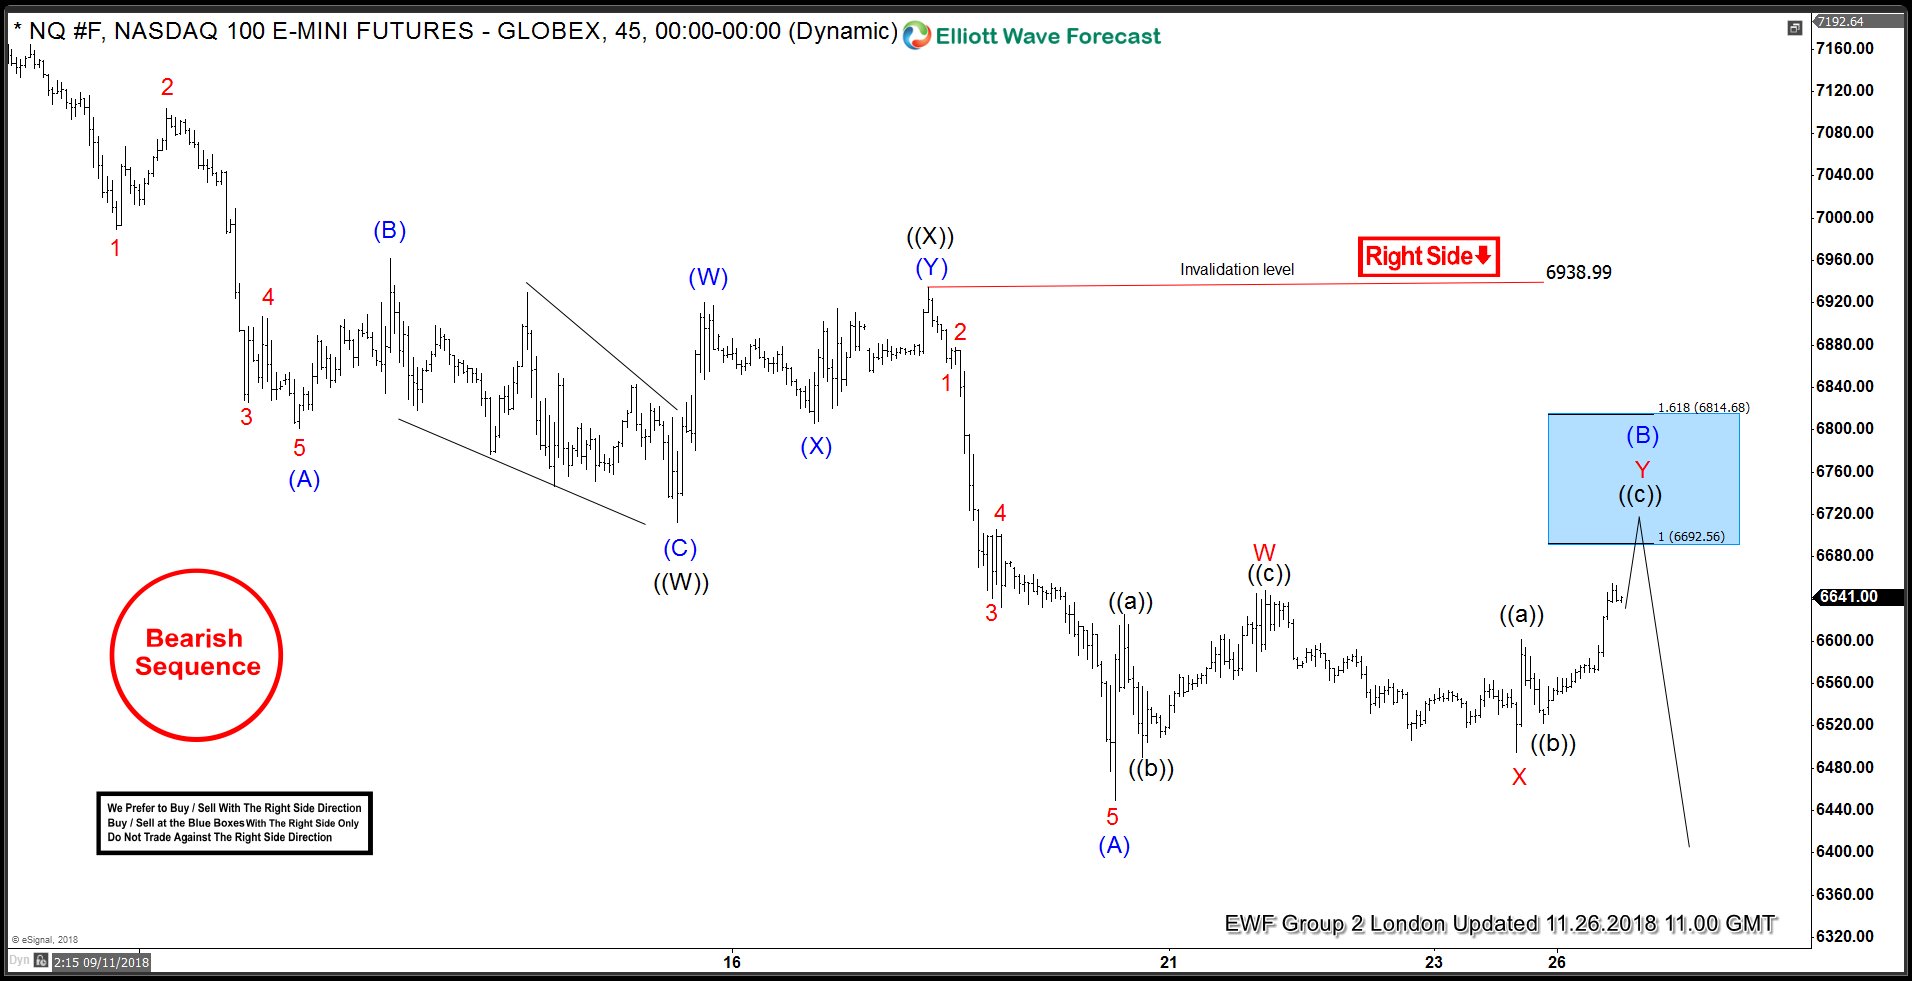
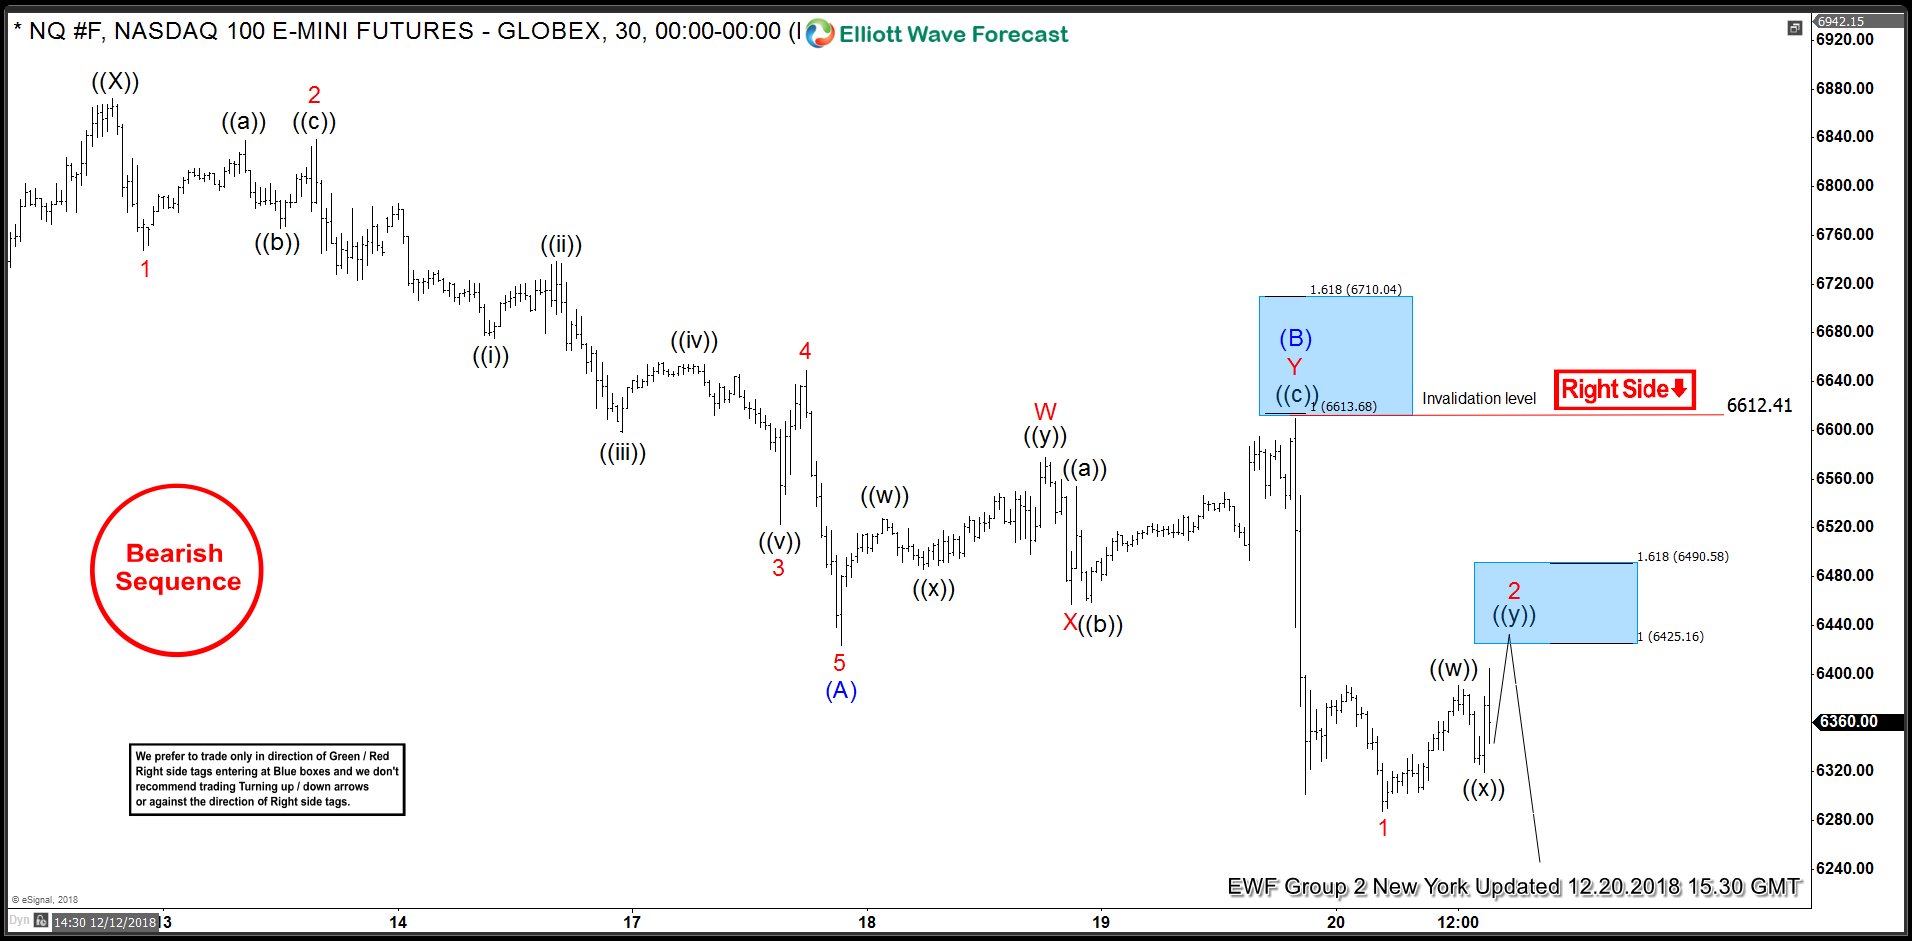
Nasdaq shows an incomplete bearish sequence from 10/1 peak (7728.7) as indicated by the bearish sequence stamp and red color right side stamp on the charts. Decline from 10/1 peak is unfolding as a double three Elliott Wave structure where Cycle degree wave W ended at 6580.5 and Cycle degree wave X ended at 7231. Minor wave Y remains in progress, and down from 7231, Primary wave ((W)) ended at 6712.25 and Primary wave ((X)) ended at 6938.99. Near term, while bounces stay below there, and more importantly below 7231, expect the Index to extend lower.
NASDAQ ticker symbol: $NQ_F short-term Elliott wave view suggests that a bounce to $6897 high ended Primary wave ((X)). Down from there, the decline is unfolding as a zigzag structure within primary wave ((Y)) where an initial decline to $6772.25 low ended Minor wave 1. Minor wave 2 bounce ended at $6864.75 high, Minor wave 3 ended in lesser degree 5 waves at $6523 low. Then a bounce to $6649 high ended Minor wave 4. Finally a push lower to $6423.25 low ended Minor wave 5 & also completed the intermediate wave (A) in 5 wave impulse structure.