Nasdaq futures rallied over 1600 points during the last 30 days of trading. It found a low at 14372 on October 4, 2021 and has not looked back since then. After a couple of tests of the lows, it accelerated higher and has already made a new all time high reaching 15980 on November 2, 2021. When Nasdaq futures was selling off in September, our members knew that the decline was a corrective pull back and nothing more than an another buying opportunity. Let’s take a look at some charts of Nasdaq futures from members area showing how we called a move into the blue box area and a rally from there.
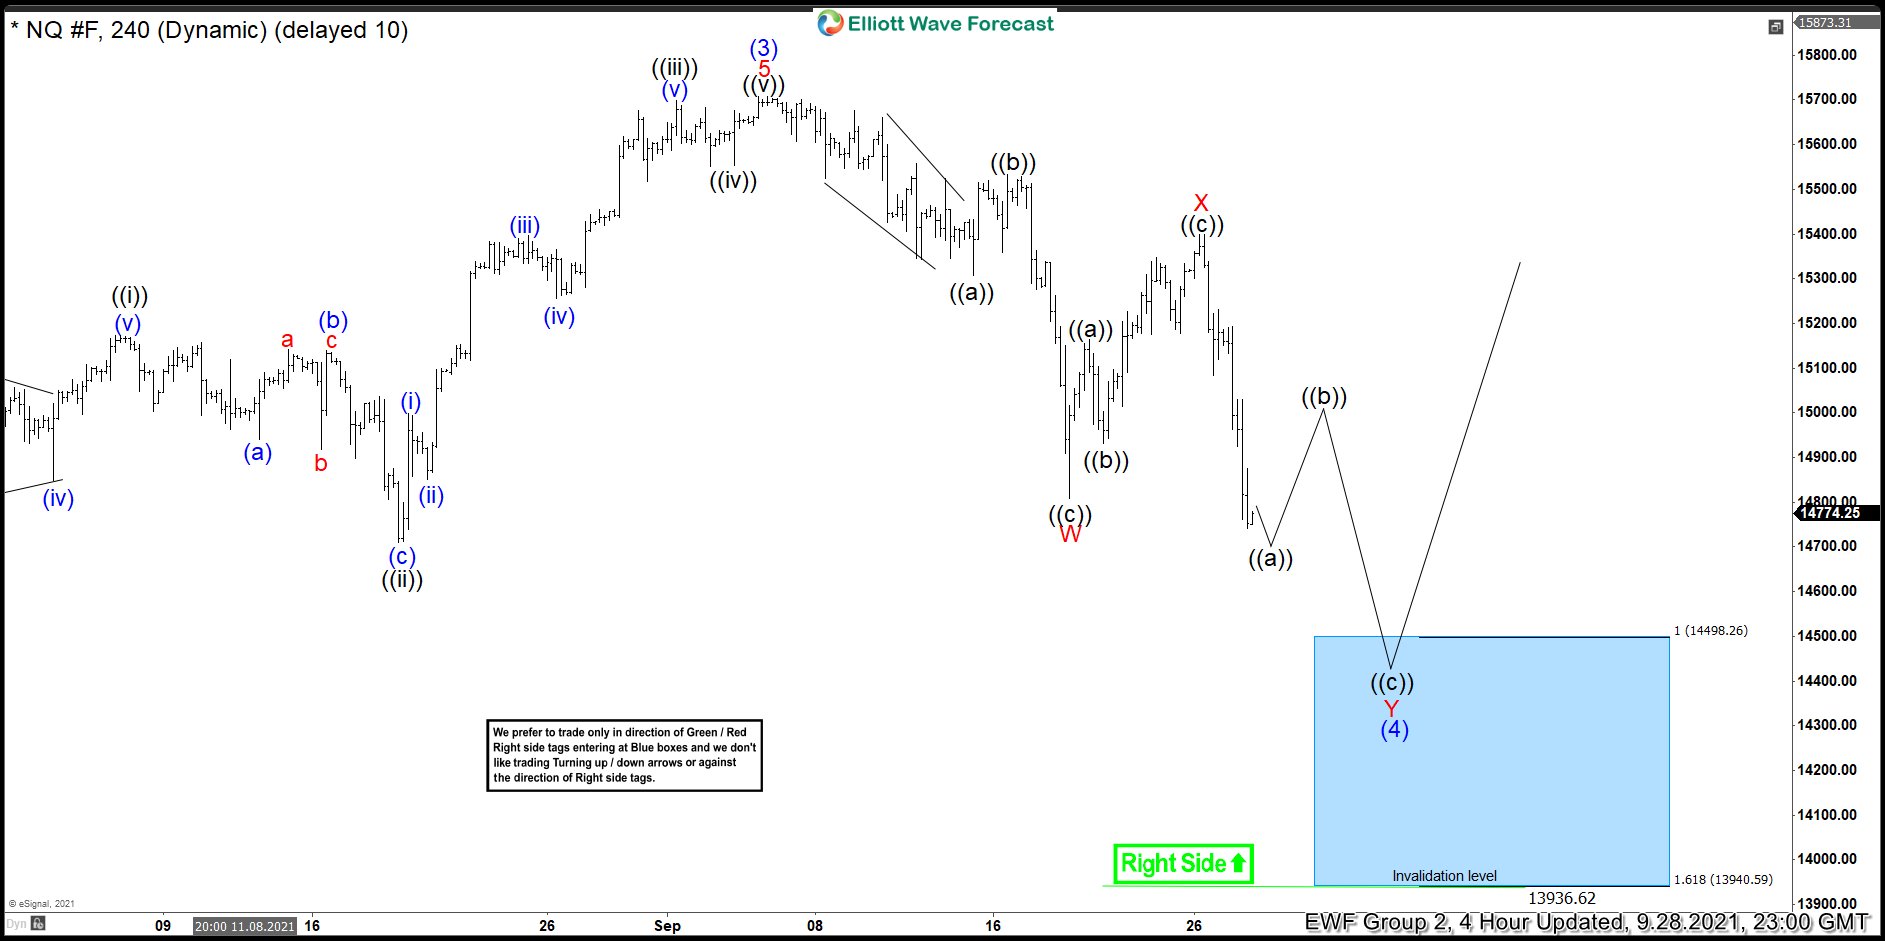
Nasdaq Futures 28 September 4 Hour Elliott Wave Analysis
Chart below shows NQ_F in a double three correction. We expected a bounce in wave ((b)) to fail for another leg lower towards 14498 - 13940 area to complete double three Elliott wave correction. Then we expected the rally to resume in wave (5) for a new all time high or for a 3 waves bounce at least.
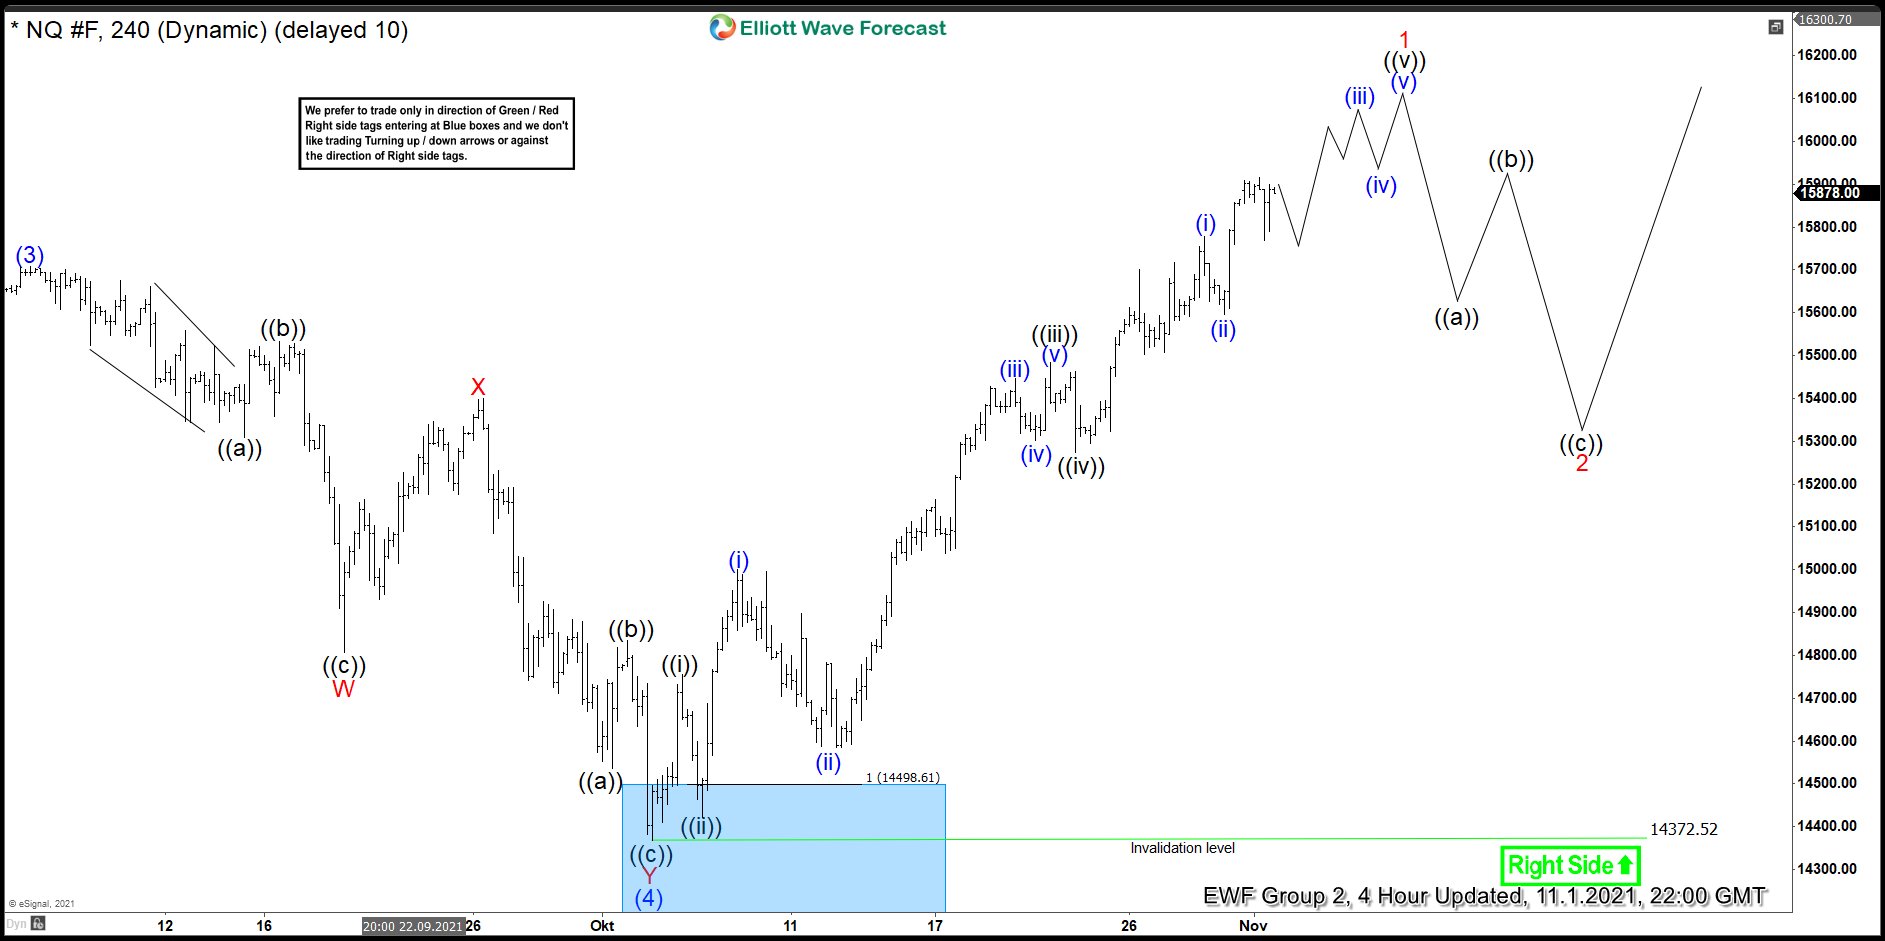
Nasdaq Futures 01 November 4 Hour Elliott Wave Analysis
Nasdaq reached a low of 14372 on 4 October, 2021 and reacted higher after buyers appeared in the blue box. There was some fight between buyers and sellers as it usually happens at start of a new cycle. After testing the low a couple of times, Nasdaq futures accelerated higher which means two test of the low became Elliott wave nests and they are now being resolved. Nasdaq futures already managed to break above wave (3) high which is also a new all time high. Cycle from 14372 (4 October, 2021) low is mature and close to ending. 16026 - 16540 is inverse 1.236 - 1.618 Fibonacci extension of wave (4) pull back and we expect a cycle to end in this area after which Nasdaq should pull back in 3 waves at least.
Source: Nasdaq Futures: Forecasting The Rally from the Blue Box Area

