We will look at the past performance of the 1-hour Elliott Wave Charts of NASDAQ futures ticker symbol: $NQ_F. In which, the rally from 27 September 2023 low unfolded as a nest and showed a higher high sequence supported more upside. Therefore, we knew that the structure in NASDAQ is incomplete to the upside & should see more strength. We will explain the structure & forecast below:
NASDAQ Futures 1-Hour Elliott Wave Chart From 10.13.2023
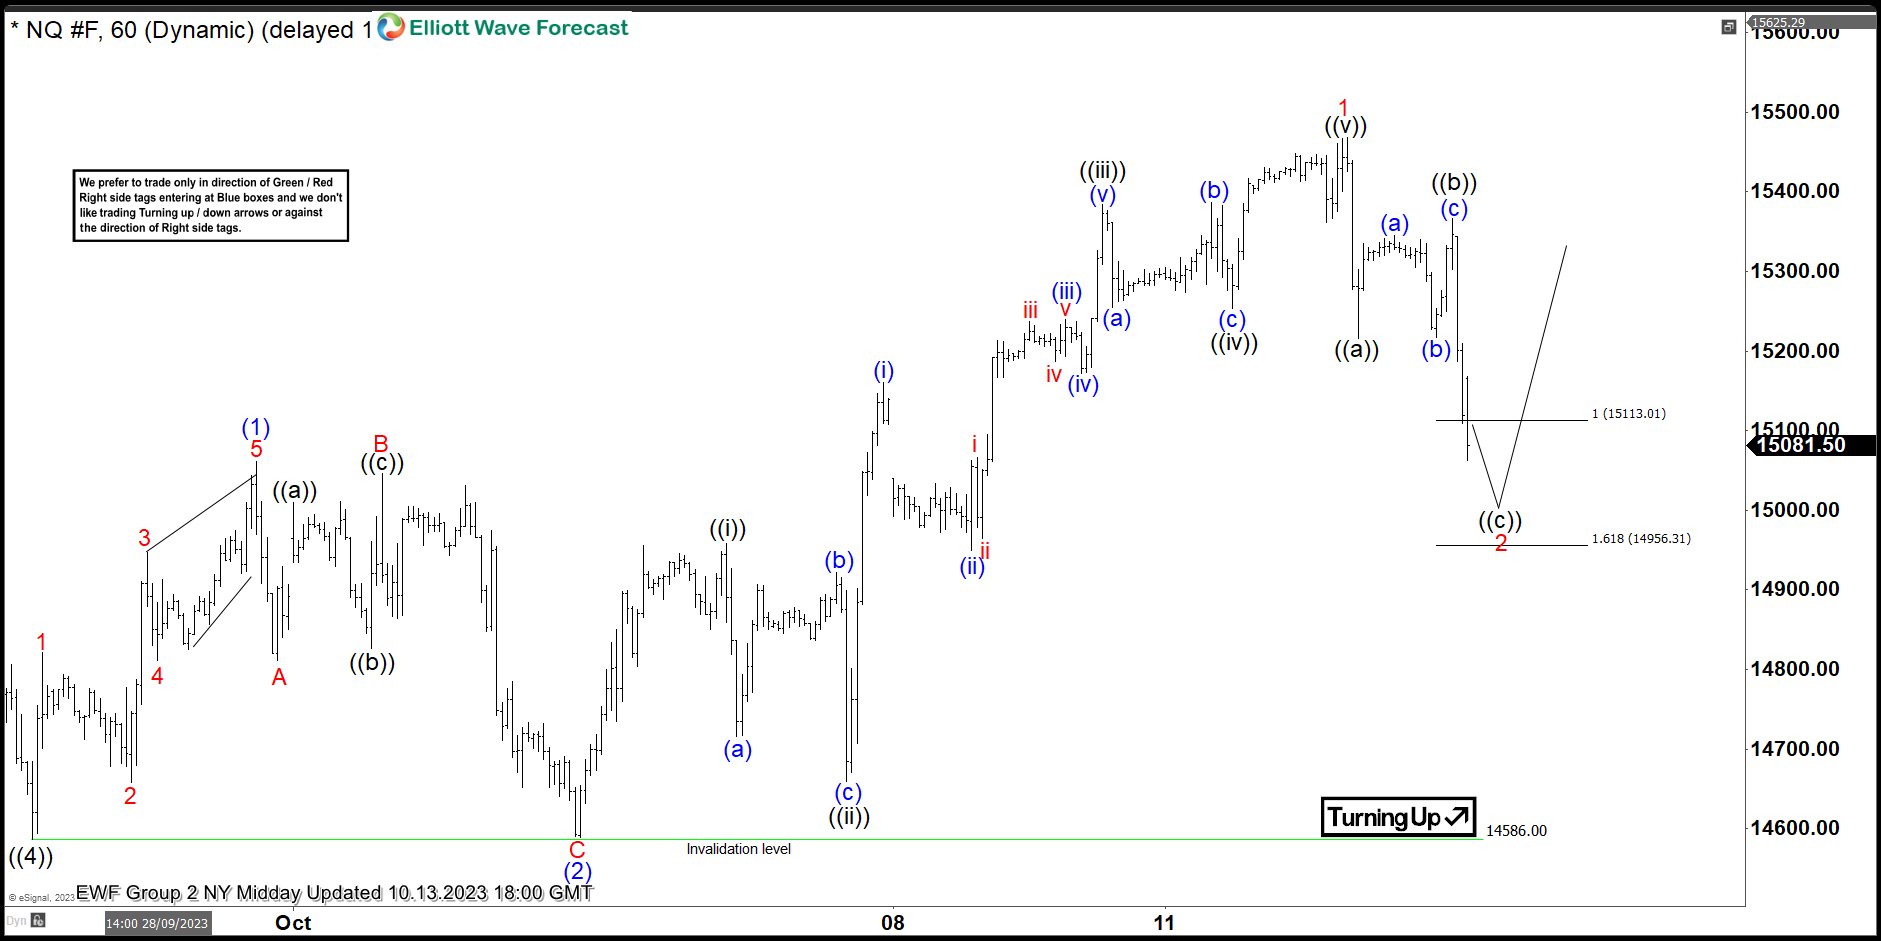
Above is the 1hr Elliott wave chart from the 10/13/2023 Midday update. In which, the rally from the 9/27/2023 low is unfolding as a nest favoring more upside. While the short-term cycle from 10/03/2023 low ended wave 1 at $15468.75 high in a lesser degree 5 waves impulse sequence. Down from there, the index made a pullback in wave 2 to correct that cycle. The internals of that pullback unfolded as a zigzag structure where wave ((a)) ended at $15216.25 low. Wave ((b)) bounce ended at $15366.75 high and wave ((c)) managed to reach the equal legs area of ((a))-((b)) at $15113.01- $14956.31. From there, buyers were expected to appear looking for the next leg higher ideally or for a minimum 3 wave bounce.
NASDAQ Futures Latest 1-Hour Elliott Wave Chart From 10.17.2023
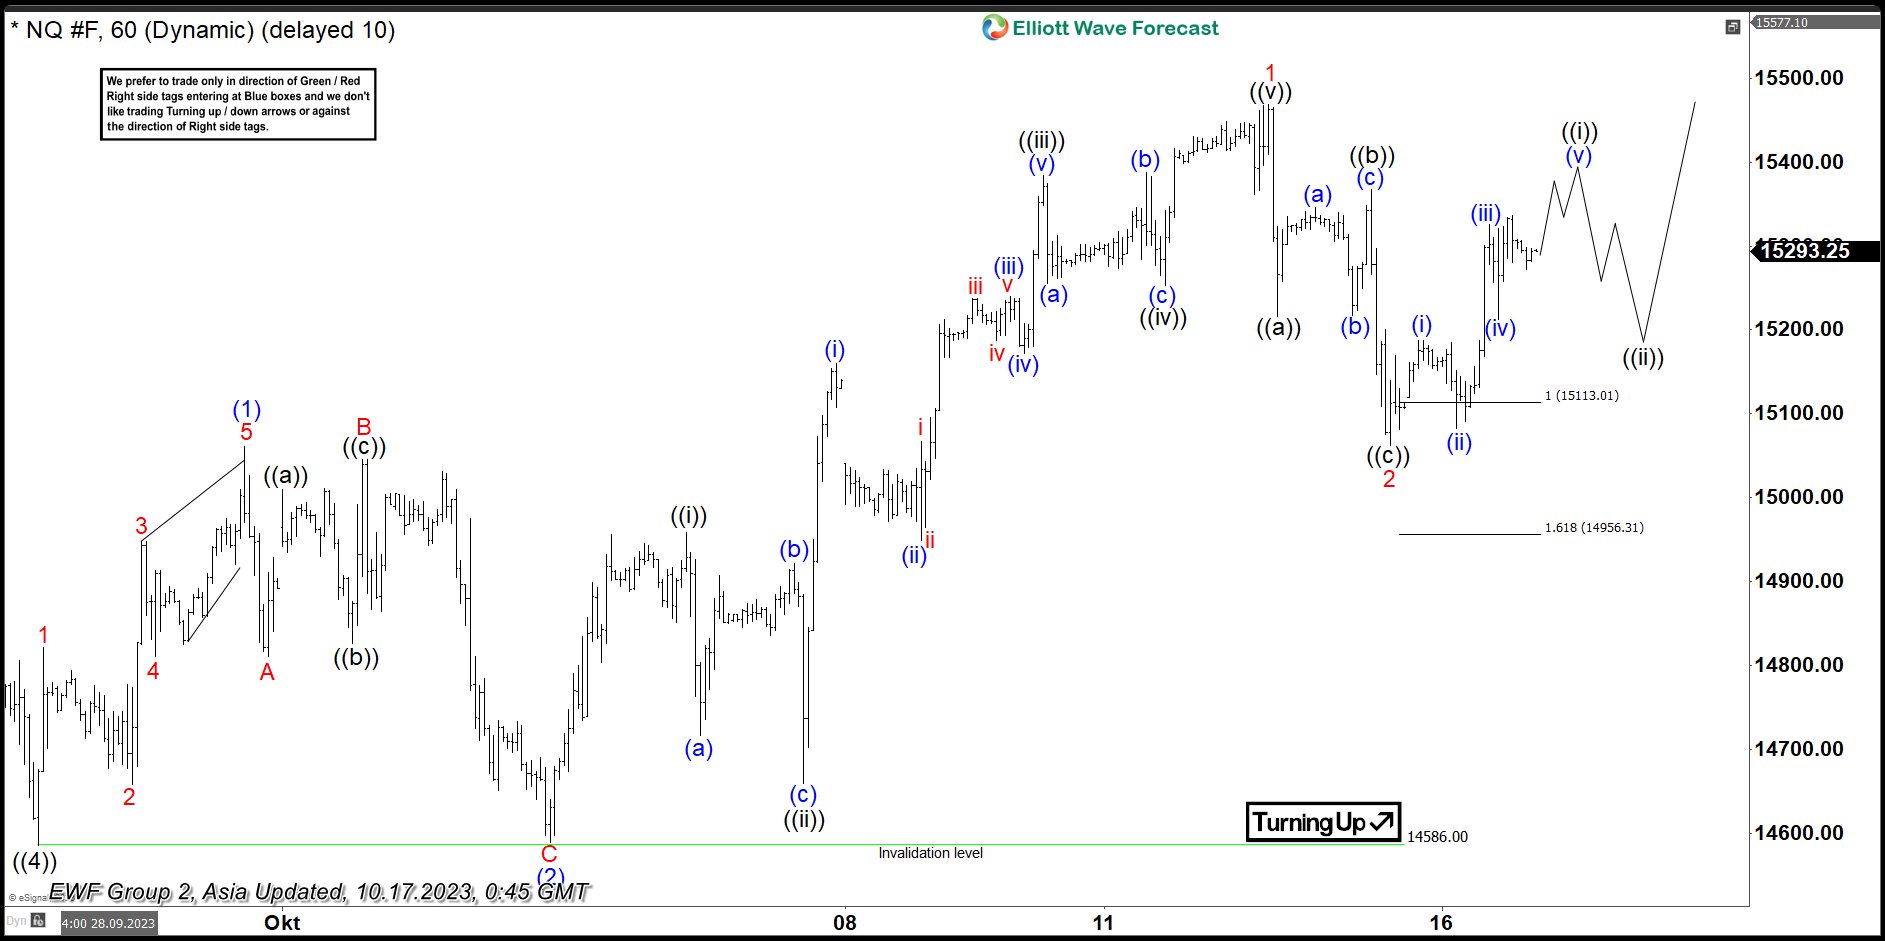
This is the Latest 1hr view from the 10/17/2023 Asia update. In which the index is showing a strong reaction higher taking place from the equal legs area. However, a break above $15468.75 high is still needed to confirm the next extension higher & avoid a double correction lower.