NASDAQ is another instrument that has given us good trading opportunity lately . The index is showing impulsive and clear bullish trend that is calling for continuation of the rally. Recently it made clear 7 swings pull back and found buyers at the blue box as we were expecting . Pull back unfolded as Elliott Wave Double Three Pattern. In this technical blog we’re going to take a quick look at the charts of $NQ_F published in members area of the website and explain the Elliott Wave structure and trading strategy.
Before we take a look at the real market example, let’s explain Elliott Wave Double Three pattern.
Elliott Wave Double Three Pattern
Double three is the common pattern in the market , also known as 7 swing structure. It’s a reliable pattern which is giving us good trading entries with clearly defined invalidation levels.
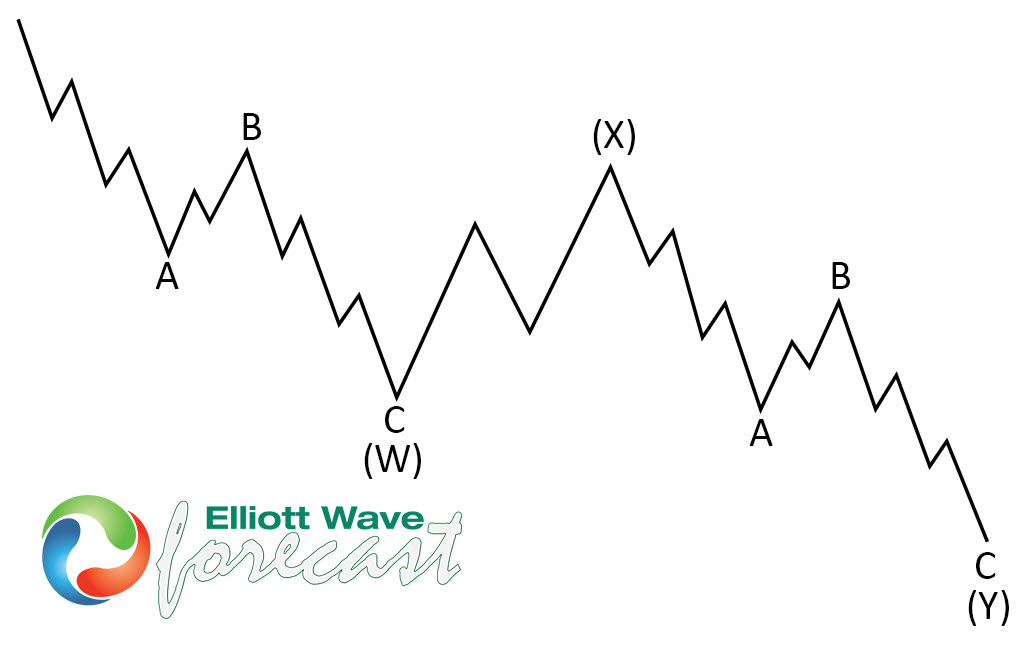
The picture below presents what Elliott Wave Double Three pattern looks like. It has (W),(X),(Y) labeling and 3,3,3 inner structure, which means all of these 3 legs are corrective sequences. Each (W) and (Y) are made of 3 swings , they’re having A,B,C structure in lower degree, or alternatively they can have W,X,Y labeling
Now let’s take a look what Elliott Wave Double Three looks like in a real market.
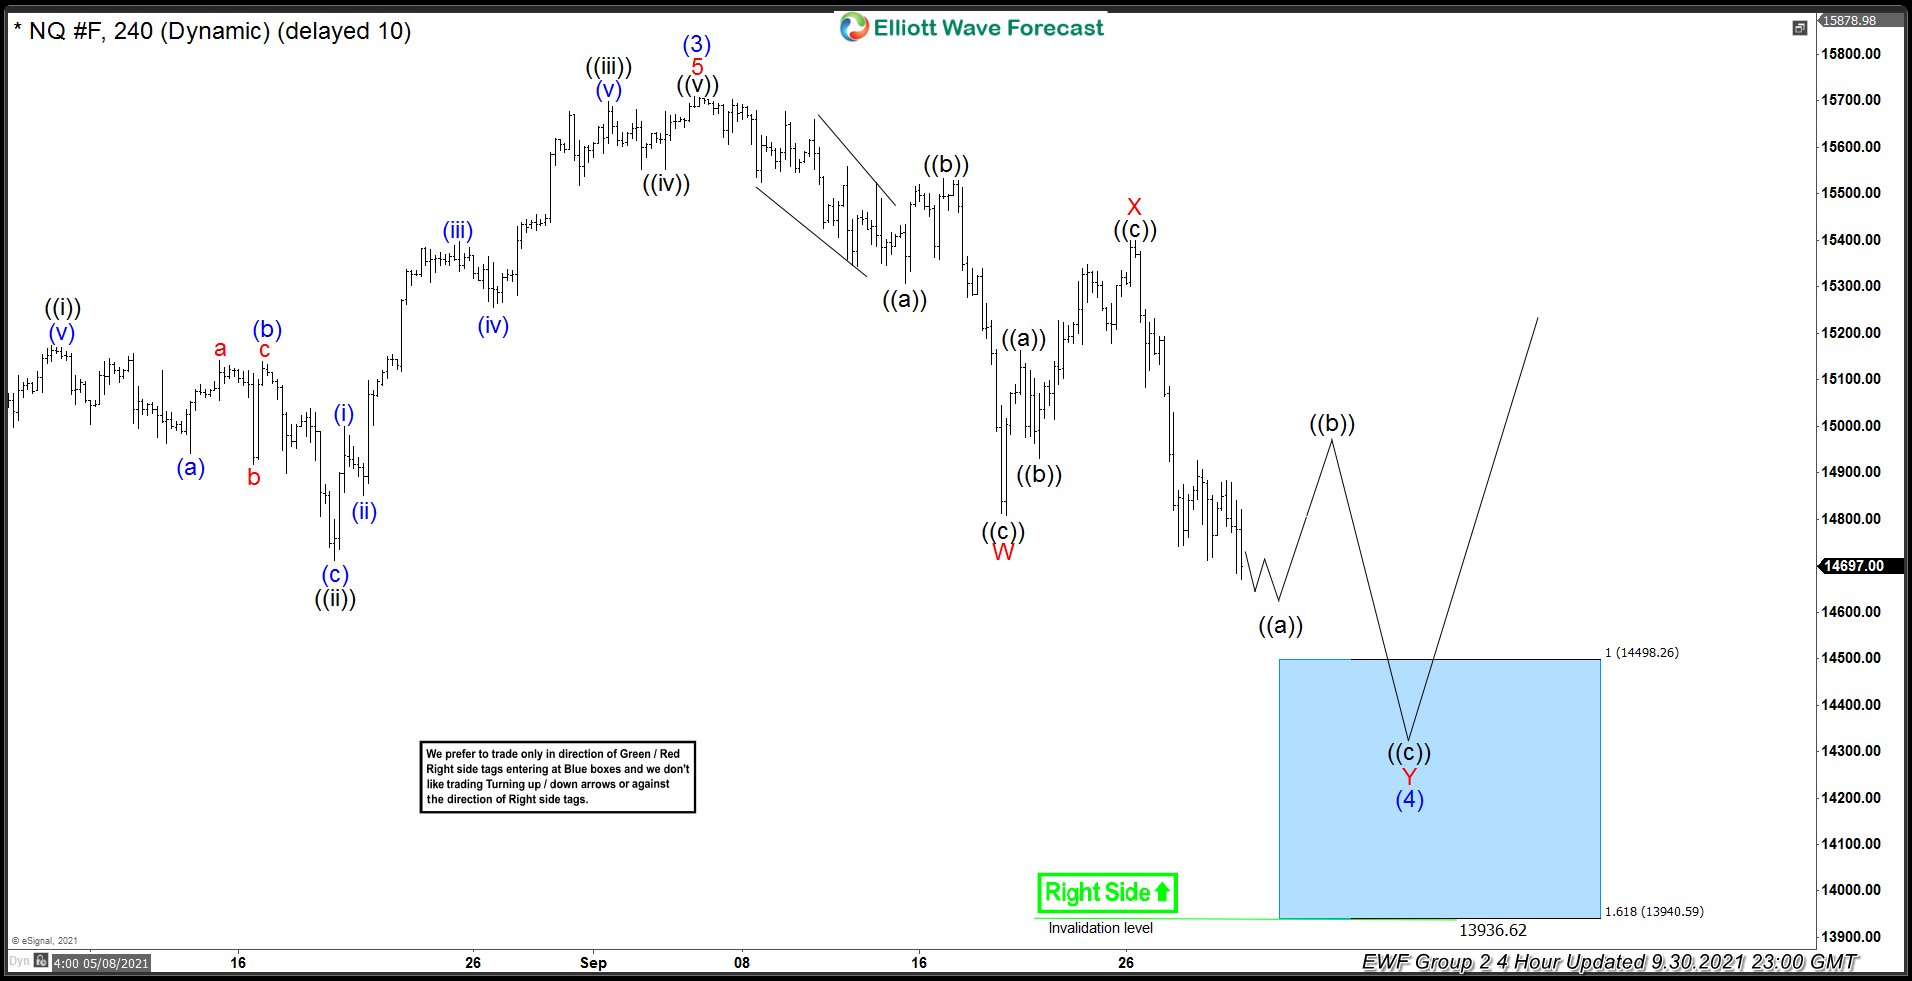
NASDAQ Elliott Wave 4 Hour Chart 9.30.2021
Current view suggests Nasdaq is doing (4) blue correction that is unfolding as Elliott Wave Double Three Pattern with WXY red inner labeling. First leg W is showing corrective sequences - 3 waves down ((a))((b))(©). Then we got 3 waves bounce in X red finally doing Y red that also should have corrective sequences. Pull back looks incomplete at the moment. We believe ((a)) of Y should be ending as 5 waves. Wave ((b)) bounce should happen soon, which will be 6th swing of (4) correction. Then as far as X red pivot stays intact, we would be expecting another leg down ( 7th swing) toward extreme zone : 14498.2-13940.5 area.
As the main trend is bullish we expect buyers to appear at the blue box for 3 waves bounce at least. Once bounce reaches 50 Fibs against the X red high, we will make long position risk free ( put SL at BE). Invalidation for the trade would be break below 1.618 fibs extension: 13940.5. As our members know, Blue Boxes are no enemy areas , giving us 85% chance to get a bounce.
You can learn more about Elliott Wave Double Three Patterns at our Free Elliott Wave Educational Web Page .
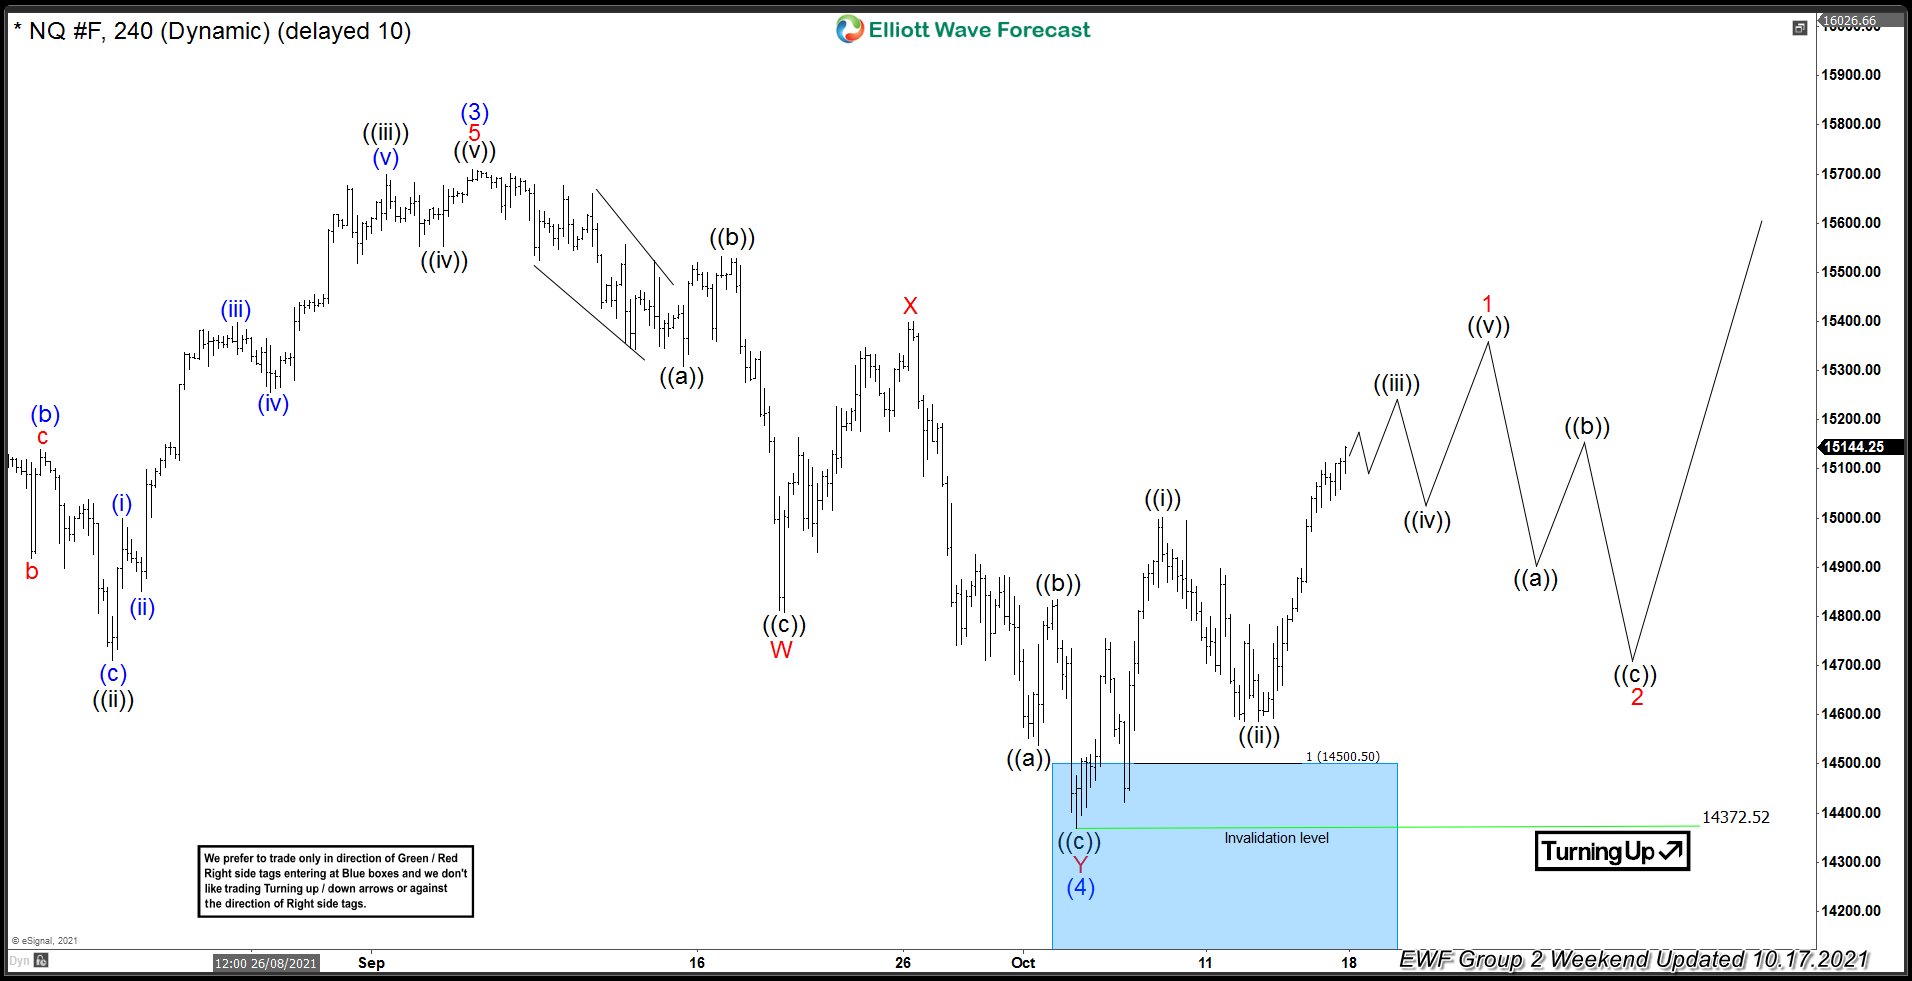
NASDAQ Elliott Wave 4 Hour Chart 10.17.2021
Eventually we got ((b)) bounce and another leg down as expected. Buyers appeared at the blue box and we are getting good reaction from there. The rally from the blue box reached and exceeded 50 fibs against the X red connector. As a result members who took long positions are enjoying profits in a risk free positions. As far as the price stays above current low : 14372.5, we can consider (4) pull back done as Elliott Wave Double Three Pattern.
Keep in mind that market is dynamic and presented view could have changed in the mean time. You can check most recent charts in the membership area of the site. Best instruments to trade are those having incomplete bullish or bearish swings sequences. We put them in Sequence Report and best among them are shown in the Live Trading Room .
Elliott Wave Forecast
Source: NASDAQ ( $NQ_F ) Buying The Dips After Elliott Wave Double Three