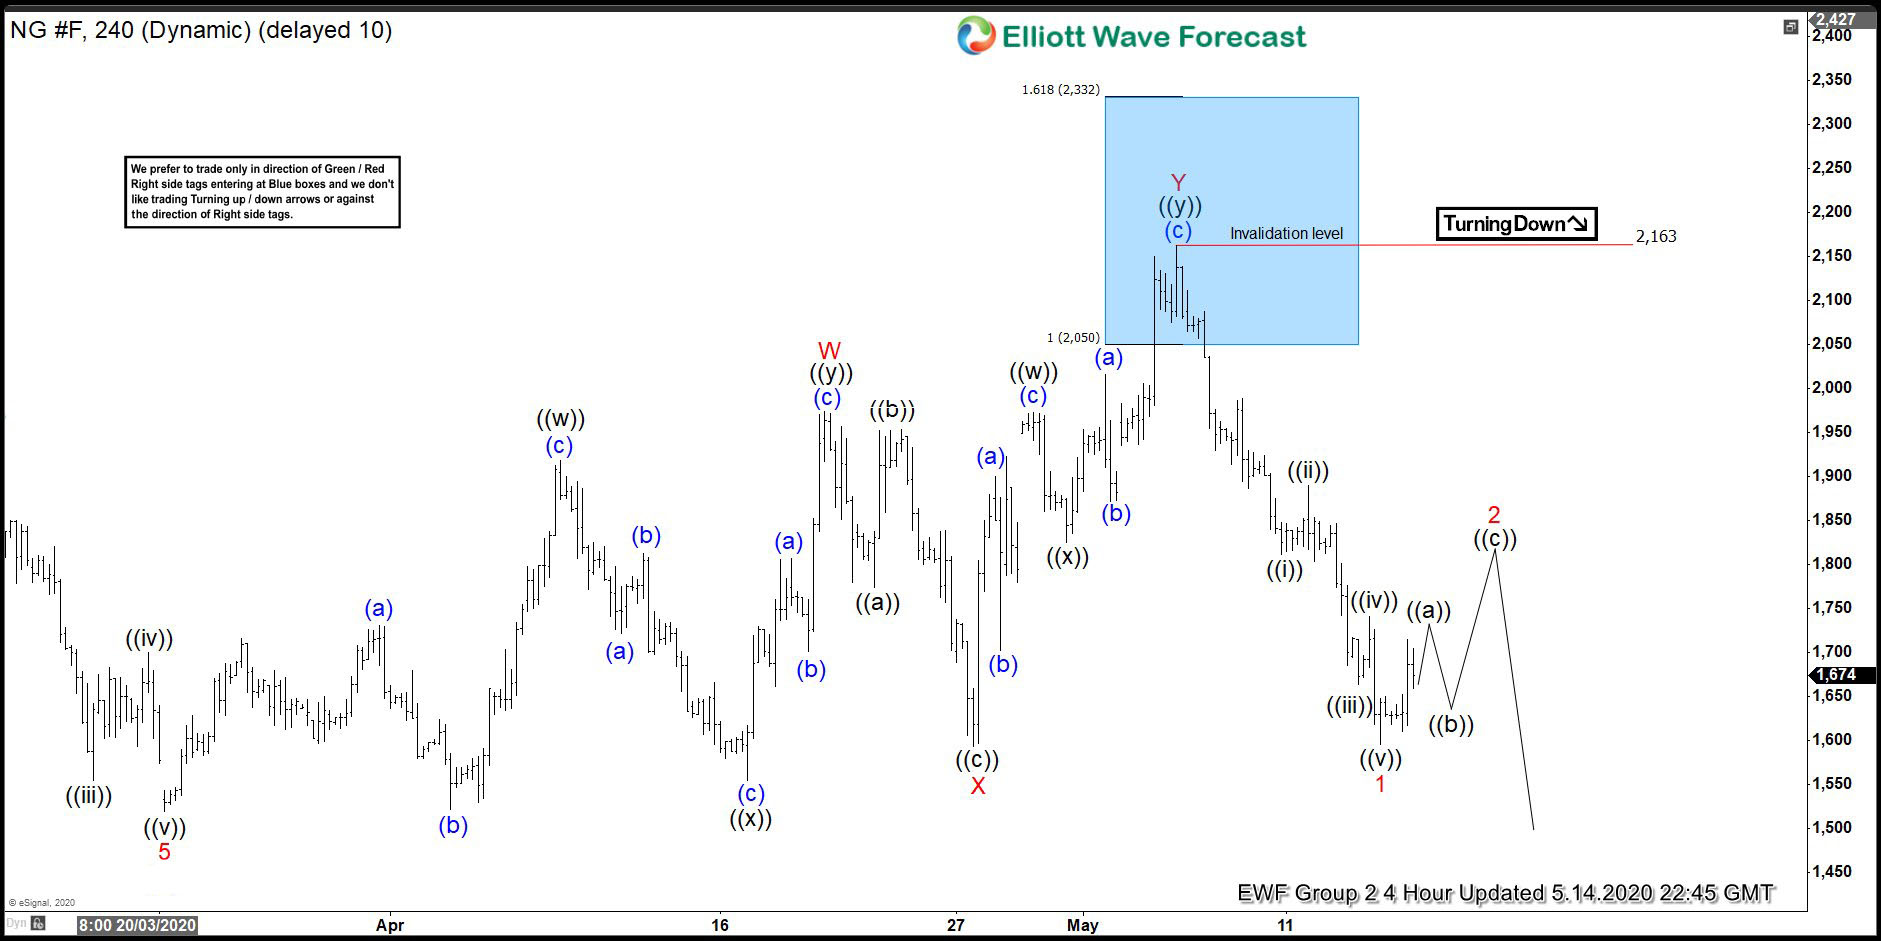
In this blog, we are going to take a look at the Elliott Wave chart of Natural Gas (NG_F). In the previous article from May 13, 2020, we showed how Natural Gas reached the blue box area and turned lower from there. The 4 hour chart update below from May 14 shows that the commodity has ended the decline from the blue box at 1.595 low as 5 waves impulse Elliott Wave Structure. From there, 3 waves bounce is expected to take place before the decline lower can continue. While below 2.163 high, the bounce in 3,7, or 11 swings is expected to fail for more downside later.
Natural Gas (NG_F) 14 May 4 Hour Elliott Wave Update
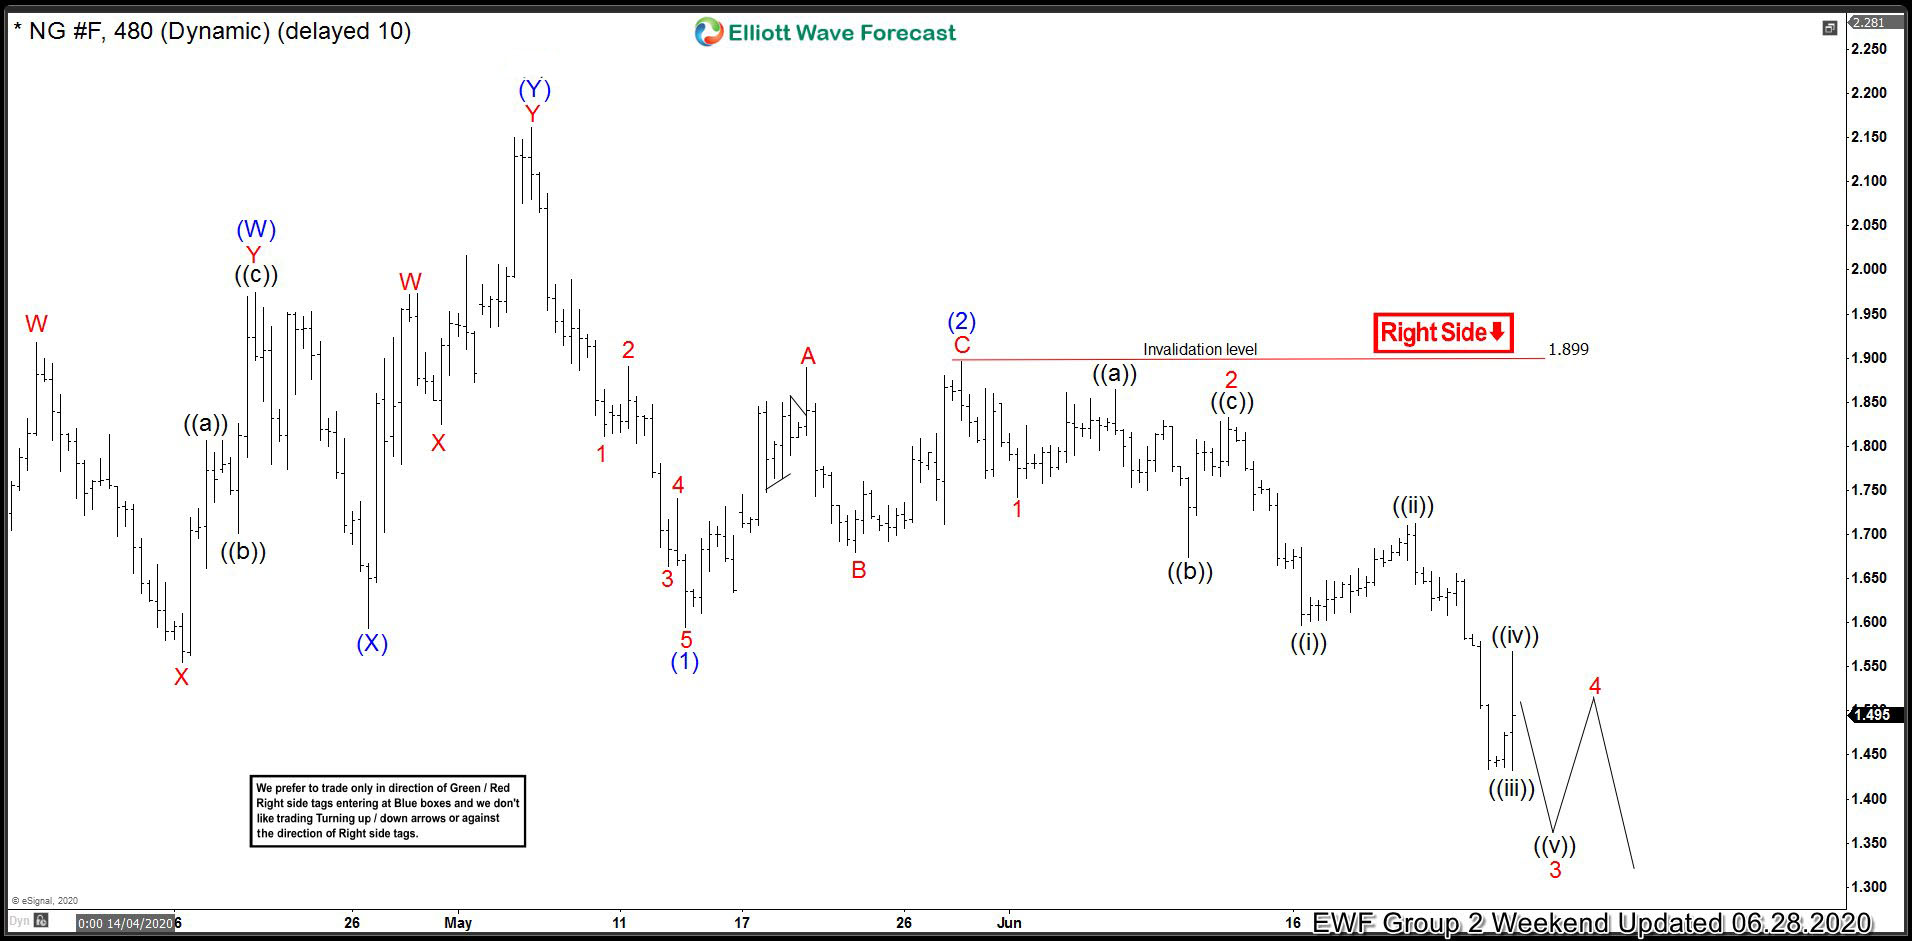
The 4 hour chart update from June 28 shows that 3 waves bounce in wave (2) has already ended at 1.899 high. The bounce unfolded as a zig-zag Elliott Wave Structure. Down from 1.899 high, Natural Gas ended wave 1 at 1.742 low. Wave 2 bounce unfolded as a flat and ended at 1.833 high. Afterwards, the commodity resumed lower in wave 3, which is still in progress. The decline has already broken below previous wave (1) low. The commodity is now showing a lower low sequence. While below 1.899 high, expect the bounce in 3,7, or 11 swings to fail for more downside in the near term.

