Natural Gas Resumed Higher After It found Buyers In The Blue Box
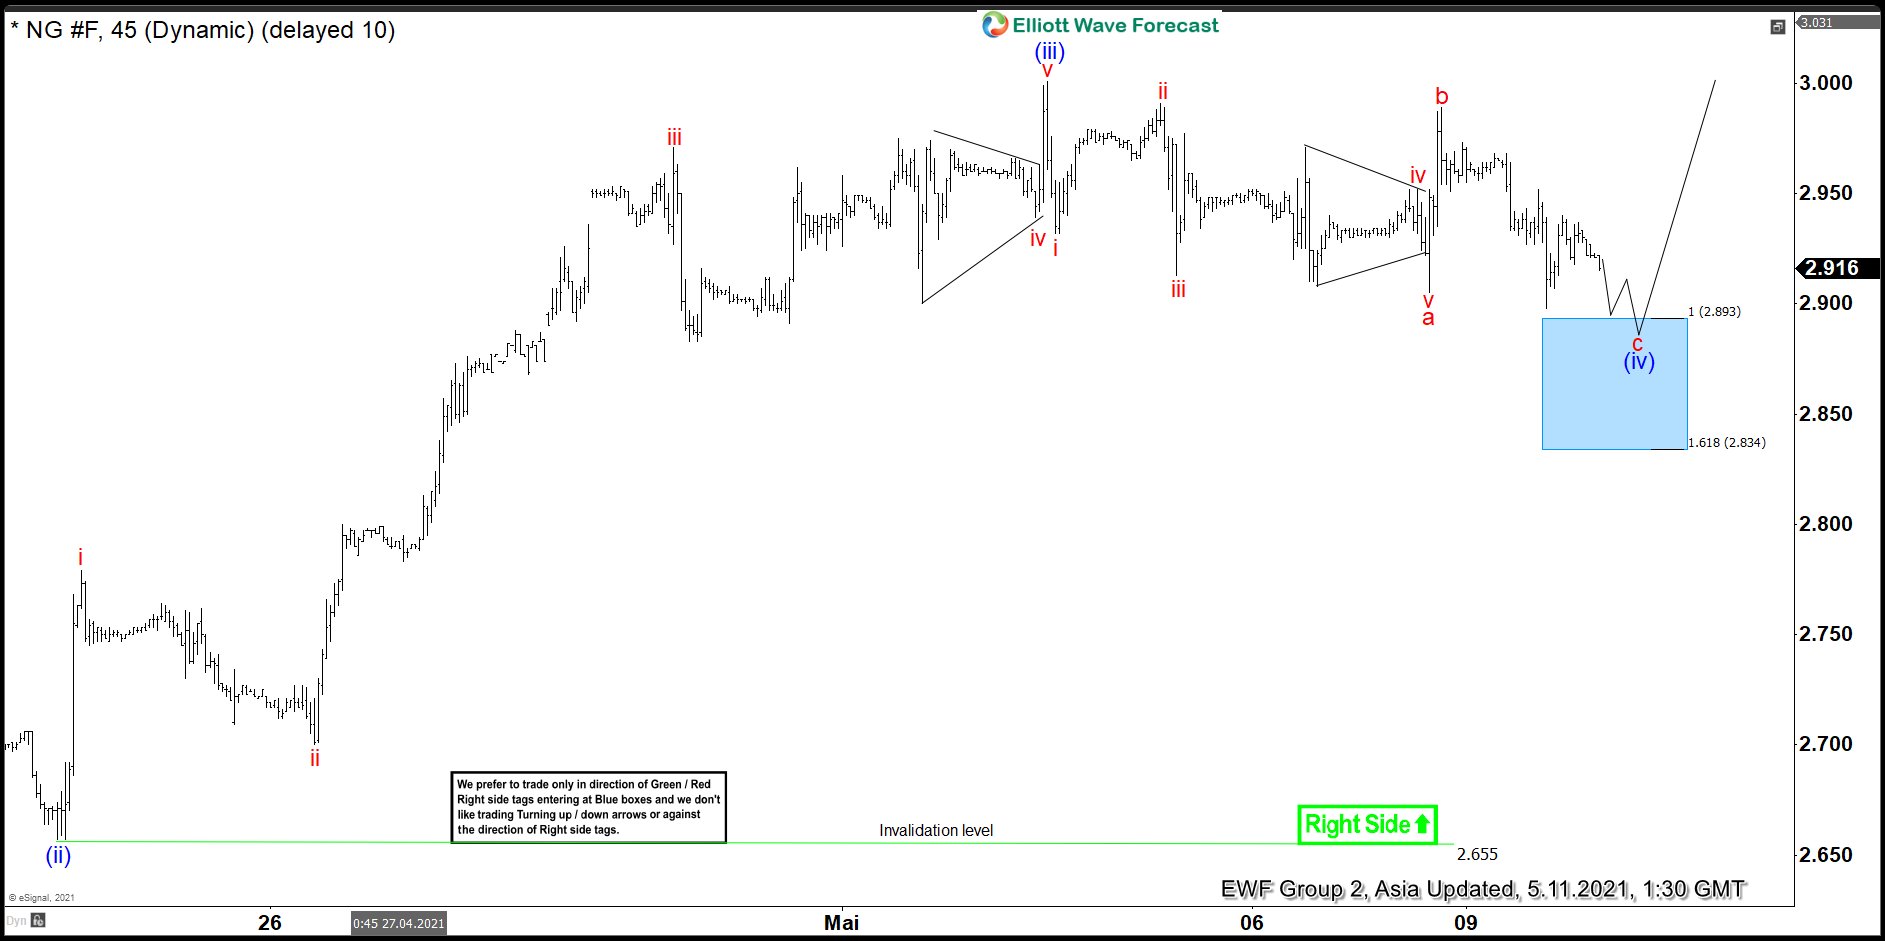
In this blog, we take a look at the short term view on Natural Gas reaching the blue box and reacting higher after finding buyers. On the 1 hour chart from 5/11/2021, the commodity rallied in 5 impulse waves in the subminuette (red) degree. This completed blue wave (iii) at around $2900 -$3000 area. According to the Elliott Wave theory, a correction should follow an impulse. One therefore, expected to see a pullback lower in blue wave (iv).
We saw a decline from blue wave (iv) peak in a form of a zig zag, towards the blue box. Internally, we saw a decline in five waves in red wave a, as it is in the nature of zig zag corrective structures. Naturally, we anticipated red wave b to correct red wave a. Finally, we expected to see 5 waves in red wave c to complete the pullback in blue wave (iv). As per our strategy and forecast, we expected to see a reaction higher from the blue box area once reached. The right side is up aganist $2.655 lows.
Elliott Wave 1 hour chart dated 5/11/2021
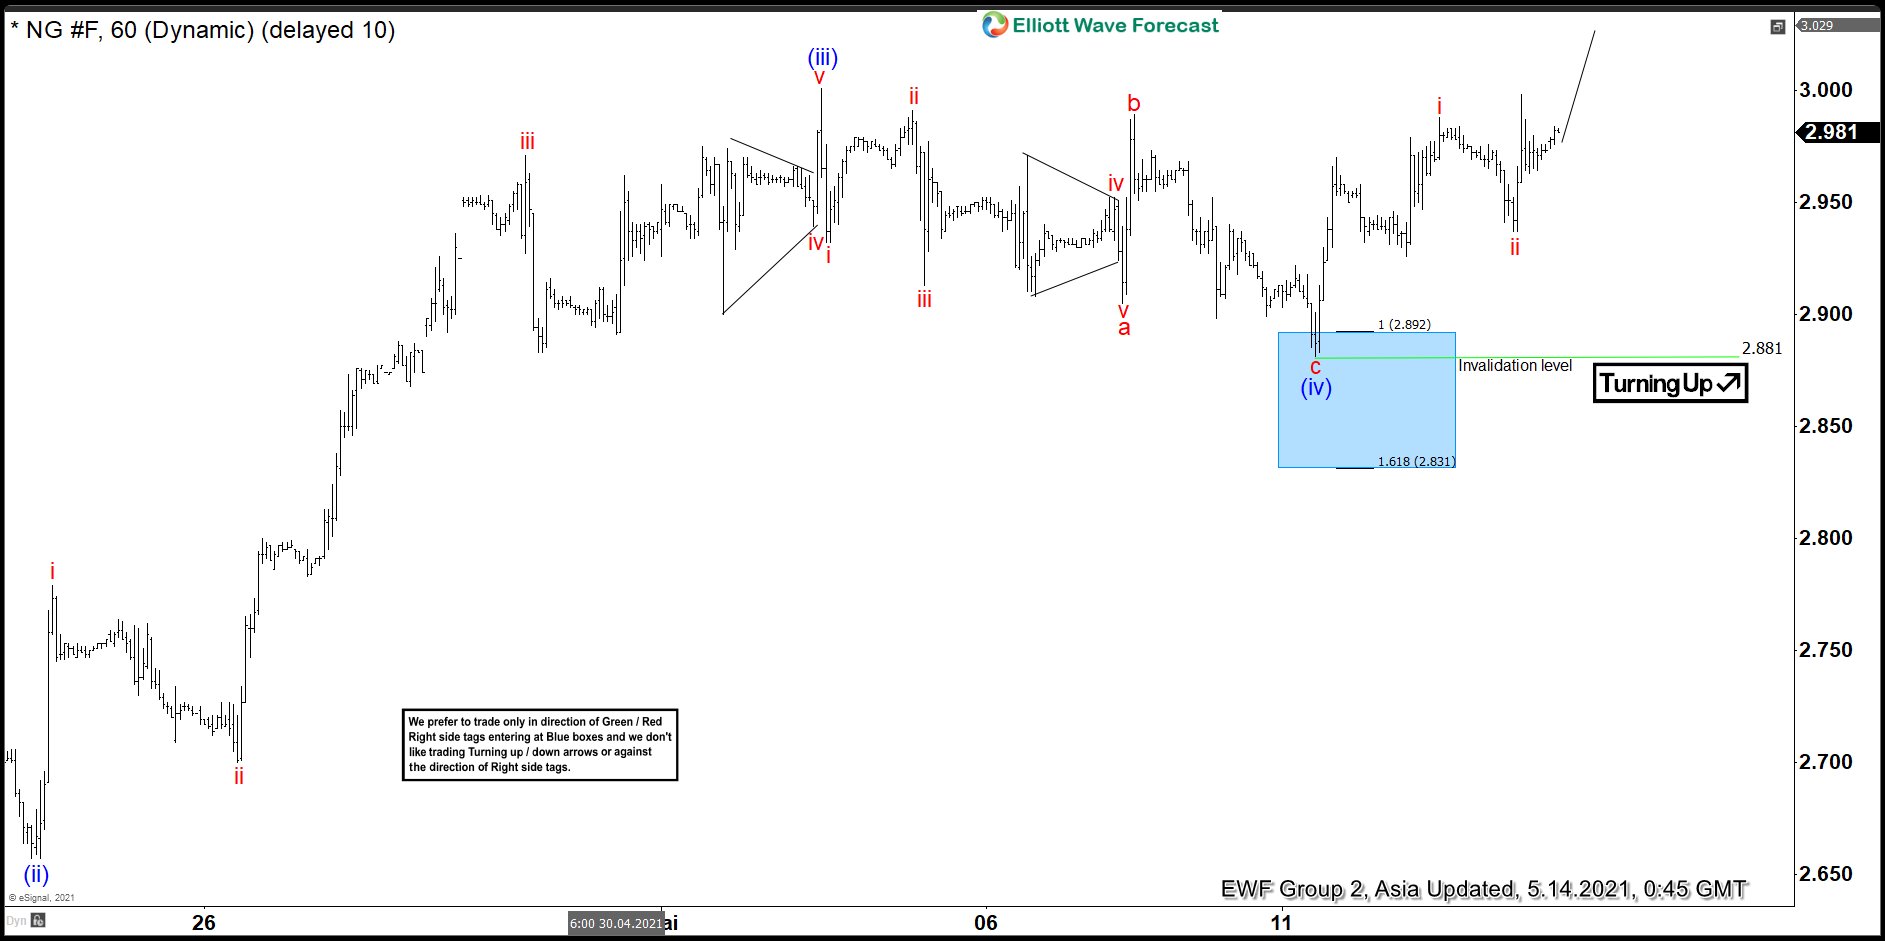
The 1 hour chart below is from 5/14/2021. In it, we see that the commodity briefly penetrated the blue box area. We subsequently saw a reaction higher from the blue box as per our forecast from 5/11/2021. Therefore, we proposed blue wave (iv) completed at $2.881. Indeed, we saw the commodity react higher suggesting that it is headed higher in blue (v), as expected. As at 5/14/2021, long positions from the blue box area were already running risk free. However, we need to see a clear break above blue wave (iii). Only then can we confirm the next leg higher in blue wave (v).
We proposed red waves i and ii of blue wave (v) completed. One can expect the commodity to continue higher in red waves iii-v. As a matter of fact, we do not expect the proposed move in wave (v) to go in a straight line, as the market hardly exhibit linear moves. We expect the commodity to pullback in the larger degree once we call blue wave (v) completed.
Elliott Wave 1 hour chart dated 5/14/2021