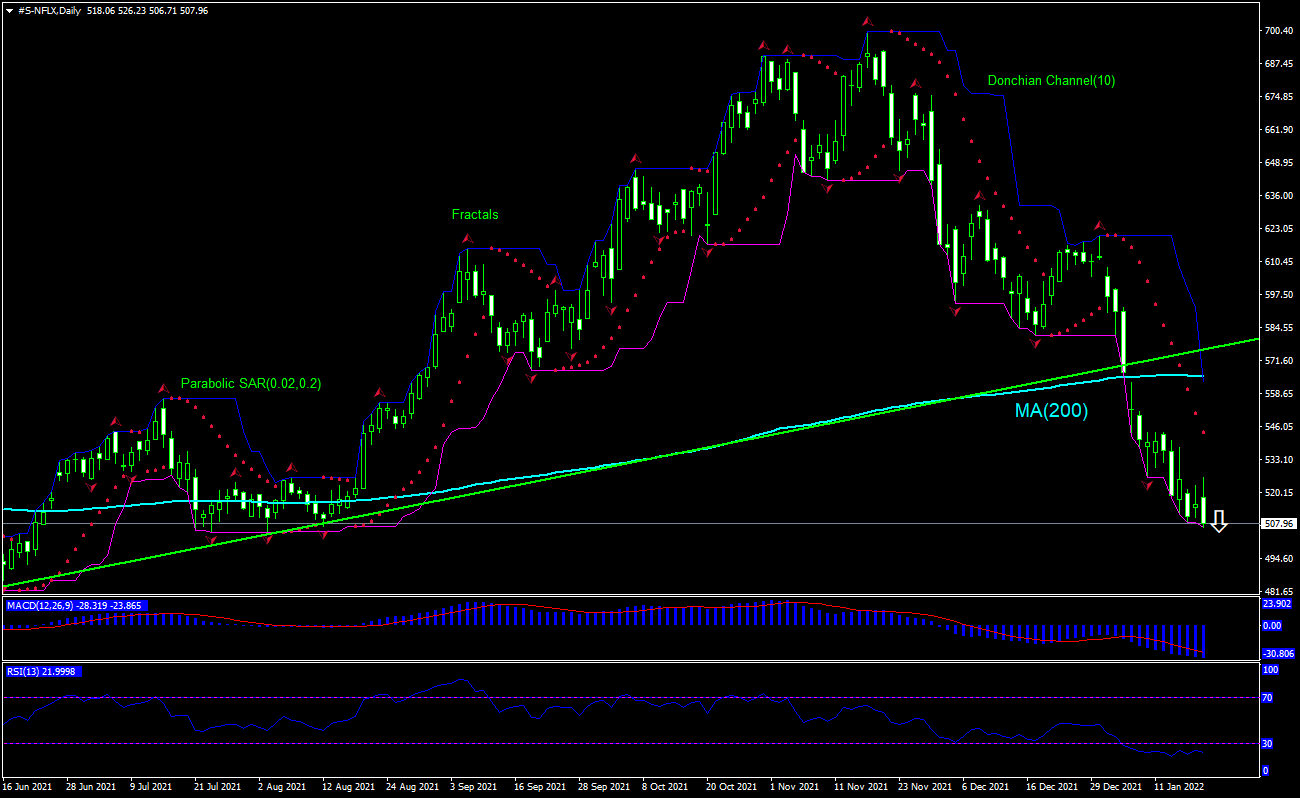
Netflix Inc. Technical Analysis Summary
Sell Stop: Below 506.71
Stop Loss: Above 565.41
| RSI | Buy |
|---|---|
| MACD | Sell |
| Donchian Channel | Sell |
| MA(200) | Sell |
| Fractals | Sell |
| arabolic SAR | Sell |
Netflix Inc. Chart Analysis
Netflix Inc. Technical Analysis
The technical analysis of the Netflix stock price chart on daily timeframe shows #S-NFLX, Daily has breached below the 200-day moving average MA(200) which has leveled off. We believe the bearish momentum will continue after the price breaches below the lower boundary of Donchian channel at 506.71. This level can be used as an entry point for placing a pending order to sell. The stop loss can be placed above the upper boundary of Donchian channel at 565.40. After placing the order, the stop loss is to be moved every day to the next fractal high, following Parabolic indicator signals. Thus, we are changing the expected profit/loss ratio to the breakeven point. If the price meets the stop loss level (565.40) without reaching the order (506.71), we recommend cancelling the order: the market has undergone internal changes which were not taken into account.
Fundamental Analysis of Stocks - Netflix Inc.
Netflix stock edged down after better than expected Q4 results. Will the Netflix stock price rebound?
Netflix is an American subscription streaming service and production company which has approximately 204 million paid members in 190 countries with market capitalization at $270.94 billion. Main Netflix competitor include AT&T -owned WarnerMedia’s HBO Max launched in May 2020, Comcast-owned NBCUniversal which started two months later, Discovery‘s Discovery+ service which debuted in January 2021, ViacomCBS‘s Paramount+ launched in March last year. Other streaming services competitors include Amazon Prime Video, Apple’s Apple TV+, Walt Disney’s Disney+, Hulu and more. The Netflix stock is trading at P/E ratio (Trailing Twelve Months) of 55.15 currently, the company earned $28.63 billion revenue (ttm) and Return on Equity (ttm) of 39.39%. Netflix and other home entertainment services gained from Covid-19 stay-at-home restrictions. Third-quarter earnings included better-than-expected new subscriber growth—the company added 4.4 million net new subscribers, above its own forecast of 3.5 million. For the December quarter, the company was projecting 8.5 million net new subscriber additions, with revenue increasing 16% to $7.7 billion. And last week Netflix raised subscription prices in the US and Canada: a standard subscription, which includes HD-quality video and the ability to stream on two devices at the same time, is now $15.49 a month in US, up from $13.99. Basic service is now $9.99 a month, up from $8.99. Expectations of rising subscription and higher prices are bullish for Netflix stock price. Yesterday Netflix reported fourth quarter results that beat analysts’ forecasts. However company reported 8.28 million net new subscribers, below its forecast of 8.5 million, and forecast new subscriber of 2.5 million for the first quarter of 2022, down from 4.0 million in the year ago quarter. And the chart analysis shows the current setup is bearish.
