Netflix Inc. Technical Analysis Summary
Sell Stop։ Below 212.43
Stop Loss: Above 231.65
| Indicator | Signal |
|---|---|
| RSI | Buy |
| MACD | Sell |
| Donchian Channel | Sell |
| MA(200) | Sell |
| Fractals | Sell |
| Parabolic SAR | Sell |
Netflix Inc. Chart Analysis
Netflix Inc. Technical Analysis
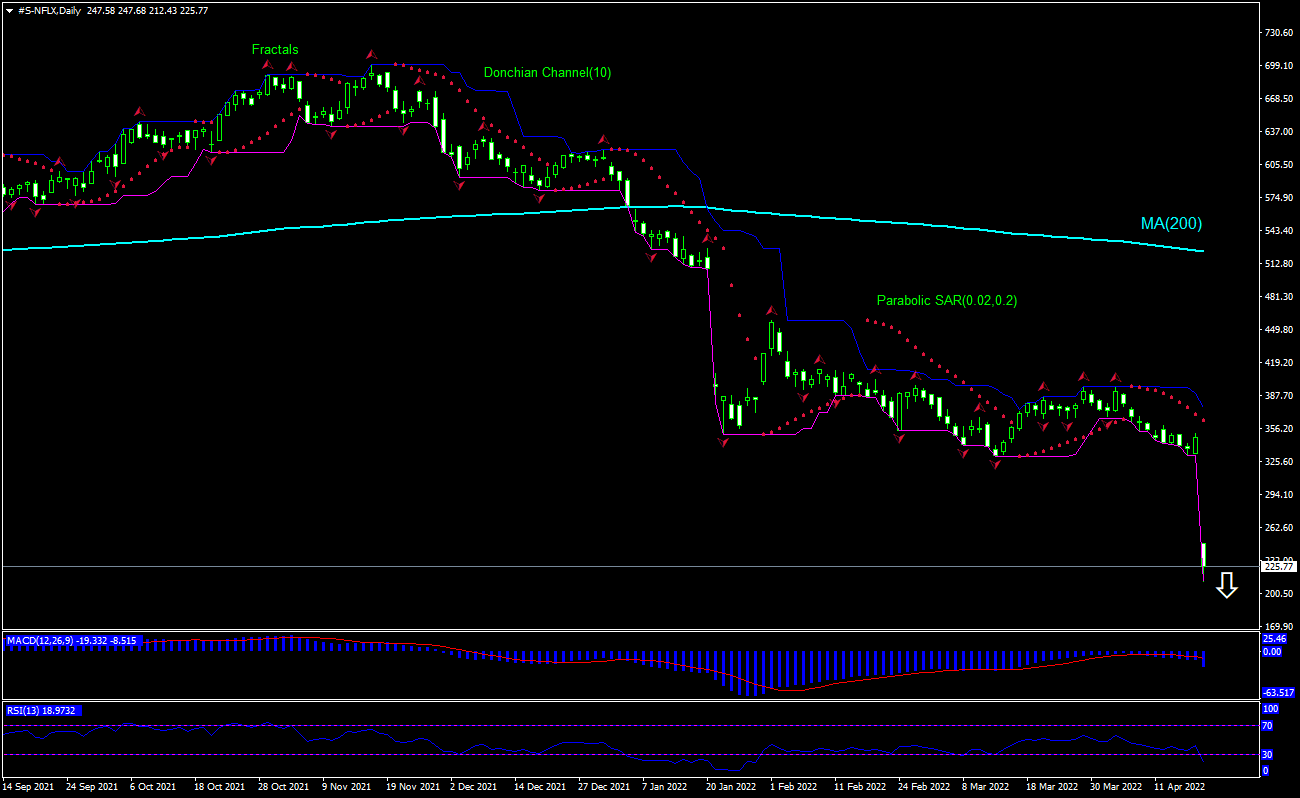
The technical analysis of the Netflix stock price chart on daily timeframe shows #S-NFLX, Daily has breached below the trading range under 200-day moving average MA(200) which is falling itself. We believe the bearish momentum will continue after the price breaches below the lower boundary of Donchian channel at 212.43. This level can be used as an entry point for placing a pending order to sell. The stop loss can be placed above 231.65. After placing the order, the stop loss is to be moved every day to the next fractal high, following Parabolic indicator signals. Thus, we are changing the expected profit/loss ratio to the breakeven point. If the price meets the stop loss level (231.65) without reaching the order (212.43), we recommend cancelling the order: the market has undergone internal changes which were not taken into account.
Fundamental Analysis of Stocks - Netflix Inc.
Netflix stock plunged 35.1% after worse than expected Q1 results. Will the Netflix stock price continue retreating?
First quarter Netflix results missed Wall Street forecasts which resulted in a selloff of streaming service’s stock yesterday. Netflix reported the loss of 200,000 subscribers in its first quarter, falling well short of its modest predictions that it would add 2.5 million subscribers. It announced revenue of $7.87 billion versus anticipated revenue of $7.9 billion. Netflix last reported a subscriber loss in 2011. Netflix’s decision in early March to suspend service in Russia after Ukraine invasion resulted in the loss of 700,000 members. At the same time the company said it expects second-quarter net paid subscribers to decline 2.0 million compared with 1.5 million net adds in the year ago quarter. Falling subscribers number is a bearish factor for streaming services company’s stock.
Netflix Inc. Chart Analysis
Netflix Inc. Technical Analysis
The technical analysis of the Netflix stock price chart on daily timeframe shows #S-NFLX, Daily has breached below the trading range under 200-day moving average MA(200) which is falling itself. We believe the bearish momentum will continue after the price breaches below the lower boundary of Donchian channel at 212.43. This level can be used as an entry point for placing a pending order to sell. The stop loss can be placed above 231.65. After placing the order, the stop loss is to be moved every day to the next fractal high, following Parabolic indicator signals. Thus, we are changing the expected profit/loss ratio to the breakeven point. If the price meets the stop loss level (231.65) without reaching the order (212.43), we recommend cancelling the order: the market has undergone internal changes which were not taken into account.
Fundamental Analysis of Stocks - Netflix Inc.
Netflix stock plunged 35.1% after worse than expected Q1 results. Will the Netflix stock price continue retreating?
First quarter Netflix results missed Wall Street forecasts which resulted in a selloff of streaming service’s stock yesterday. Netflix reported the loss of 200,000 subscribers in its first quarter, falling well short of its modest predictions that it would add 2.5 million subscribers. It announced revenue of $7.87 billion versus anticipated revenue of $7.9 billion. Netflix last reported a subscriber loss in 2011. Netflix’s decision in early March to suspend service in Russia after Ukraine invasion resulted in the loss of 700,000 members. At the same time the company said it expects second-quarter net paid subscribers to decline 2.0 million compared with 1.5 million net adds in the year ago quarter. Falling subscribers number is a bearish factor for streaming services company’s stock.