You are allowed to post of services on this forum as long as they are relevant to the topic being discussed. You have mentioned your signal service on every post you have made pretty much from what I have seen thats advertisement and not allowed.
And besides that the best signal services out there are already on your charts you can set alarms to your strategy. Not someone elses. Please dont take offence this is just my opinion but I pay spreads to make profit I dont pay others to hear what they think about the market. All you got to do it post a chart on here asking for an analyst of that market and you will get it for free.
That may be true, but I know Vladimir and he is one of the best traders Iv ever seen, sometimes you get what you pay for. Sometimes it doesnt hurt to learn from a pro.
your right it never hurts to learn from a pro but there are other forums for that. This one for newbs getting into the trading business. Honestly they need to figure out there strategy that works with there risk management on what times they can trade. (in other words work fits them and there lifestyle). I have never signed up for one you have to buy and probably never will but I have a few free ones that are good but way out of my price league or does not fit me as a trader. Good for watching the market they are pretty good for showing me stuff that I dont see but not my trade style. With that said it adds extra noise that a newb really dont need to know it adds confusion to just looking at the chart and getting a feel of money movement. Thats what they need then they can do that if they want but like I said there are other forums for that check holy grail and another 1 I cant remember the name. This could be the best signal service on the planet but if a newb dont know what to do with it hes doomed. I am not trying to tell you what to do I could not care less. I am just speaking from the heart here. I am a newb and in the beginning I read every strategy got about all free signal services out there some are good some are not as far as I am concerned. But to become successfull or at least decent breakeven (a little over what I lost getting into the market) I had to forget all that and look at what was in front of me not outside noise (we have indicators for that).
I agree there is some great free stuff out there, thats how I got started in trading, Vladimir sent out free weekly reviews and also has a free website where he talked about the market. I just liked his signal service the best personally becuase thats where I learned everything I know, like basic stuff from money management and drawing trendlines to more advanced strategies. If I would have looked around Im sure I could have found alot of this info for free like you said but iv made money trading and thats the end goal. There are lots of ways to learn and be succesful in this business, and I wish all of you the best in your trading.
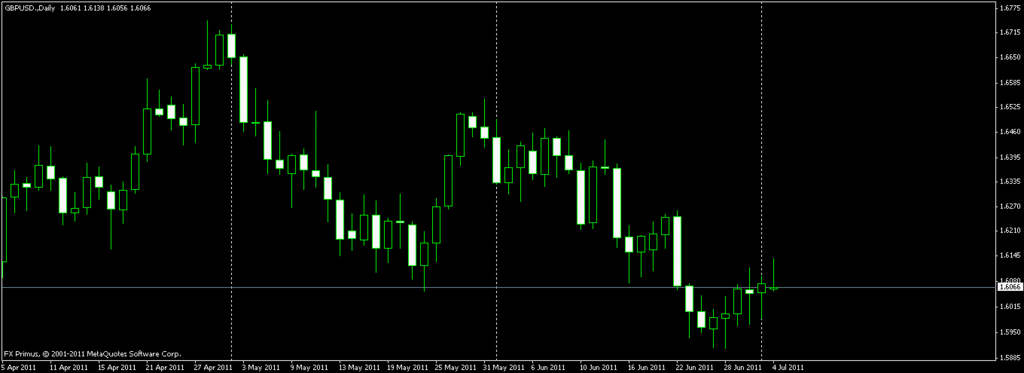
FX Primus.
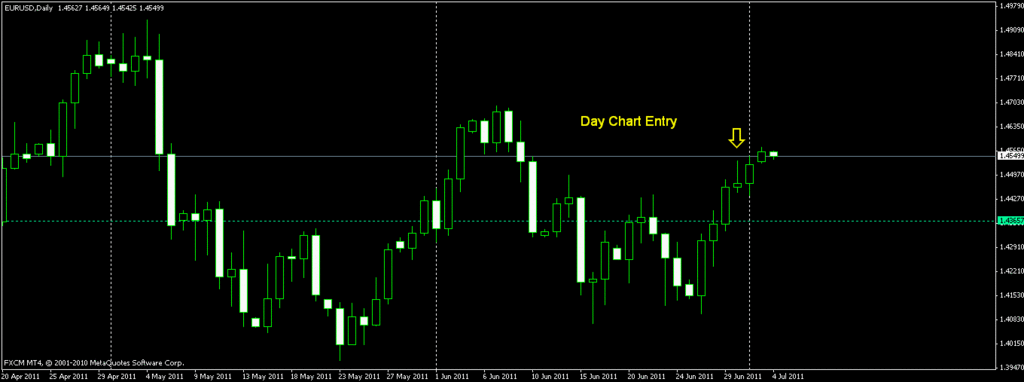
FXCM.
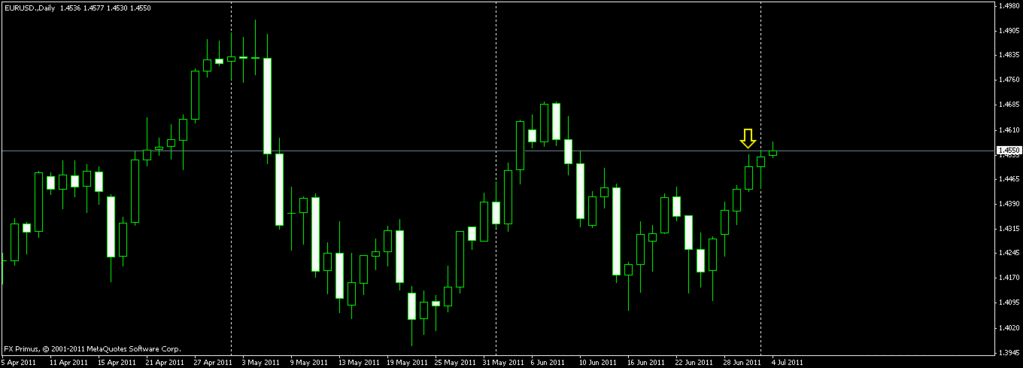
These are two charts from the MT4 platform.
One is from FXCM and the other is FX Primus.
The charts are the same as far as the H1 and earlier TFs are concerned. There is a difference of about two pips on the price levels but the total pip count per candle and all is the same.
Now the difference starts with the D TF.
If we are trading Candle stick patterns on D TF, then such a big discrepancy in the charts will be disastrous.
If you see the yellow arrow on both the charts you know what I mean.
I took a sell on the following day basd on the FXCM chart. I took 40 something pips and it went as far as 75 pips on a sell. But I assumed it to end as a bear candle and it would be a continuation of a sell today.
So obviously my chart reading was wrong as my chart itself looks inaccurate if I compare it with FX primus chart.
The FX primus chart has five D candles per week, FXCM has 6 candles. Futhermore, FXCM platform closes the candle at a different time compared to FX Primus.
I would like the input of senior traders in regards to this.
How do we avoid the near disaster like EU the other day??
Happy Pipping.
I saw this one other time with some brokers. The reason they were different was because of different broker times. I bet if you look at the 4h they are a little off as well. The only reason I think that is the case is becuase you said that 1H and lower are the same which would be the case in this situation. Hope that makes since, I would not worry about it unless you are compairing charts with someone else then you would want to make sure your brokers are on the same broker times.
Yep I think I mentioned this to you earlier on here. You should not have a sunday on your daily chart if you do chances are your charts are wrong. Reason market dont really open on sunday it opens on monday so if your chart does its not calculating the chart right even if there are spot on as far as price the candles are not acrruate. I will find you some good llinks on that I had them saved but I just cleaned my computer and seemed to have lost them. But its free info if you google it it will expilain better that I can I am not good with explaining stuff sounds good in my head but every one else will look at me like I am crazy lol.
I should also throw this out there not all brokers charts are crap but check with them you can adjust your time setting with alot of brokers. But I dont care if you are on a 1 second chart if you see sunday on it thats a dead giveaway your charts are off. Market do not open on sunday I dont care what day it is when you look at your charts.
Sunday Candles especially on Min 1 appears as gaps Bobmaninc…on D TF they apear as a complete candle.
Keith89, the chart pattern on D TF causes me alot of worries as I trade on Chart patterns exclusively. If you would be kind enough to see post number 56, you would see how this nearly would have cost me money.
The candle was a inverted hammer or something with a tail above. So I shorted on a HH the following day.
That is why chart accuracy worries me.
FXCM trade station charts are identical to FX Primus MT4 charts on D TF. I am going to abandon the FXCM MT4 charts for the time being.
We are small time players on the market, we cannot afford to trade by going against other traders because of the inaccuracies of our charts.
Bobmaninc, Im on google after lunch to sort this.
Yea I could see where that would have been a problem. I have had good luck with Finfx and 4runnerforex, I have never had an account with FXCM so I do not know much about their charts.
Thats chart looks better. I will be looking to go short hoping to see price go up to about half way up that wic on that candle tomorrow then I am short. As price is hitting resistance on thetrend channel. Also you can see price entered the area of support of the previous swing lows and then rejected turning it into an area of resistance. Hoping to see it make a new low that would be a nice trade setup.
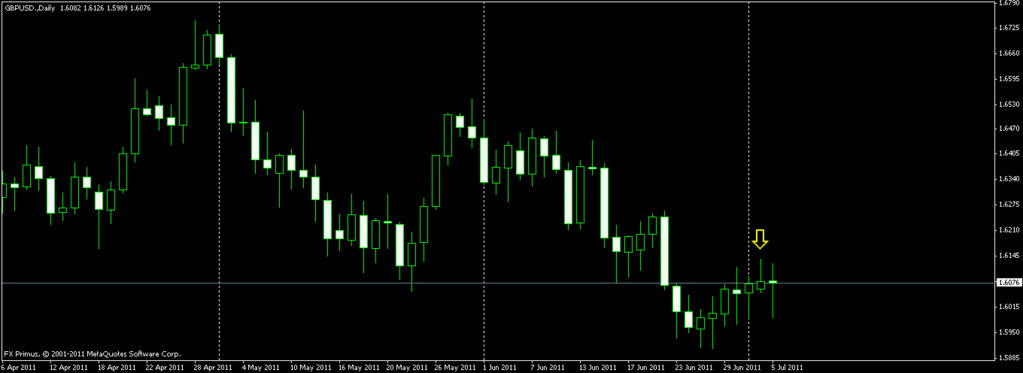
This is GU D TF. As per yesterdays take, today was an expected sell.
I didnt take this one.
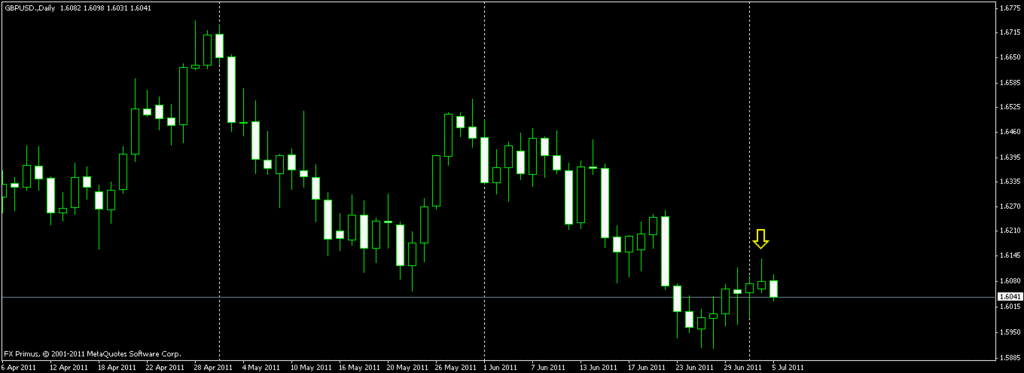
The reason I didnt take it was I saw something more promising.
AU D TF
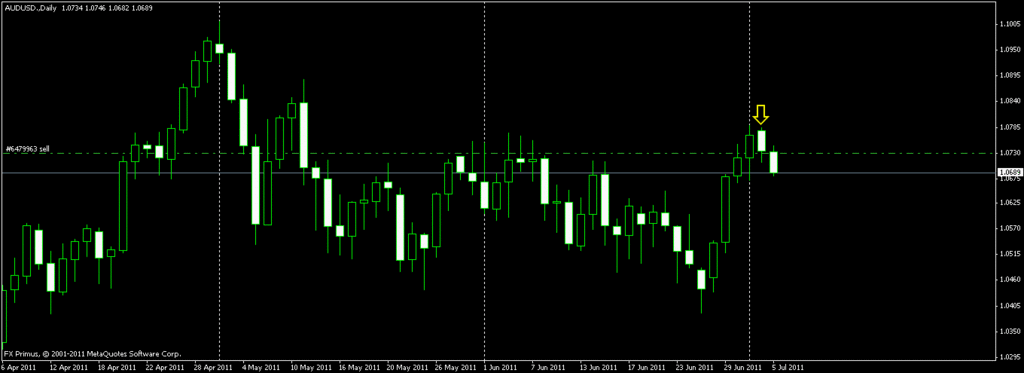
So following my communist doctrine, Yesterday was a sell so today is a sell.  ( again dont take this literally. You must be able to read charts )
This is AU H1 TF.
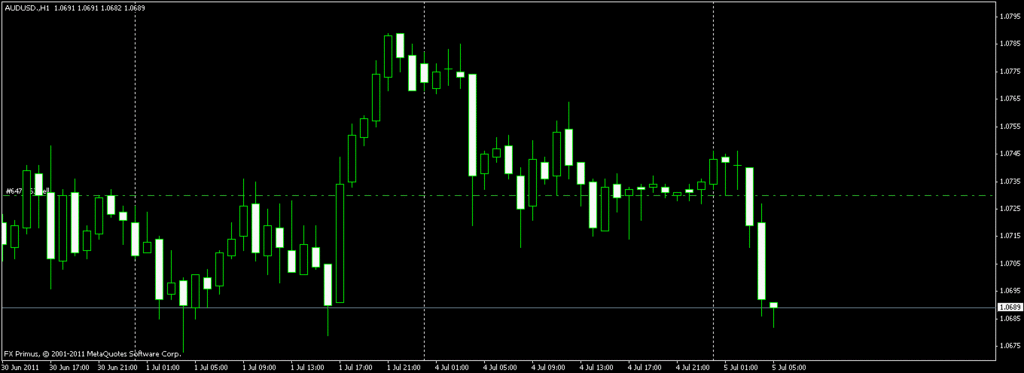
If we look at H1 chart, you will see what I mean of not entering late into a trade. Try to catch it as high as possible for a sell and as low as possible for a buy. It really helps with ur SL.
If you just got to look at the charts and this is what you see, then wait for a better price. Entering now will cause you unnecessary emotional roller coasters as price goes up before falling, or if the position was not a strong one, a bigger loss.
I decided not to complicate matters too much by adding indicators and such. I suggest the newbies do the same in the beginning. Read about candlestick patterns, read about price waves and see how it moves in a real chart. Pay attention to the higher highs and lower lows and read up on support and resistance. No doubt Support that is broken now becomes resistance, ( which is closely related to price waves ) but the real chart is not so straight forward. So read up and watch the market. Kill a few demo accounts. Go from here.
But whatever that is you are doing, pick a simple system and stick with it. Then patch up the parts that you are not sure of or the parts that you are making mistakes with. Dont chase pips as you start off, it makes your learning process even longer, harder and more frustrating.
With that being said that doesnt mean I have shut my ears and eyes off to new ideas. I am looking at adding more pips to my account all the time. But at the moment this is my main way of pipping.
Happy Pipping.
( Update at 12.50 GMT + 8. Hit TP 60 pips. Done for the day )
I seen that aussie trade but I am still short minded on the aussiedollar if it breaks that 10800-1.0900 (and then that swing high at 1.100) areas of resistance I will back back on a aussie rally so right now to close for me to tell whats going on but the next few days-week will tell alot as far as where the direction is going to go . I did not bet on your long trade actually going that far now she has alot of room before breaking a lower low or a higher hi. Qutie honestly I want to see pirce bounce off the 1.0600 area of supposed to be support and I might just go long. Hoe to catch the beggining of an up trend in the making. I did however enter on the GPB chart in you last post. I went short but moved my SL to just past break even a little soon. Got hit but a quick scalp of 15 pips so I wont complain. But I did risk more than that in the beginning. I have to work on that. My average win is mot 3 time my losses like my trading plan states for me to trade at. Greed is a pain even when trying to cut losses. I still think it is a good trade I just got kicked out of this one so I am out. But hey what ever eliminate risk as soon as possible and get my money from exposer to the market.
I do that often also…move SL to BE + 1 or so especially when it has moved about 40 pips and I see there is room for more.
cut risk off a trade.
Greed always is a pain, especially when its going against you and u refuse to take a loss.
happy pipping.
USD CAD has a beautiful setup at the moment for a buy.
Pip count is small but a nice setup nevertheless.
( p/s as of 6th July 2011 1605 GMT + 8, USD CAD is still up. Pip count is still miserable  )
)
GU D TF Chart at 0121 GMT + 8.
hahahah ur guess is as good as mine on what its going to do tomorrow…
So not sure? Dont know?..keep away
EU D TF 6 July 2011
So In light of the doctrine of mine that if yesterday was a sell then today is a sell
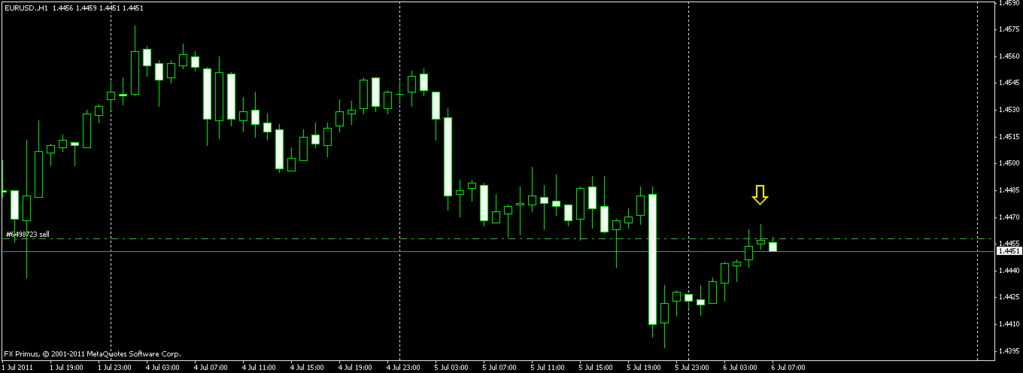
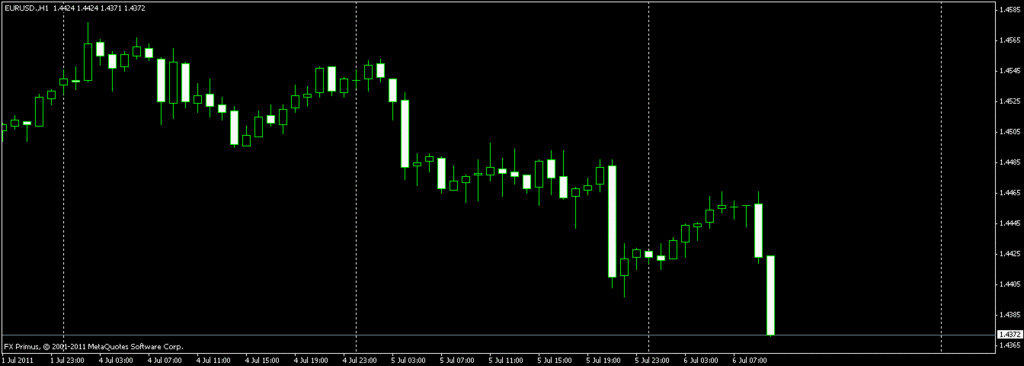
EU H1 TF
I am still trying what Bobmaninc suggested. So I entered a sell when I saw the first smallest bull candle with a long wick at the top as the signal of a reversal. It doesnt get any better than this.
EU H1 TF
Drawback was about 11 pips or so. TP was my max per day of 60 pips. Its still going south strongly.
The H1 candle stick trading is starting to come together for me.
Bobmaninc, Thank you Sir.
Sharebazar, I hope you are following.
Happy Pipping
