Newbie take at the Journal

Here we go,
I am still using my demo account but I want to get serious about it.
I really hope that making a journal will not only help me with my integrity but will also give more experienced traders the opportunity to scold me if they see I am screwing things up or giving suggestion.

I started my trading with an intraday approach.
I was looking at the 1h and 15minutes chart.
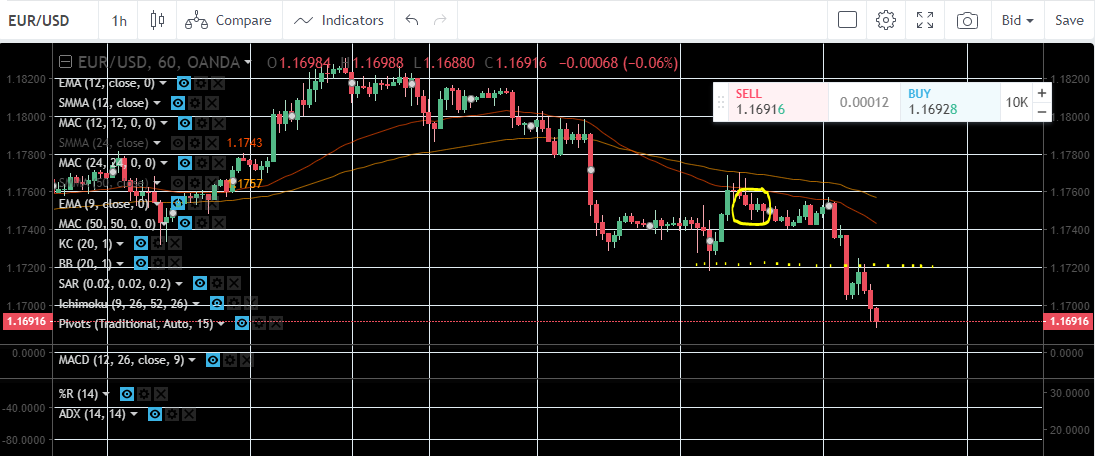
I was and still am focusing only on one pair, the big EUR/USD, as I read it is recommended to keep the number of pairs lower at the beginning.
I used to look at the graph and then throw all the possible analysis: candle pattern, support/resistance and various indicator: MACD, Ichimoku, SMA and ADX. Pivot lines too.
Intraday is not the way I want to trade in this time of my life though, as i have a full time job. On EUR/USD I was trading the superposition between the London and the NY session, that is a little bit before 8 till lunch time (I live in Miami).

With the start of the journal I will monitor a more stable and less time demanding approach, I will monitor a swing trading system, keeping it as simple as I can.
I will trade the price bounces on the 24 and 50 SMA and also the times when it cuts through them, basically considering them as trendlines.
I already did some trades in that sense, which could have been way better with better SL and TP, which I am still figuring out with this new approach.

My goal is to net 30 to 50 pips a week, but if I manage to stay neutral/positive for 2 months, even with much less of a profit, I will consider to open a small live account.

Hope to get some giudance from the babypips community!

2 Likes

I don’t know if I have to reply to the previous post or how else do I add new posts.
This morning I closed my first trade since the start of the journal. Odd enough it was a positive one


I entered on the bouce of the price on the SMA 24 and 50. The overall trend looked bullish so I interpreted the movement as a retracement.
I had other input to support this reasons, like the article on babypips saying that the pair this week was oversold. If I go to the %R indicator, however, it apear to be overbought, for a long time actually. This can confirm a relatively solid uptrend, supported also by the ADX.
I am simulating the situation that will likely be if I pass to a live account with around 500$: Oanda gives me a 30:1 leverage so with 330 $ I can move 10k, which means one pip will be equal 1 $. I will put SL between 10 and 25 pips, risking maximum 25 $ which is less than the 1% of what I have at stake. Depending on the situation I will aim for a TP from 20 to 40 pips. What I choose as a SL depends on supports that I can see, I will put my SL right outside the support, so I have more chances that the price won’t hit it. According to that I put my TP in order to have at least 1.5:1 ratio, but giving the priority to stay inside other resistences.

In this case I entered at 1.17330, put 30 pips as a TP, in an area that saw a little plateau last week and the SL 1.17095, around the stronger SMA 50.
I left the trade run overnight and it hit the TP at 6 30 in the morning. I like this approach rather than stay glued to the screen for every trade I take. Also in this way I feel I have access to movements that happen ini session when I cannot trade. Anyway the prices is not too volatile outside of NY and London sessions, at least it is not supposed to be.

Now the price is retraceing again towards the SMAs, I don’t know if entering again on a further bounce or wait for a stronger signal. I am afraid I could be already overtrading.
On one hand I already hit my goal for the week (30 to 50 pips). But I know that is a lie since at the beginning of the week I had a couple of losing trades. Just it was before starting the journal.
Any suggestion what to do in these cases? I already start to ask for suggestions lol.

Its good to hear you are using a method that isn’t making you a slave to the market, i teach that to my students as well. Good decision for you to track and journal, that is what all the pros do so keep that up. Let’s see if i can give you a few quick tips:

Your risk-reward ratios are not very high which means you will have to maintain a high success rate % to be consistently profitable, which can be stressful. The moment you hit a losing streak it can really kill you and your confidence which can be a vicious cycle in your mindset that is difficult to breakout out of (believe me I see it all the time in my consultations) This style of trading you have here i can almost guarantee will continue to go in wins and streaks.

1 Like

If you weren’t planning on entering again initially, I’d stay away from it. I have the same tendency - to try and grab “opportunities” when they appear but like you said it puts us in the area of overtrading. So I’d stay out until it’s actually part of your trading plan! :slight_smile:

I should have read the suggestion from ponponwei before. As the new article from Big Pippin. He said that we were going into the emotional resistence area of the 1.17500 and the double top together with the divergence on the stocastic could suggest the begining of a downtrend.
Now, for my personal interest, letreview what a divergence is:
basically is when the stocastic (or, i suppose, the R%) is telling a direction that is not the current direction of the price.
In this example, the price made a higher high while the stocastic (again, I use the %R but they are supposed to be very similar) made a lower high.
Since stochastic and family are not laggind indicators but they rather anticipate the trend, that was a indication of at least weakening of the signal.
Not thinking the price is gonna drop but definetly not going long. Also because there were not other strong indication for further uptrend.
Exept that doji. The price retraced to the MA and make a doji and I, that I didn’t do any trade yesterday until that moment, read it as enough. The price would have bounced to the SMA and continue its uptrend. Which it kind of did but not enough, rather started to stall along.


Another aspect to keep in mind is that late thursday and friday, if not necessary is better to stay off. Positions are getting closed so there could be some small reversals and in general there is less movement compared to tuesday wednesday and thursday, when I should capitalize on.
The tricky part is that entering into bounces or cuts of the SMAs actually is part of my plan so the move was not something strictly out of the trading plan.
But as for the future, I’d better stay out if in doubt or if I simply feel like I am stretching things.
If I am afraid of being overtrading, then probably I am overtrading. (for my skill level)

-20 pips
actual net
+10 pips
W 1
L 1
Thank you for the comments and the suggestions!

I probably should implement this in a bot.
I lost a signal on sunday night when the price crossed again both MA and in fact would have been a profitable trade with the TP I normally use.
Instead, I thought I collected another loss, while I ran into a time expiration, well, way better.


The circle is where I should have entered, except it was full night and I was sleeping.
Monday morning I see the price has gone up and is still going up; and here is where I have to thank writing the diary and the support of BabyPips community.
I wasn’t there when the movement started so to jump in would have been a reckless move, just seeing something and try to grab it is what I learned to be not a cautious move and I need to be a cautious trader.
I remember reading something similar in trading by the book by Joe Ross.
If I jumped in what would I have written on the diary?
What I did was only less reckless though: i said, ok if the trend is strong this direction will be confirmed by a rupture of the emotional area of the 1.1800, so I set a position where I thought was far enough to be above any spiky movement to test that threshold: if the price would go to 1.18200 it means that is definitely passed the resistance and a confirmed bullish trend will go up, I thought. Put my TP by 30 pips, in the next hot area and SL accordingly to have a 1.5:1 ratio.
As expected the price tested the 1.1800 but started stagnating and it still is. My entry point wasn’t hit and I didn’t loose anything.
On the other hand, now the SMAs cimbed up following the price, which means the support is closer. It could bounce above or break below but I doubt it will continue ranging.
Now, I remember what Big pippin said last week about the divergence and on the %R in effect could be another bearish divergence since the price has an higher high while the indicator doesn’t.
image
Ichimoku have the two lines about to touch each other, which can mean a reversal or anyway not a strong trend. 1.1800 is also a pivot point.
The ADX gives strong trend at 40 value.
All this could be the price is struggling to move since we are in plain resistance. I could place again my long entry out of that area, to be crossed when the bulls gather more strenght.
I want also to put an entry below the 50SMA in case the price would start go bearish and cut those.While I will make the first with a day span, the time frame for the latter will be shorter, so I can move the entry signal if the SMA changes much.

Disaster.


So basically what the price did was indeed pierce through both of SMA, only to retracing quickly next candle. It hit the entry point and the SL right after.
In this case probably a SL should have been on the SMA on the top. What do you guys think?
Anyway the second mistake was to get it again. I saw some double bottom and the price still going down, I thought “ok it fluctuated, tested the direction, now is going down”. Nope. It retraced again.
Next thing I now the day after, this morning, it cut through the SMAs again, both ,and it goes up. According to the plan I entered long, however the price when I saw it was already up, around 1.1780, i entered then a little higher than that putting the SL on the first SMA.
Maybe that one was a mistake, the SMAs act as suppport levels, so the SL would have been better to be put lower than that. I need as many obstacles as I can before my Sl and as few as I can before my TP. The price tested again the support of the SMA, didn’t pierce through but was enough to hit the SL, so 3 losses in a day.
-60 pips
actual net
-50 pips
W 1
L 4
What do you guys think?
What could I improve? Do you agree with my auto analysis?


that’s what happened in the last days, I am seriously going to automate this, but until then I am going to miss some entries. i open the pc and I see the price whent up the SMAs and it’s going up hard. It already retraced and confirmed the movement so I am jumping in (not ideal), but with a smaller TP. Got that trade successful, then put another entry passed the 1.1800 threshold, far enough, I thought, to confirm the trend in case it reached the point.
Iwas wrong: the price moved up but retraced immediately, reversing until touching the early SMA. This, though is another signal. I put an entry on the bounce, again far enough to try to avoid fakeouts. The order got a time losses as the market close for the weekend.
-5 pips
actual net
-55 pips
W 2
L 5


Same thing today. After I opened the PC I saw the price pierced through. Same concept, I entered short but with a smaller TP cause the movement already started.
Then I see the clippers, sign of an inversion, which makes sense cause the price is very far from the SMA now and it should retrace to test them again, so I entered long.
image
The price actually went in my direction, but not before oscillating so much to hit the SL.
I should be more careful with this trades that don’t have strong signals and mostly happen outside the NY/London session. The price is more stagnating and has less momentum, so it is more likely to be more indecise.
Now that the price has actually hit the SMA and is bouncing back it is the signal I am talking about. MACD inverted, as well as the very same SMAs. Confirmation ,also from Ichimoku.
The thing that makes me think and I don’t know how to interpretate is that while the 15 min R% says it oversold, the 1h tells the opposite. What can it mean?

-10 pips
actual net
-65 pips
W 3
L 6

Again as I said before, this method will continue to go in streaks of losses. That was 13 days ago and predictably it hasn’t changed. I see you are putting in the work to track and journal, so it speaks that you are serious about this business and so I will open my door to you to help you if you are interested in a free 1-hour consultation. Let me know.

you actually said the following

I didn’t understand you were referring to wins and streaks of losses.
If so you had it right. From what I got from your comment one way to make it work is to rearrande my TP/SL ratio?
It would be great if you could elaborate that. Thank you so much for the offer of the consultation, I will assume you are a cool guy and not somebody who lurks in forums to fish on unexpert people and scam the hell out of them with free consultation that lead to a multi-K program.

if it’s free you can do your consultation here in the journal so other fellow noobies will get the, however free, precious insights.
Thank you!

This time went as planned.
As I show in the picture of the previous post, I was about to enter in the bounce of the price on the SMAs. This is strictly part of the strategy, unlike some of the other trade I did that were a litlle bit forced, that is I found opportunities I went into but that were not part of my core strategy.
A strong signal was also that the 24 SMA crossed the 50 SMA, showing the beginning of a bearish session. Other indicators such ichimoku showed the same but I didn’t know how to read the fact that %R showed overbought at 1h and oversold at 15minutes.
The intention was to enter quite close to the SMA and take the profit around that support level where the price retraced up.
That would have been around 30 pips, which is normally my TP anyway.
I use 1.5 ratio TP-SL but I can adjust it if there are any resistance or support in the way.

Anyways I waited and saw that the candle casted a shadow up, which means that the price is trying to go up but still the body remains on the downside. I then entered following the plan.
It worked, it hit the TP and actually went even further.
This morning I open the PC and I find this


Now, the price already retraed and re-confirmed the downtrend.
Before the journal I would read this as an opportunity and enter but now I am more cautious and writing things down helps me to be more strict to my plan. At least if I fail I can tell what’s wrong, while if I keep on doing whatever move I read I won’t be able to see if my strategy works.
Now the price is very far from the SMAs so it will retest them. I will wait until it does and see if enter in a bounce or into a cut.
+30 pips
actual net
-35 pips
W 4
L 6

apparently my response got flag and removed, not sure why but that is up to you if you want to share it after what you learned. Not going to repeat what i typed before but keep my reputation is a high priority. Good to see you are gaining back ground on pips lost.

@DrSpina
What is your result so far?