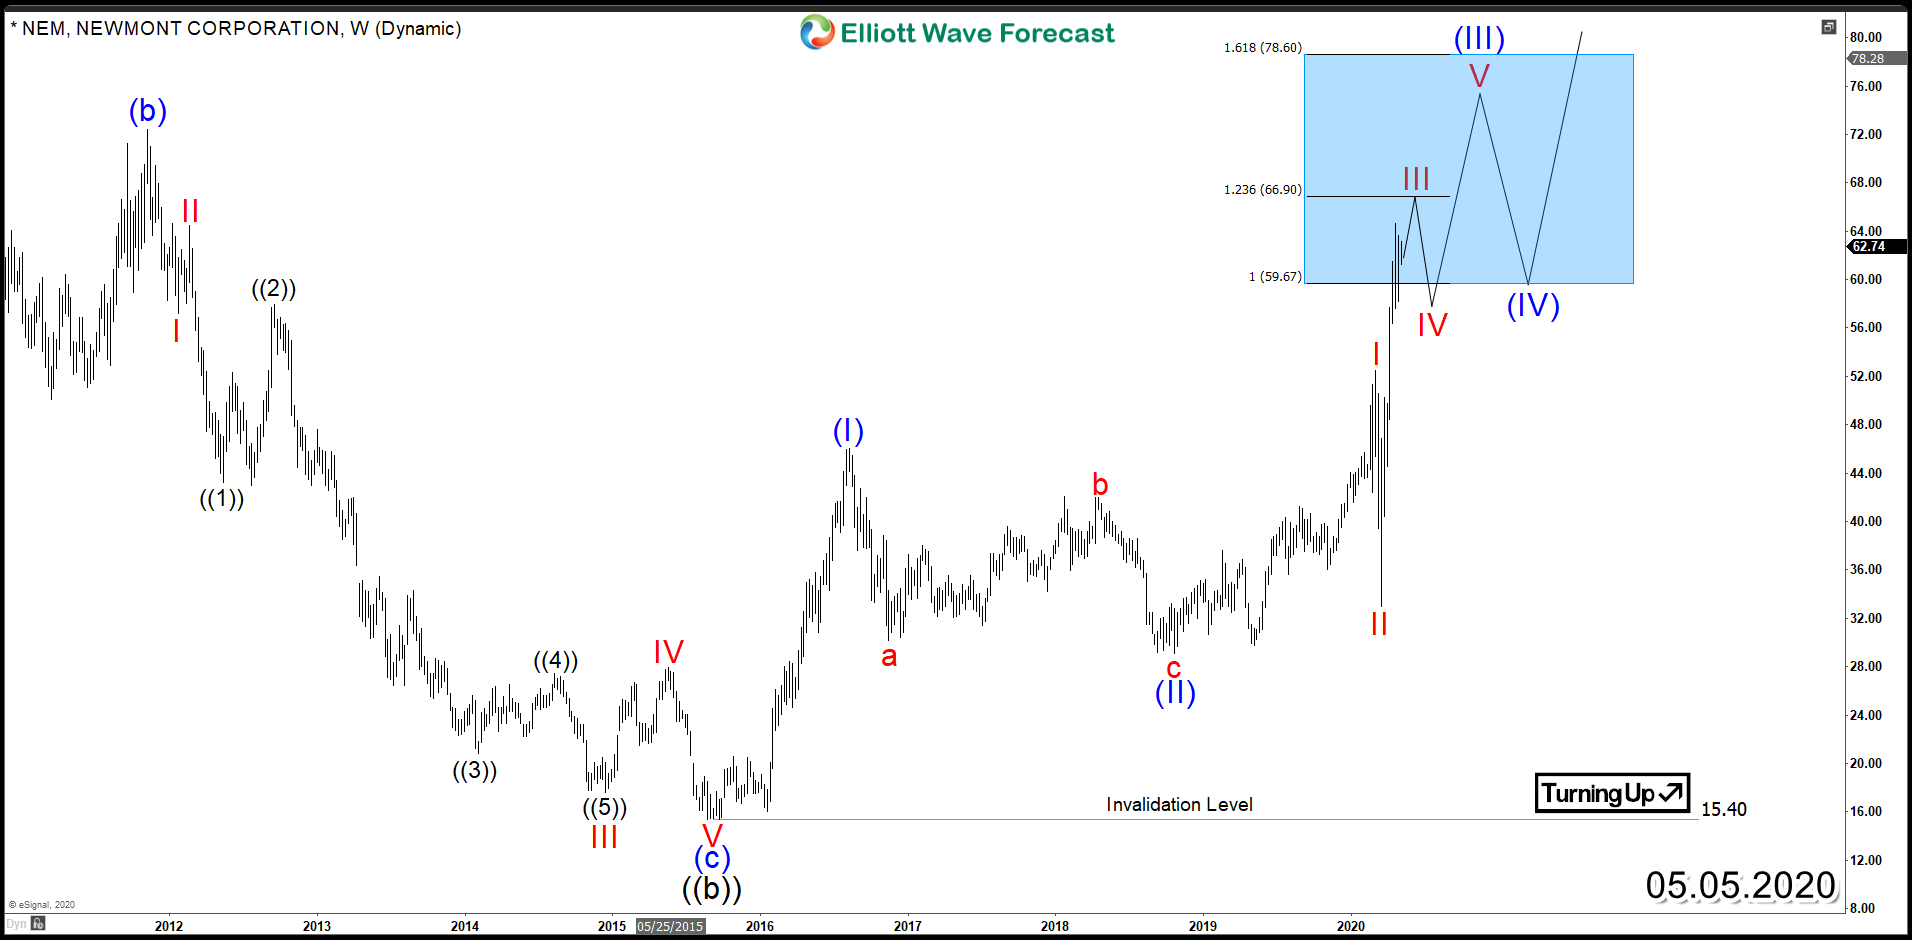
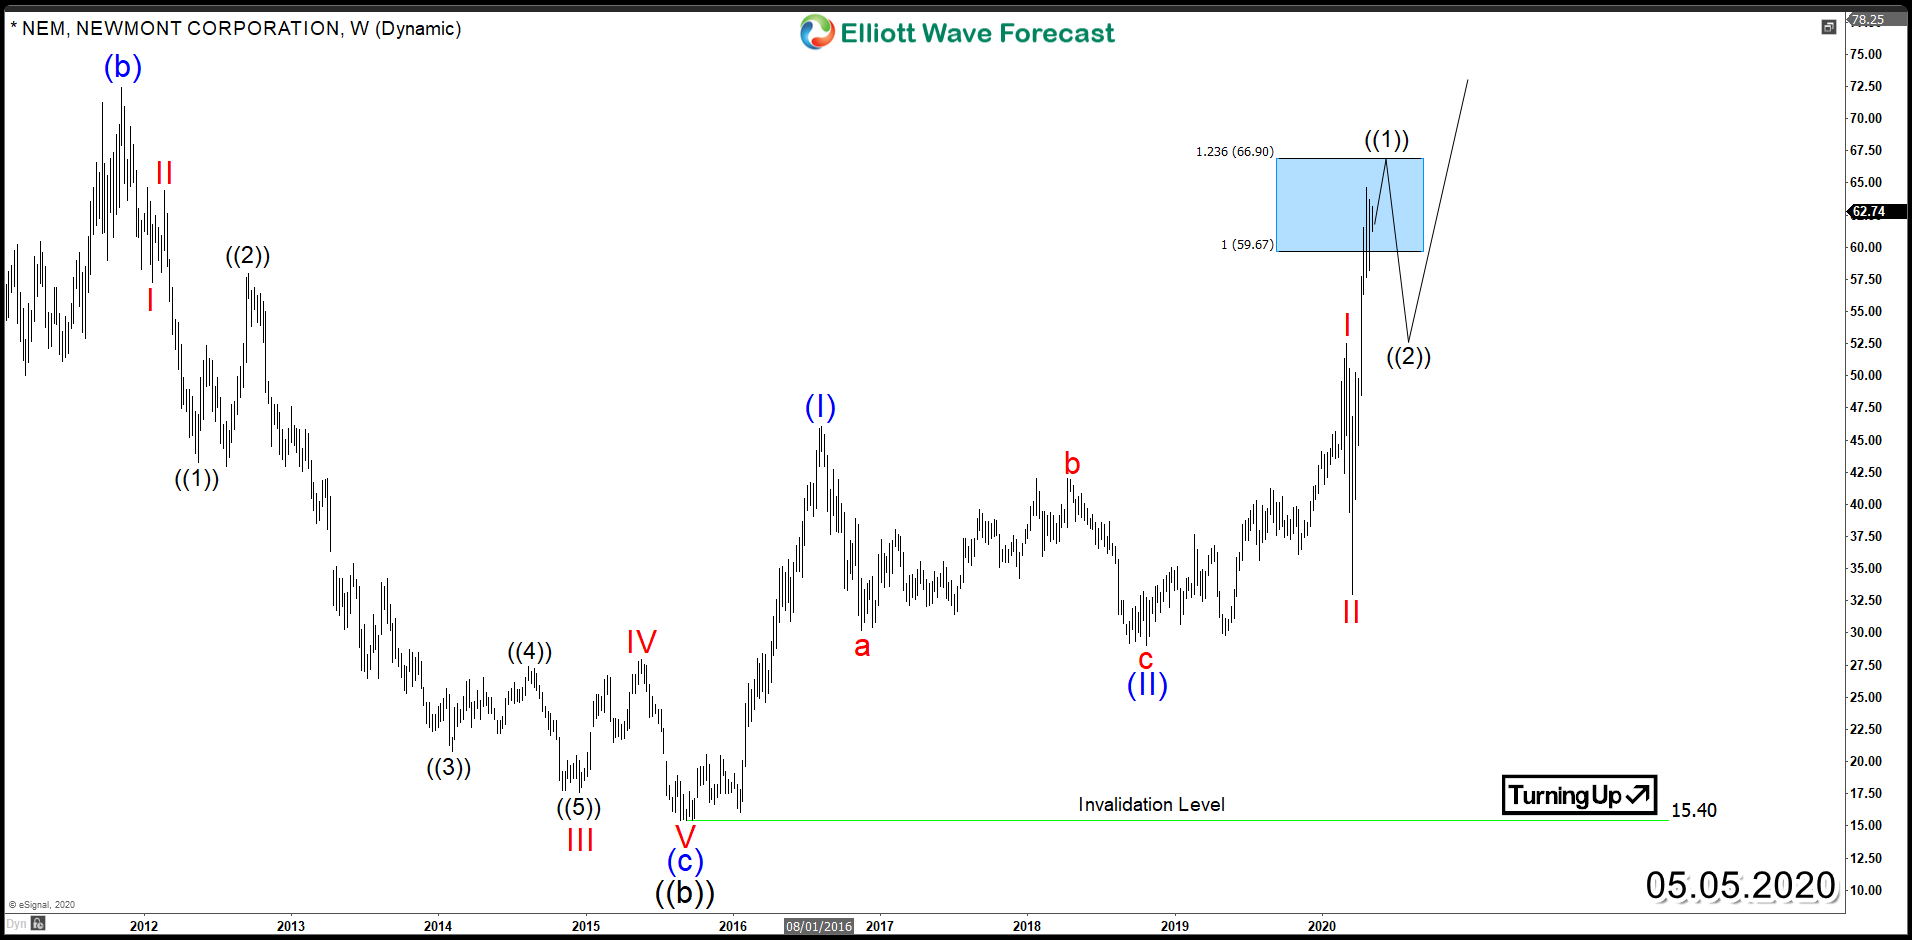
Newmont Corporation (NYSE: NEM) is the world’s largest Gold mining company. Since the major low in the precious metal back in 2015 around $1050, many mining stocks rallied significantly and managed to outperform shining metals. If we take a look at this year’s data, NEM is currently up 45% while GOLD is 11% which gives an edge to the stock at this stage despite the sharp correction that took place in March 2020.
If we take a look at the technical picture of the stock, we can clearly see the Elliott Wave Impulsive structure that NEM established from the 16th of March allowing it rally higher above February peak making a new 8 Years high. The stock still can see further upside within the short term cycle up toward $66 - $68 area but the cycle is already mature and a high would be ideally the the final leg within a 5 waves advance. Consequently, a corrective decline will be expected to take place in 3, 7 or 11 swings against $32.86 low before buyers will be looking to join the bullish trend again.
NEM 4 Hour Chart
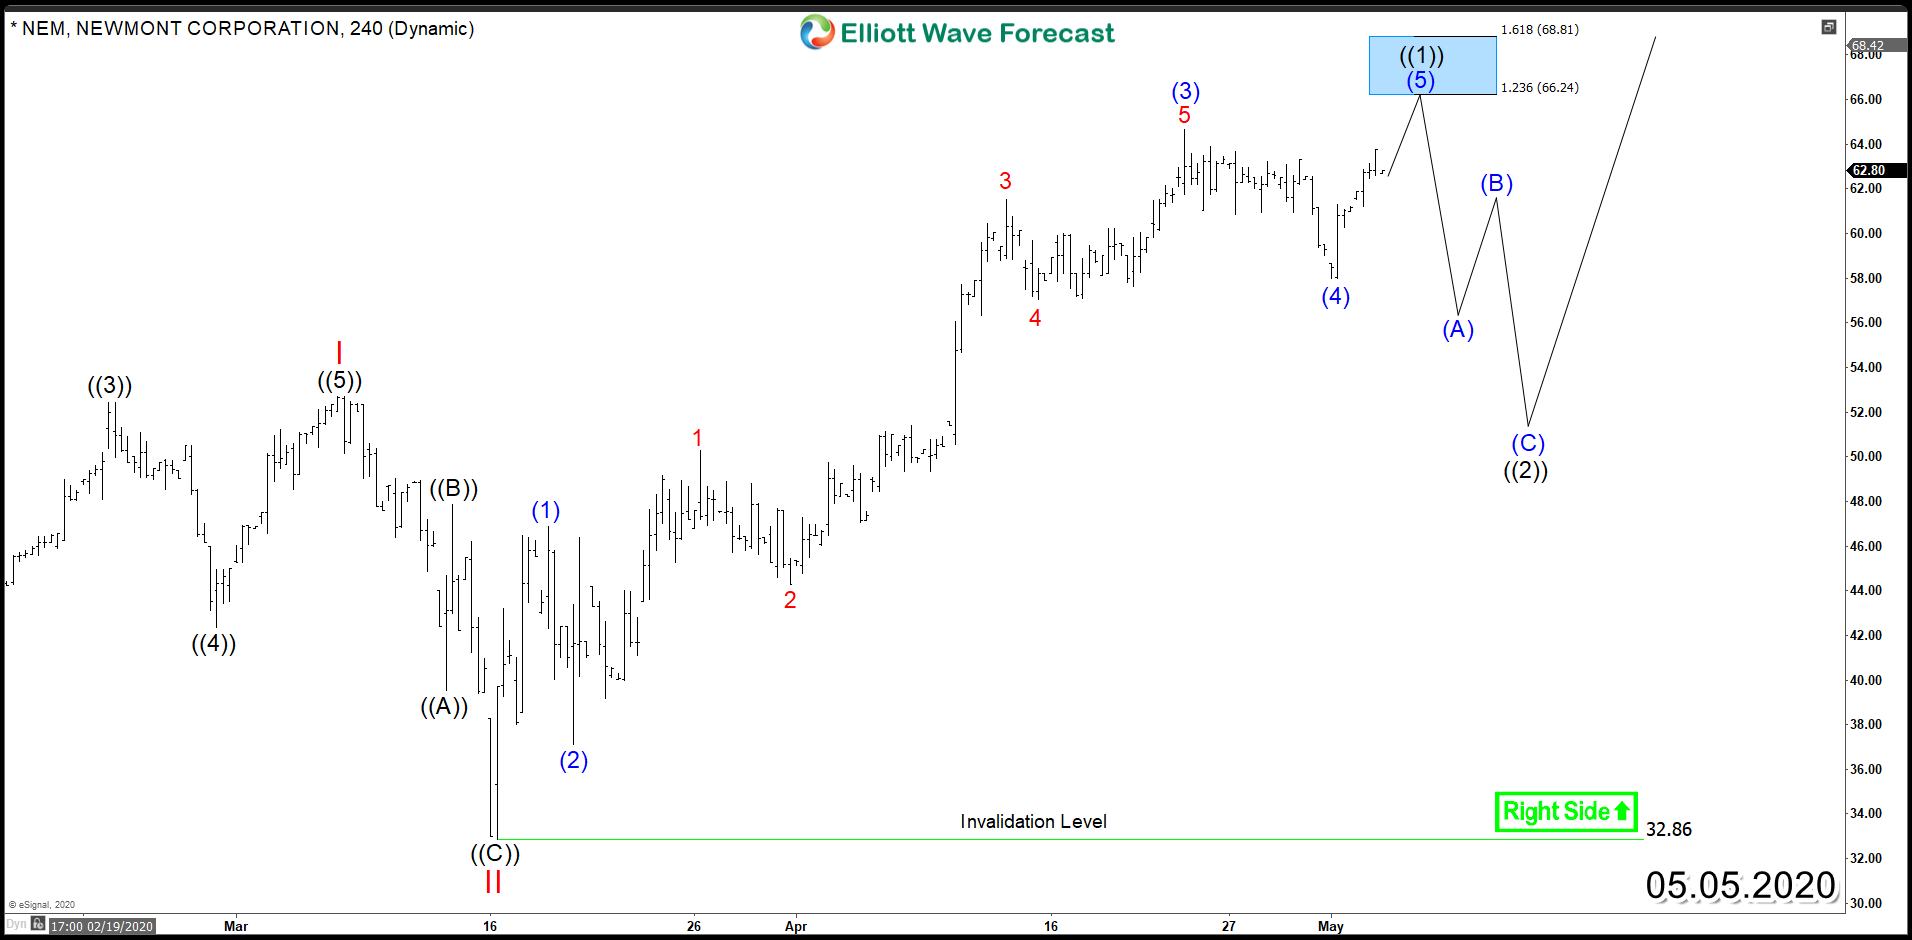
The next rally for NEM will depend on how deep the pullback will be. If the correction lower overlaps with the previous wave I peak $52.7 then the most probable scenario will be a bullish nest to take place. If the pullback only correct 23% - 38% of the previous rally without an overlapping structure then the stock could be doing a wave IV pullback which will also support another rally as a wave V within a regular impulse since 2015 low. Both scenarios are suggesting further gains for the mining stock as Gold price is expected to remain supported and break above 2011 peak in the Future.
NEM Weekly Nest
NEM Weekly Impulse