In our previous article on March 20, 2022 about Newmont Mining (NEM), we mentioned the stock can soon end 5 waves up from 2015 low and see a larger pullback. Fast forward 3 months later, the stock has started the pullback and still in the middle of it. In this update, we will look at the potential target and support for the current pullback. We will analyze it using Elliott Wave technical method. Newmont Mining (ticker: NEM) is the world’s largest gold mining company, based in Greenwood Village, Colorado, United States.
Newmont Monthly Elliott Wave Chart
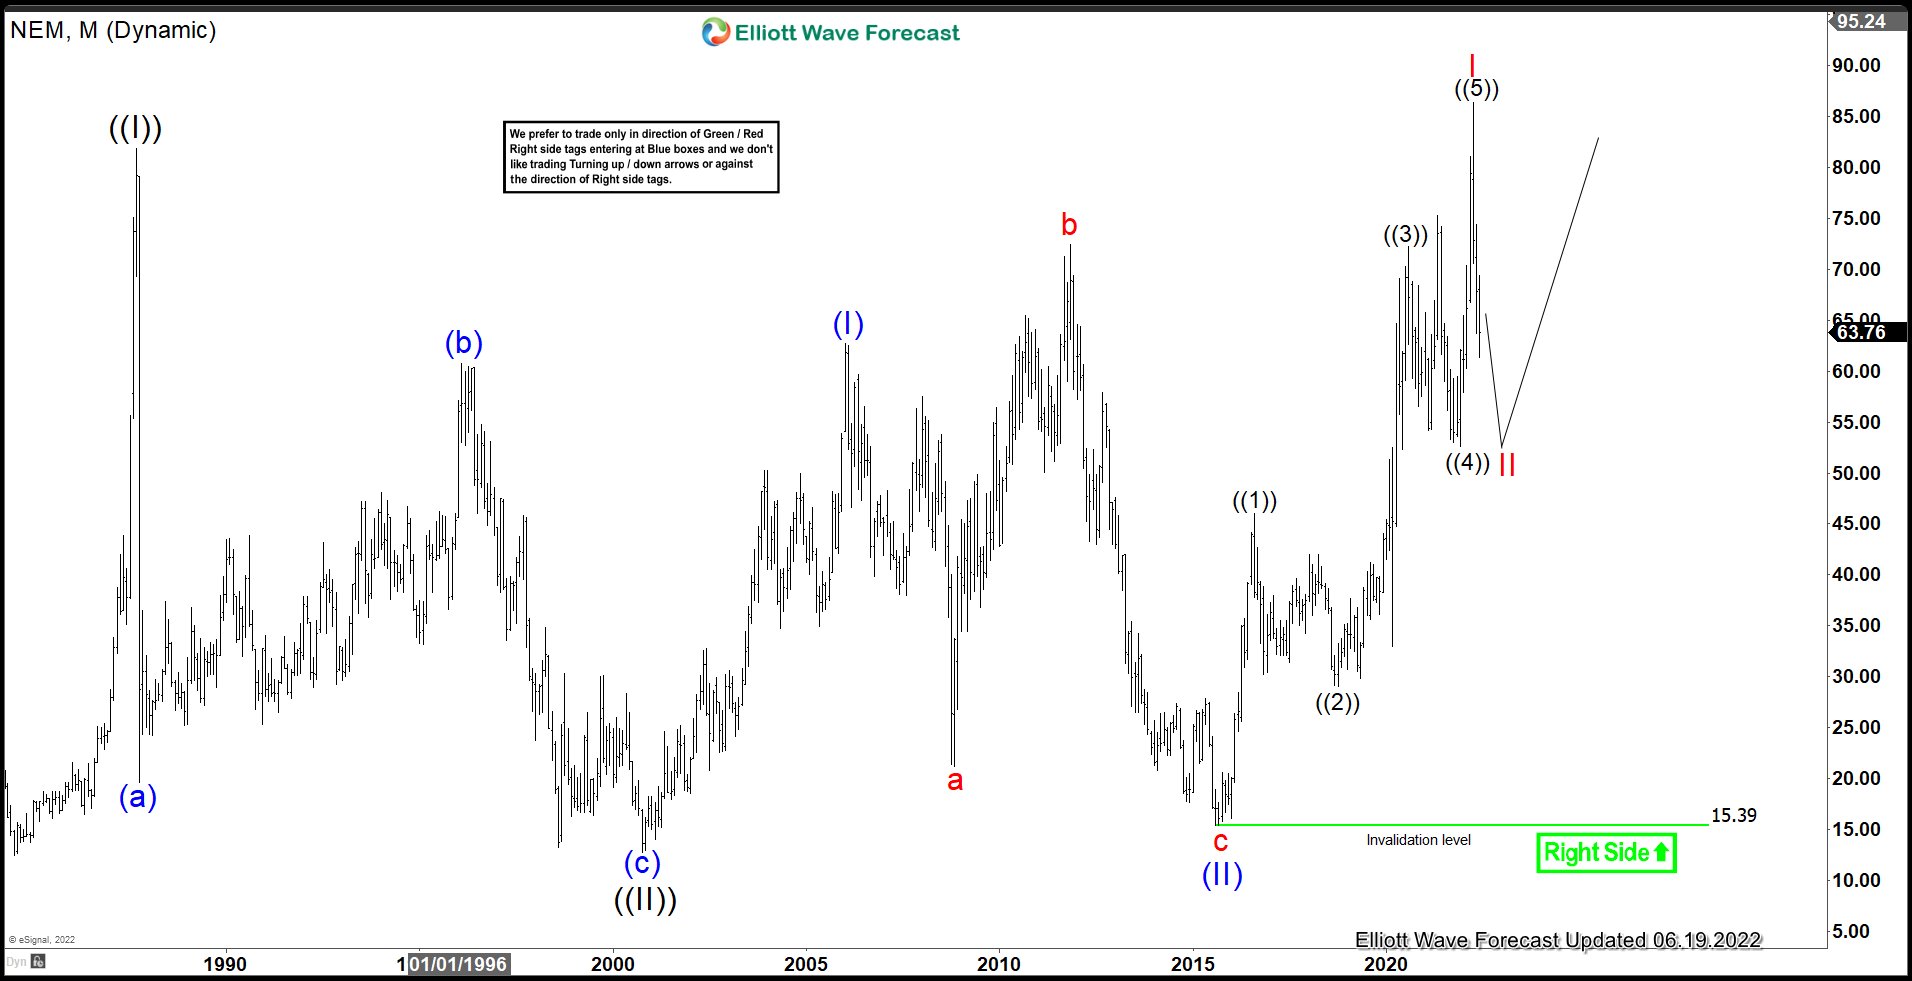
Monthly Elliott Wave Chart in Newmont Mining suggests the stock has started the next bullish cycle as it broke above previous wave ((I)) high on September 1987 at 81.92. Currently wave I has ended at 86.37 as a 5 waves impulse from August 2015 low and the stock is correcting that cycle within wave II in larger degree 3, 7, or 11 swing before the rally resumes. As far as August 2015 low pivot at 15.39 remains intact, expect buyers to appear once wave II pullback is over and stock to resume higher again. See below Daily Chart for wave II possible support area.
Newmont Daily Elliott Wave Chart

Daily Elliott Wave for Newmont Mining (NEM) above suggests wave II pullback can be unfolding as a double three ((W))-((X))-((Y)) structure. Down from wave I high, wave ((W)) ended at 63.68 and wave ((X)) rally ended at 70.16. In this structure, wave ((Y)) lower is in progress and can see further downside to reach 42.16 - 47.48 area to complete wave II. Afterwards, it should resume higher again or rally in 3 waves at least.