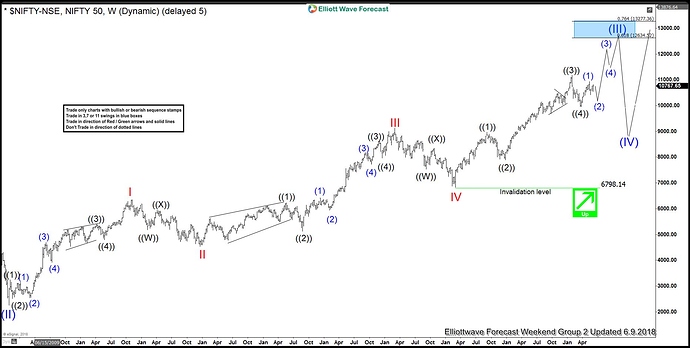
The Nifty 50 Index has a bullish sequence from the lows to the all time highs. The index currently shows nine swings up from the all time lows into the 2018 highs. It is now correcting the cycle higher from the February 2016 lows. This is noted on the chart with the red 8 label. In this article there is not an Elliott Wave count on the chart as it’s the natural swing count the price and momentum indicators suggest. Notice from the all time lows to the 2008 highs appears to be 3 swings as noted with the red 3 on the chart. Next, the dip into the 2008 lows was strong enough to suggest it was then correcting the whole cycle from the beginning. That was the 4th swing.
From the point of the 2008 lows there are a couple of preferred ways to put Elliott Wave labels on the move. I will focus toward the possibility of there having been a leading diagonal wave one with the 2008 lows being a wave two. If so, then it already saw a wave three that subdivided in three swings into the 2015 highs. That is marked with the red 7 and is similar to the wave one.
Continued below chart.
Nifty 50 Index Swing Sequence
The dip into the 2016 lows was strong enough to suggest it was correcting the cycle from the 2008 lows. This affirms the idea wave four is at the 2016 lows marked with the red 8. The bounce from there into the 2018 highs of course is the swing marked with the red 9. At this point of the 9th swing high, another option is possible as far as an Elliott Wave count. This 2018 high can be the larger wave three high of the cycle that started in 2008. The other is it only half of the fifth wave which would still need another swing higher.
In conclusion, there are several other correlated instruments and world indices with bullish sequences. All of these are only correcting the cycle up from the 2016 lows. It is all one market and his index should be no different. The longer term bullish up trend has temporarily stalled. After this correction of the cycle up from the 2016 lows it should see another move higher.

