NIFTY Elliott Wave View: More Upside
Short term NIFTY Elliott Wave view suggests the pullback to 9449.06 low on 6/30 ended Intermediate wave (2). Up from there, rally is unfolding as an Elliott wave double three structure where Minute wave ((w)) ended at 9700.7 and Minute wave ((x)) ended at 9642.65. Wave ((y)) is in progress also as a double three structure where Minutte wave (w) ended at 9830.05.
Minutte wave (x) pullback ideally stays above 9642.65, but more importantly above 9449.06 for the next leg higher. While pivot at 9449.06 is intact, expect NIFTY to extend higher to 9894.8 – 9954.5 to complete Minor wave W and end cycle from 6/30 low. Afterwards, Index should pullback in Minor wave X in 3, 7, or 11 swing to correct cycle from 6/30 low before the rally resumes. We don’t like selling the Index.
NIFTY 1 hour Elliott Wave Chart
NIFTY Elliott Wave View: Resuming Higher
Short term NIFTY Elliott Wave view suggests the rally to 9709.3 ended Intermediate wave (1), and the pullback to 9449.06 low ended Intermediate wave (2). Intermediate wave (3) is unfolding as an Elliott wave double three structure where Minor wave W of (3) is currently in progress towards 9894.8 – 9954.5.
Up from 6/30 low at 9449.06, Minor wave W of (3) is unfolding as an Elliott Wave double three structure where Minute wave ((w)) ended at 9700.7 and Minute wave ((x)) ended at 9642.65. Wave ((y)) is in progress also as a double three structure where Minutte wave (w) ended at 9830.05, and Minutte wave (x) pullback is proposed complete at 9778.85.
Near term focus is on 9894.8 – 9954.5 to complete Minor wave W and end cycle from 6/30 low. Afterwards, Index should pullback in Minor wave X in 3, 7, or 11 swing to correct cycle from 6/30 low before the rally resumes. We don’t like selling the Index and expect buyers to appear once wave X is complete provided pivot at 9449.06 stays intact.
NIFTY 1 Hour Elliott Wave Chart
WXY (double three) is one of the most common patterns in the theory of New Elliott Wave. This structure is commonly called double three Elliott Wave pattern. Market shows this structure very frequently nowadays in many instruments in almost all time frames. It is a very reliable structure by which we can make a good analysis. What is more important is it can give us good trading inputs with clearly defined levels of invalidation and destination areas.
Nifty Elliott wave view 7.14.2017
Short term NIFTY Elliott Wave view suggests the rally to 9709.3 ended Intermediate wave (1), and the pullback to 9449.06 low ended Intermediate wave (2). Rally from there could be unfolding as an Elliott wave Zigzag structure where Minor wave A is in progress as a Leading diagonal structure. Minute wave ((i)) ended as a double three Elliottwave structure at 9649.80 and Minute wave ((ii)) ended at 9596.30. Up from there Minute wave ((iii)) is unfolding as Elliott wave Triple three structure where Minutte wave (w) ended at 9700.7, Minutte wave (x) ended at 9642.65, Minutte wave (y) ended at 9830.05, second Minutte wave (x) ended at 9778.85 low, and Minutte (z) of ((iii)) is proposed complete at 9892.6.
Expect Index to pullback in Minute wave ((iv)) in 3, 7, or 11 swing to correct the cycle from 9595.50 low before the rally resumes higher again for 1 more leg in Minute wave ((v)) of A. Afterwards index should pullback in Minor wave B to correct the cycle from 9449.06 low in 3, 7 or 11 swing before another extension higher. We don’t like selling the Index and expect buyers to appear after Minute wave B pullback is complete provided the pivot at 9449.06 low remains intact.
NIFTY 1 Hour Elliott Wave Chart
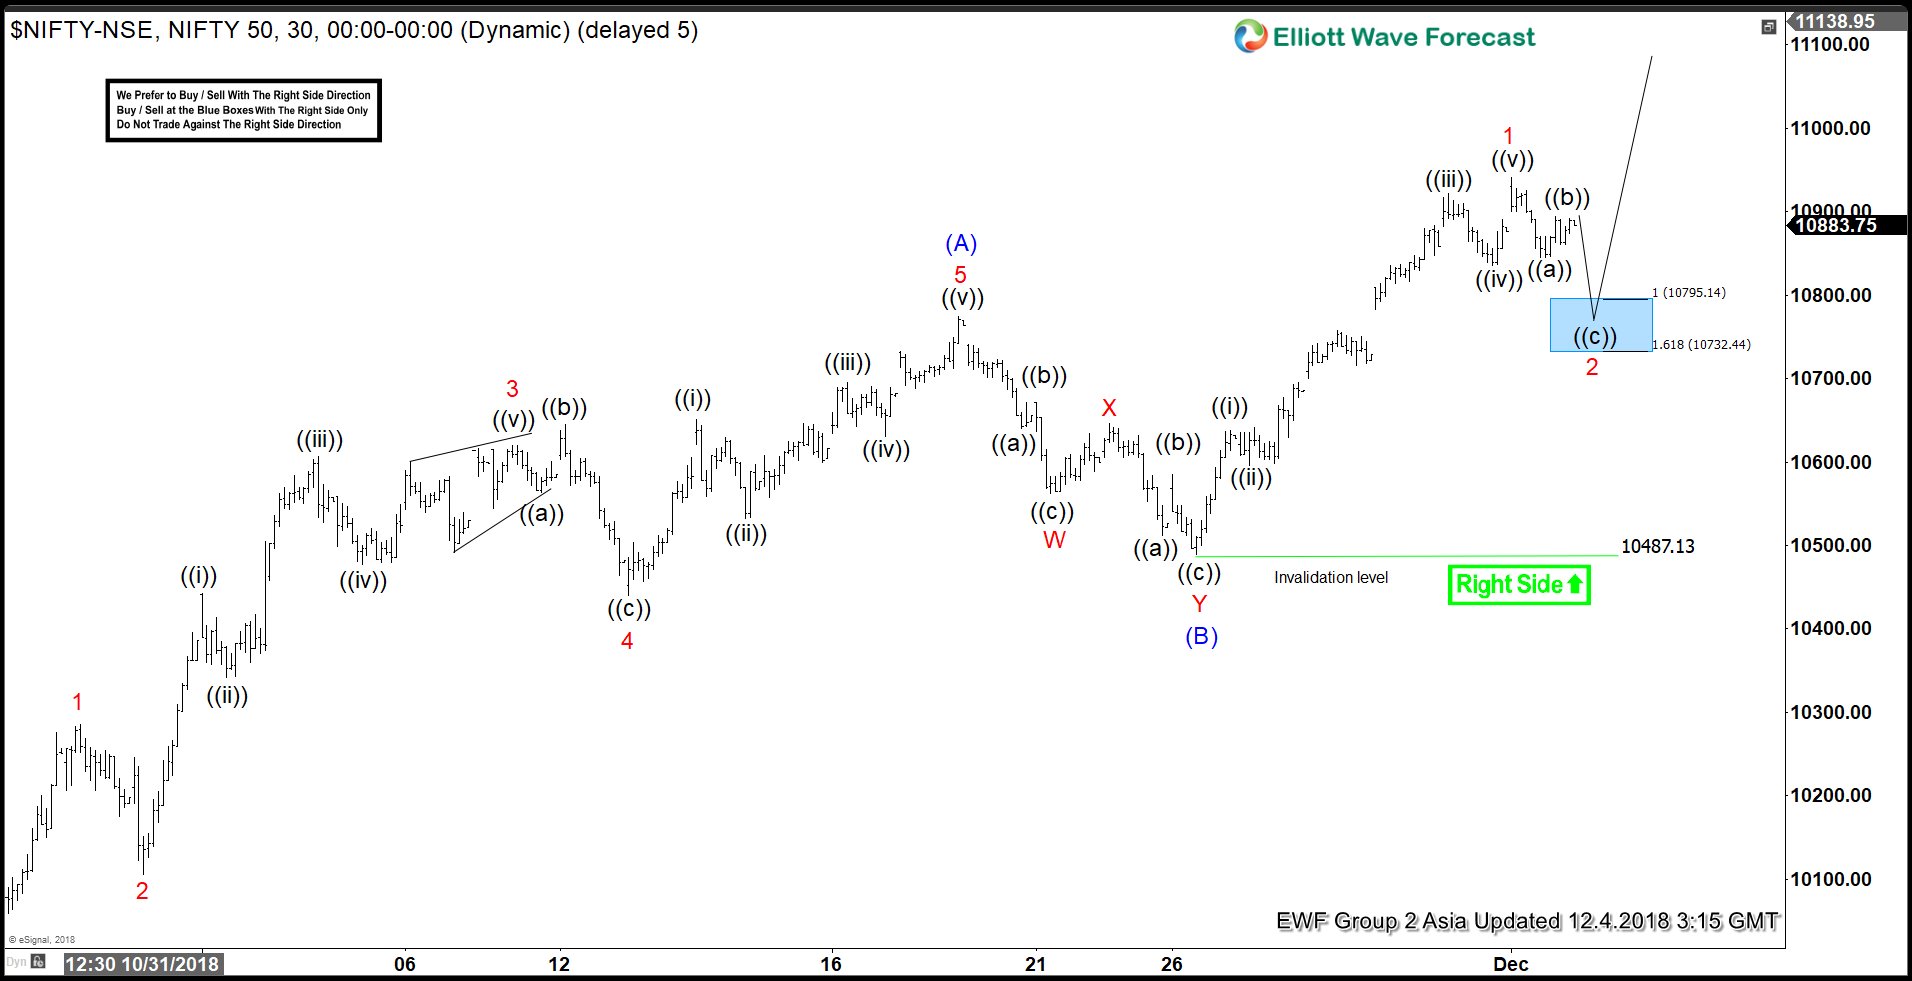
NIFTY is showing an incomplete sequence to the upside in the short term, favoring more upside while above 11/26 low (10487.1). Near term, cycle from 10/26 low (10004) remains in progress as a zigzag Elliott Wave structure. Intermediate Wave (A) ended at 10774.7 as 5 waves impulse Elliott Wave structure and Intermediate wave (B) ended at 10487.13 low.
Internal of wave (A) unfolded as an impulse where Minor wave 1 ended at 10285.1, Minor wave 2 ended at 10105.10, Minor wave 3 ended at 10619.55, Minor wave 4 ended at 10440.55, and Minor wave 5 of (A) ended at 10774.7. Intermediate wave (B) pullback unfolded as a double three Elliott Wave structure where Minor wave W ended at 10562.35, Minor wave X ended at 10646.25 and Minor wave Y of (B) ended at 10487.13.
Up from 10487.13 low, Intermediate wave © is in progress as a 5 waves impulse Elliott Wave structure where Minor wave 1 ended at 10941.20. The Index is now correcting cycle from 11/26 low within wave 2 in 3, 7, or 11 swing before the rally resumes. We don’t like selling the pullback and expect to find buyers in 3, 7, or 11 swing for more upside as far as pullback stays above 10487.13 low
NIFTY 1 Hour Elliott Wave Chart