Hello fellow traders. In this technical blog we’re going to take a quick look at the Elliott Wave charts of NIFTY , published in members area of the website. As our members know, we’ve been calling rally in the Index due to impulsive bullish sequences. We recommended members to avoid selling in any proposed pull back and keep buying the dips in 3,7,11 swings. Recently NIFTY made pull back that has unfolded as Elliott Wave ZigZag pattern . In the further text we are going to explain the Elliott Wave Pattern and trading strategy.
Before we take a look at the real market example, let’s explain Elliott Wave Zigzag.
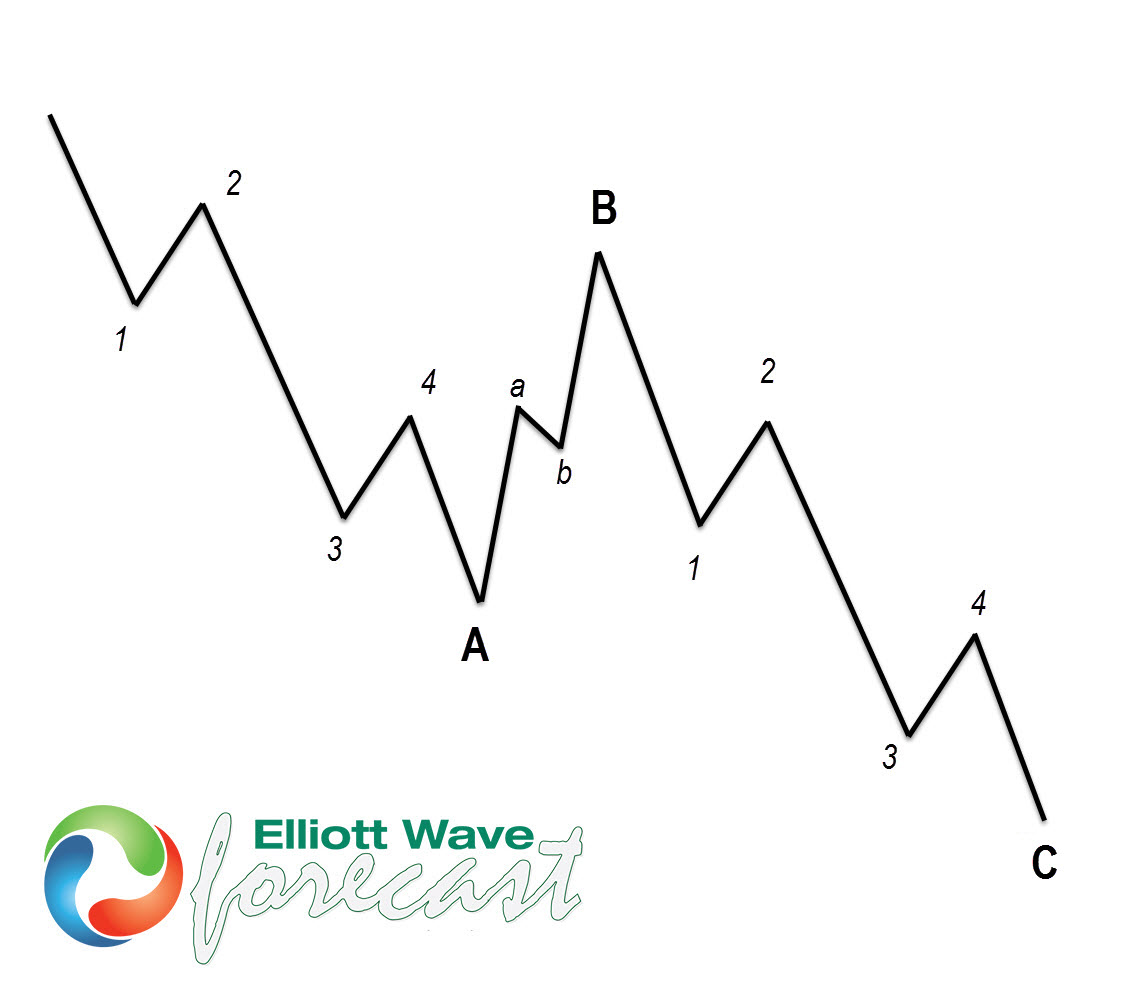
Elliott Wave Zigzag is the most popular corrective pattern in Elliott Wave theory . It’s made of 3 swings which have 5-3-5 inner structure. Inner swings are labeled as A,B,C where A =5 waves, B=3 waves and C=5 waves. That means A and C can be either impulsive waves or diagonals. (Leading Diagonal in case of wave A or Ending in case of wave C) . Waves A and C must meet all conditions of being 5 wave structure, such as: having RSI divergency between wave subdivisions, ideal Fibonacci extensions and ideal retracements.
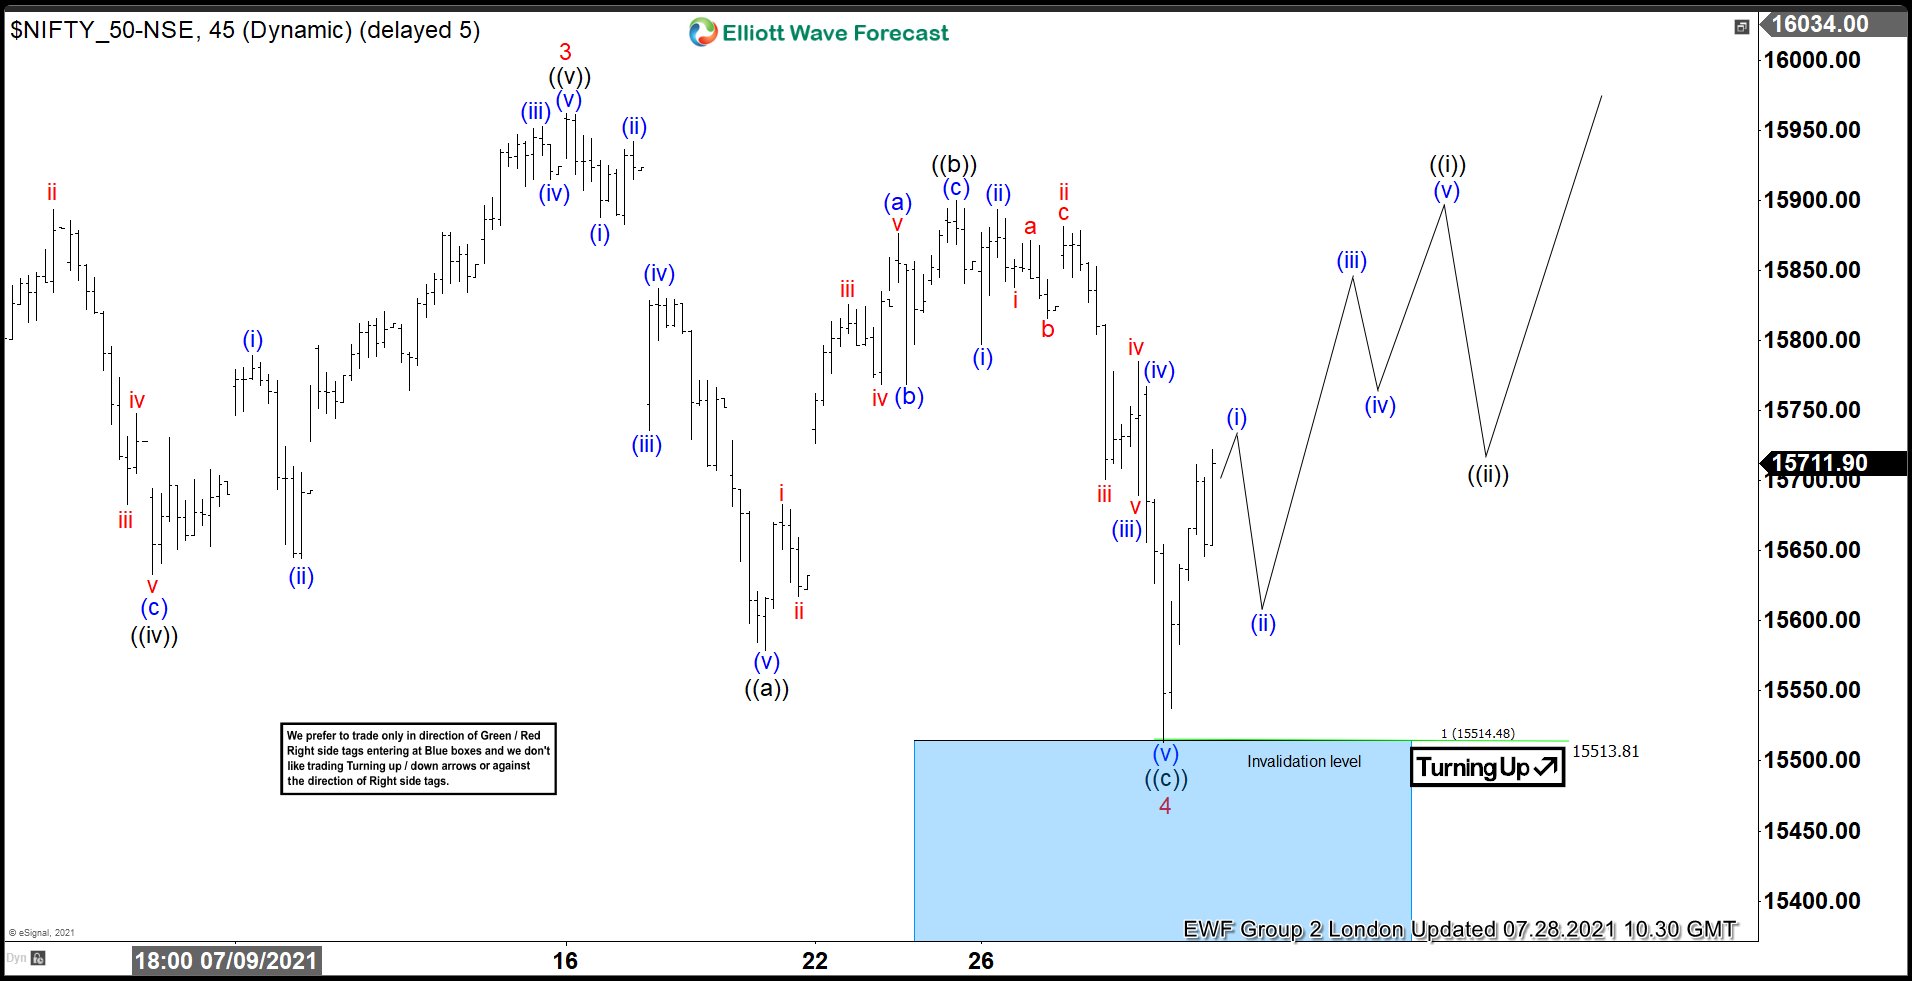
NIFTY Elliott Wave 1 Hour Chart 7.28.2021
At the chart below we can see what Elliott Wave ZigZag looks like in real market. Wave 4 red correction reached equal legs at 15514.48 (buyers zone). First leg of the 4 red pull back - ((a)) black, has subdivision in 5 waves. Then we got 3 waves bounce -((b)) black, after which we got 5 waves down in (©). As the main trend is bullish we favor the long side from the blue box. At this moment bounce has already reached 50 Fibs against the ((b)) black high. So any long positions from the blue box should be risk free. As far as the price stays above 15513.8 next leg up should be ideally in progress, however we would like to see break above 3 red peak to confirm.
You can learn more about Elliott Wave ZigZag Patterns at our Free Elliott Wave Educational Web Page .
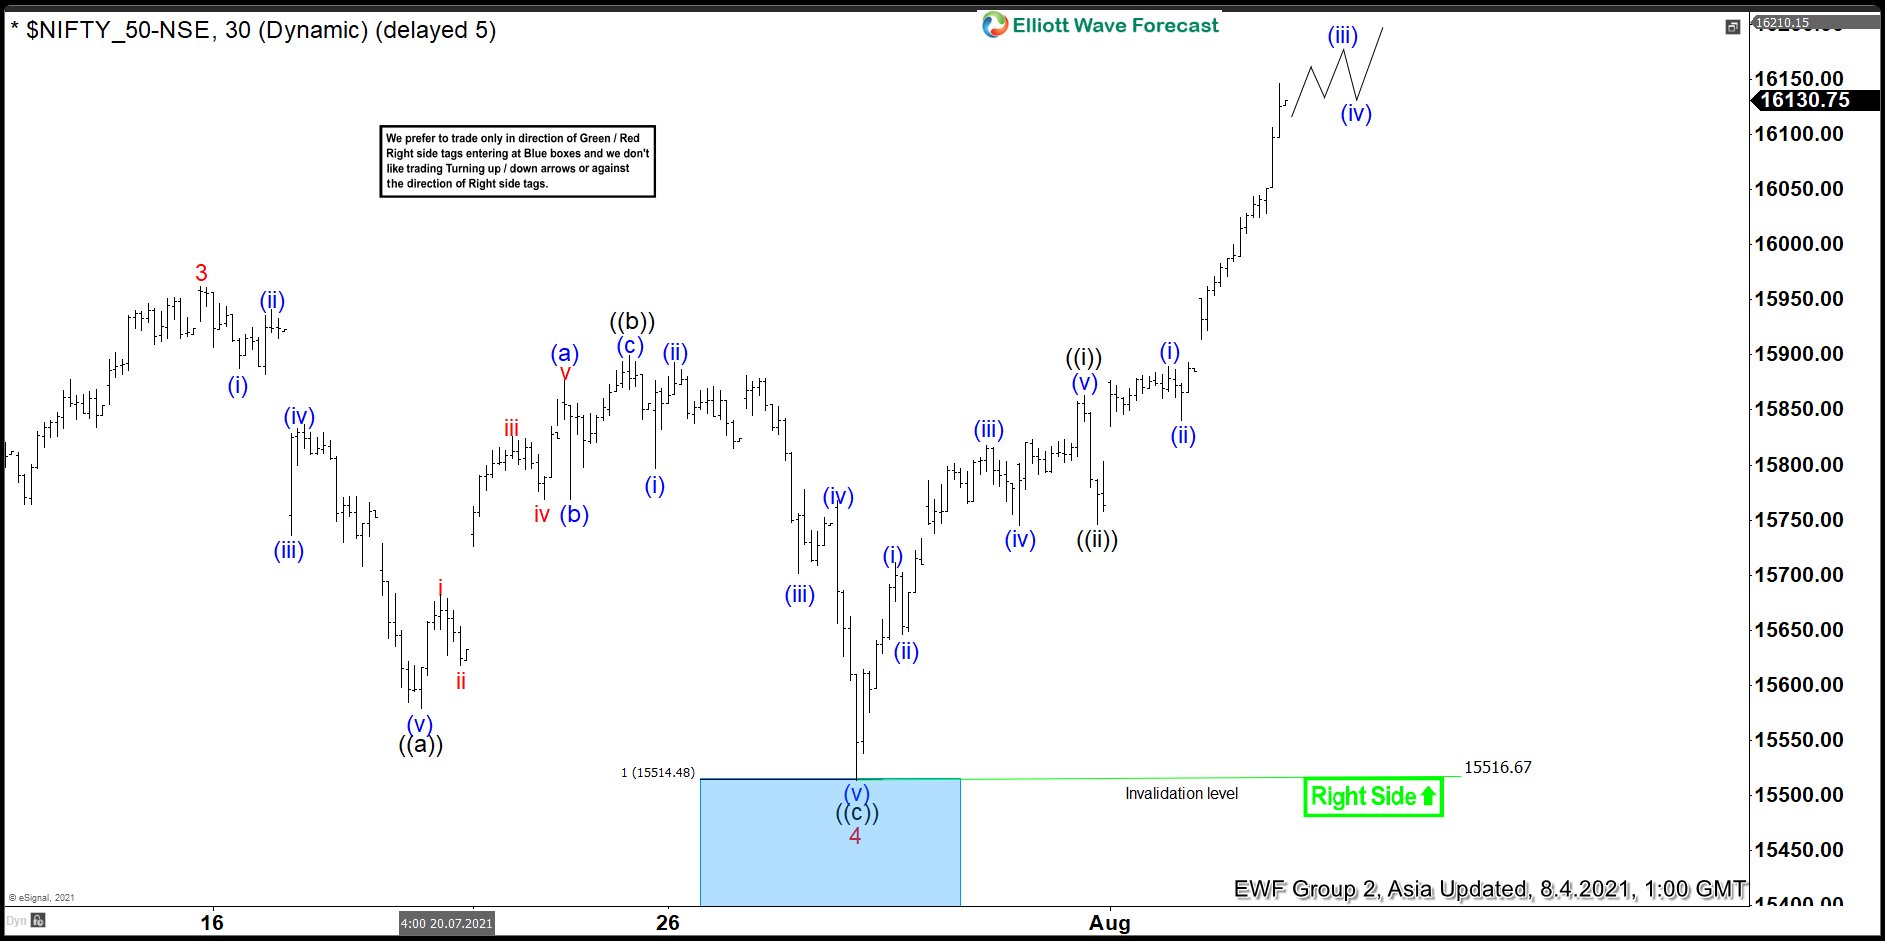
NIFTY Elliott Wave 1 Hour Chart 8.4.2021
15513.8 low held nicely and we got further extension when the price broke above previous 3 red peak. Index is now bullish against the 15513.8 low and expected to keep finding buyers in pull backs in 3,7,11 swings. We don’t recommend selling it and keep favoring the long side.Keep in mind that market is dynamic and presented view could have changed in the mean time. Not every chart is trading recommendation. You can check most recent charts in the membership area of the site. Best instruments to trade are those having incomplete bullish or bearish swings sequences. We put them in Sequence Report and best among them are shown in the Live Trading Room .
Elliott Wave Forecast