In this technical blog, we will look at the past performance of 1 hour Elliott Wave Charts of the Nifty index. In which, the decline from April 2022 high ended in a higher degree wave ((Y)) at 15183.40 low. And made a bounce higher in wave ((X)). The bounce from the lows unfolded in a corrective sequence & managed to reach the Elliott wave hedging area. When buyers & sellers get agreed on a similar direction in 3 swings at least. So we advised not to buy the index at this stage because sellers were expected to appear within the blue box area. Looking for a 3 wave reaction lower at least. We will explain the structure & forecast below:
Nifty 1 Hour Elliott Wave Chart
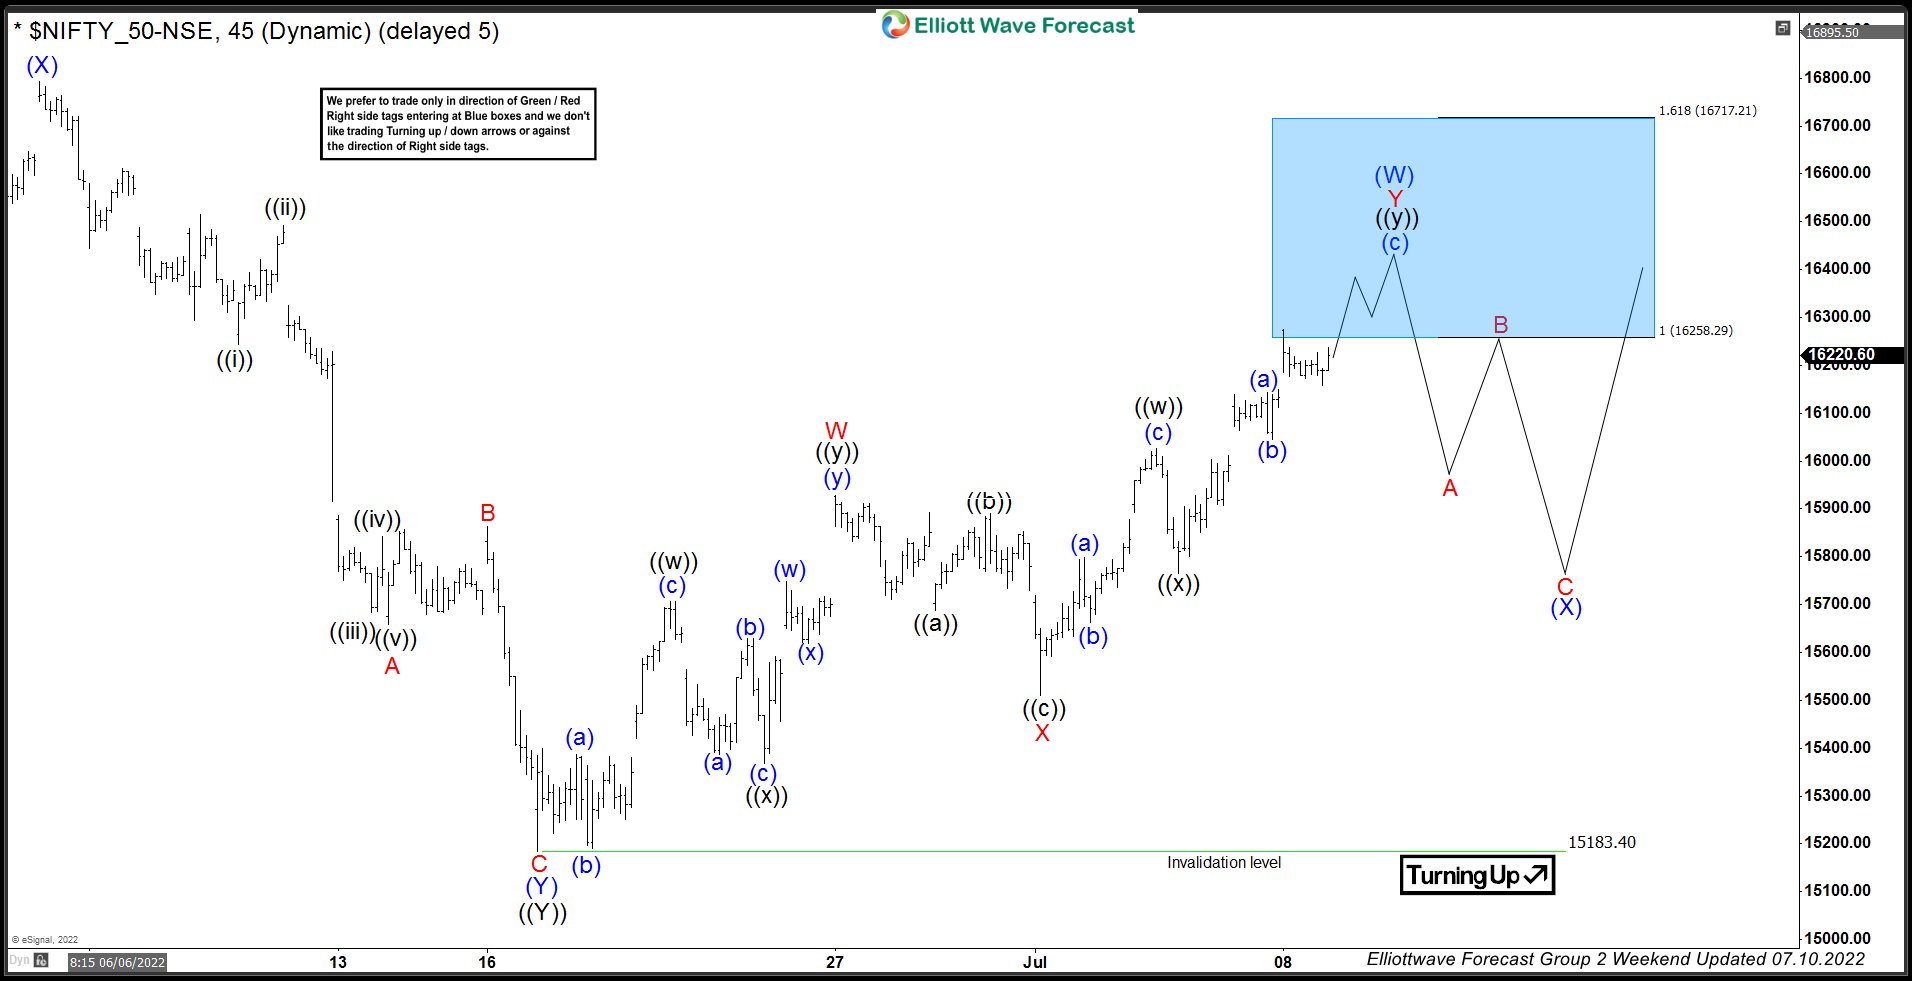
Here’s 1 Hour Elliott wave chart from the 7/10/2022 Weekend update. In which, the bounce from the lows unfolded as a double three structure where wave W ended at 15927.45 high. A pullback to 15511.05 low ended in wave X. Then started the Y leg higher towards 16258.29- 16717.21 blue box area from where sellers were expected to appear. Looking for a 3 wave reaction lower at least as per Elliott wave hedging.
Nifty 1 Hour Elliott Wave Chart

This is the Latest 1hr view from the 7/14/2022 London update. In which the index is showing a reaction lower taking place from the blue box area allowing shorts to get into a risk-free position shortly after taking the position. As the index has already managed to reach the 50% Fibonacci retracement area of the Y leg at the 15893.90 level.